
Abstract
Magnetic shape memory alloys are a promising but rather novel smart material class. A test stand was developed and verified to characterize commercially available samples. The test stand generates a homogeneous magnetic field within the air gap when no sample is inserted. Once a Ni-Mn-Ga sample is inserted, the field remains homogeneous in the horizontal but not in the vertical direction. Rotating the sample around the long edge leads to a mirrored behavior. An FEM simulation based on the simplified description of the switching effect was built up. The simulation reproduced the experimental data principle but not in detail. The simplified description of the effect helps to understand the behavior of magnetic memory alloys, but for a deeper understanding micro-simulations with precise boundary conditions are necessary.
Export citation and abstract BibTeX RIS

Original content from this work may be used under the terms of the Creative Commons Attribution 4.0 licence. Any further distribution of this work must maintain attribution to the author(s) and the title of the work, journal citation and DOI.
Introduction
Ni-Mn-Ga belongs to the group of magnetic shape memory alloys (MSMA) [1]. For the development of new technologies this material is interesting because of achievable strains up to 12% for specific alloys [2], a response time of 2.8 μs [3] and a switching time of the whole sample of 250 μs [4]. Taking the working frequency and the achievable strain into account as seen in figure 1, the potential of Ni-Mn-Ga can be seen more clearly. MSMA can be actuated about 100 times faster than thermal shape memory alloy and also show 10 to 100 times greater strain than piezo and magnetostrictive materials [5].

Figure 1. Classification of MSMA within the smart material class regarding strain and frequency [dataset from [6]].
Download figure:
Standard image High-resolution imageA possible actuation application, with low actuation force but high frequencies and high strains, can be implemented with MSMA, as implied by the material properties shown in table 1.
Table 1. Summary of the essential properties of selected smart materials in comparison to commercially available Ni-Mn-Ga alloy.
| Piezoceramic (PZT) | Magnetostrictive matrial (Terfenol-D) | Shape memory alloy (Ni-Ti) | MSMA (Ni-Mn-Ga) | |
|---|---|---|---|---|
| activation | electric | magnetic | thermal | magnetic |
| max strain in % | 0.15 [7, S.287] | 0.15 [7, p.287] | 3–7 [7, p.245] | 6...12 [2, 7] |
| max. frequency in Hz | 106 [8] | 104 [8] | 2 [8] | 103 [7] |
| response time | μs [8] | ms [8] | s [8] | μs...ms [3, 7] |
| max. blocking stress in MPa | 100 [8] | 70 [8] | 250 [8] | 3.5 [7] |
| max. operating temperature in °C | 150...300 [9, p.287] | 380 [9, p.287] | 400 [9, p.245] | 60 [7] |
| hysteresis | small [10] | small [10] | large [10] | moderate [10] |
Therefore, researchers propose many possible applications in this field. According to [11], MSMA is an excellent option for microactuator applications due to the enormous change in length in combination with a relatively short response time. In [8], the application of active materials is seen in micromechatronics and microrobotics and may be feasible with MSMA. It can also be seen that MSMA may be useful for applications that require strain performance greater than 1% in the frequency range between 50 Hz and 1 kHz [12]. There is currently no significant competition in this working range from other material classes in the smart material group [12].
The effect is explained in a simplified way by [1] and is described in more detail in [13, pp. 25–42]. A unit cell is characterized by the fact that the c-edge is shorter than the other two, as illustrated in figure 2. For further description, a two-dimensional view is sufficient. The relative permeability is higher in the direction of the c-edge compared to the a-egde. Consequently, the c-edge tends to align with the direction of an applied magnetic field. Furthermore, areas of crystalline orientation with the a- or c-edge are called 'variants'. The variants are divided by twin boundaries. For an understanding of how the effect works, an MSMA-element in a full compressed state without an applied magnetic field (c-edge aligned with the long edge of the unit cell) is considered, as illustrated in figure 2 step (A).

Figure 2. Explanation of magnetic shape memory effect. Reproduced from [1] with permission from copyright owner.
Download figure:
Standard image High-resolution imageAfter applying a magnetic field, which is strong enough to overcome the inner twinning stress, unit cells will switch their orientation (c-edge aligned with the direction of the magnetic field) and the twin boundaries will shift through the material, see step (B). If the magnetic field increases even more, more unit cells will switch up (C) until all c-edges are aligned with the direction of the magnetic field (D).
In the last decades, the scientific focus has been on a deeper understanding of the material [10, 14] and new production processes like 3D-printing [15, 16]. Critical open issues are working stability and fatigue behavior [14]. Applications like a biomedical micropump [17], an ultrafast pneumatic valve or a miniature circuit breaker [18] sound promising but the industrial breakthrough has not yet been achieved. Application engineers need established material characterization processes and design methods, but both have been studied only selectively [19, 20]. Therefore, this work presents an experimental stand for the characterization of MSMA elements and the influence of contrains during testing.
Experiments and simulations
The developed test stand is of modular design and allows actuation by an electromagnet. The sample is reset mechanically by an adjustable pressure spring. The setup of the test stand is shown in figure 3.
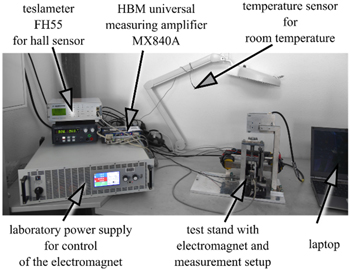
Figure 3. Used test stand for characterization of Ni-Mn-Ga samples.
Download figure:
Standard image High-resolution imageThe connection diagram can be seen in figure 4. Catman was used as the data acquisition software.

Figure 4. Connection diagram of the test stand.
Download figure:
Standard image High-resolution imageIn the next step, the measurement setup is explained in more detail and is illustrated in figure 5. The force sensor, based on strain gauges, is mounted on the base plate.

Figure 5. Detailed test stand view for measurement setup.
Download figure:
Standard image High-resolution imageAbove the force sensor, the sample is mounted by two sample holders and guided by a measuring rod with collar. The measuring rod is supported in the sliding guide, which is attached to the portal. At its upper end, a displacement sensor measures the elongation of the sample using the principle of optical triangulation. The clamping nut can be used to preload the compression spring via the sleeve and axial bearing. The axial bearing prevents the sample from being subjected to torsional stress by rotation of the clamping nut and friction on the contact end faces of the components. The sample is positioned centrally within an air gap in the magnetic circuit with coils. A hall sensor is placed in the air gap, which can be moved in the y- and z-axes by means of a positioning table. A positive connection (sample holder) was chosen, which encompasses the sample. For sample characterization at different preloads, the clamping nut with a fine thread was implemented. The fine thread ensures self-locking.
The used Ni-Mn-Ga-single-crystal sample has the size of 19 × 2.9 × 5.1 mm3. The manufacturer specifies elongation up to 6%, typically 3 to 5%, and cycle time up to 2 kHz [7].
For the characterization of the test stand, an FEM model of the electromagnet was built with the FEM-software COMSOL, see figure 6.

Figure 6. FEM-model of the electric circuit with the Ni-Mn-Ga sample.
Download figure:
Standard image High-resolution imageThe coil, which is made out of enamelled copper wire, was simulated with a wire diameter of 0.9 mm and a winding number of 3000. The core is of soft iron so a standard hysteresis model was chosen. Around the magnetic circuit a box with air properties was defined. A critical point of the verification measurement is, that it is only possible to measure with the hall sensor in the air gap out of the center shown in figure 7.

Figure 7. Description of the measurement point.
Download figure:
Standard image High-resolution imageFurthermore, the model should be verified with measurement data. For this purpose, the electrical current was gradually increased to the maximum allowed value of 2.8 A while the sample was completely blocked, see figure 8. The measurement was repeated three times.
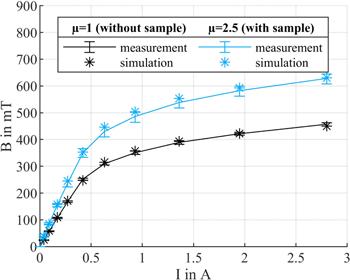
Figure 8. Magnetic field with increasing electrical current with and without sample.
Download figure:
Standard image High-resolution imageThe blocking state was chosen, because otherwise the permeability of the sample would change during the measurement. In the first step the hysteresis curve of the soft iron was adjusted, so that the curve of the measurement data without the sample fits with the simulation curve. In the second step, the simulation was performed varying the relative isotropic sample permeability until the results matched the measurement data with sample. The best fitting was found for μ = 2.5, which is close to the value given in the data sheet of the producer with 2.0 [7].
For activation of the Ni-Mn-Ga sample a global homogenous field is assumed, which had to be proven by the measurements. Two connected positioning tables allow to move the hall sensor stepwise by 1 mm in the edge area and 2 mm in the core area of the sample in the y- and z-direction.
For measurement along the whole sample length a sample holder of polylactides is necessary. The used current of 2.8 A was constant during all experiments.
Results
Figure 9 shows the magnetic field curve without sample in y-direction of measured data and simulation (black lines). At the boundaries of the sample (red lines) there is an increased magnetic field in the simulation.

Figure 9. Magnetic field in y-direction with and without sample, red dashed lines mark the sample position.
Download figure:
Standard image High-resolution imageThe reason for this is typically a numerical error due to boundary effects of the sample and the pole shoes of the electromagnet. For both scenarios without and with the sample, a uniform magnetic field within the geometry of the sample can be assumed. In the case of the inserted sample, an concentration of the magnetic field occurs. A uniform magnetic field of over 600 mT is generated within the sample geometry, which is over the saturation flux density according to the manufacturer [7]. The reason for the greater scattering of the measurement results with the specimen could be due to the repositioning of the specimen during installation and removal.
When measuring the magnetic field in z-direction without the sample, a uniform magnetic field is present within the sample geometry, as seen in figure 9. The measured magnetic field with sample shows an increase, but is not homogeneous over the sample length. For further investigations of this phenomenon, the sample was rotated by 180°. If there was an inherent material cause, the course of the magnetic field would now have to be mirrored. This could be proven, as can be seen in figure 10.

Figure 10. Magnetic field in z-direction with and without sample, red dashed lines mark the sample position.
Download figure:
Standard image High-resolution imageIt can be further observed that the magnetic flux density curves for both the rotated and non-rotated samples intersect at the z-point of the geometric centre of the sample. This is also the intersection point of the simulated result with an assumed global relative permeability of 2.5. The averaging therefore appears to be convenient as a first approximation.
In order to reproduce this phenomenon and exclude a defect sample, the tests were repeated and extended with another sample from the same manufacturer but from a different batch. The sample was rotated around each edge this time, illustrated in figure 11, and the measurement in z-direction was repeated three times.

Figure 11. Measurement setup with the second sample.
Download figure:
Standard image High-resolution imageFurthermore, the simulation was adjusted. An anisotrope permeability material model for the sample was chosen that permits the definition of varying relative permeability in x, y and z direction. Following the unit-cell model from [1], in the compressed state of the sample the c-edge with a relative permeability of 2.5 should be in the x-direction, the a-edge in the z-direction and b-edge in the y-direction. A- and b-edge were defined with a permeability of 90 following the data of the manufacturer [7]. The sample was divided into three parts in the simulation, shown in figure 12.

Figure 12. FE-simulation of the anisotrope permeability in case of configuration A.
Download figure:
Standard image High-resolution imageThe triangles at the ends with an angle of 45° were designed following the observation in [21], that the shifting of the twinning walls and the switching of the variants are blocked through the clamping areas. For the best fit of measurement und simulation results the relative permeability in the corners of sample was varied between 2 and 90, which are values from the manufactures [7], for a- and c-axes. The optimal parameter was 7 for all three axes and all four configurations. The comparison of measurements and simulation results for each configuration are presented in figures 13, 14, 15 and 16.

Figure 13. Comparison of measurement and simulation results for the magnetic field in z-direction with the second sample in configuration A.
Download figure:
Standard image High-resolution image
Figure 14. Comparison of measurement and simulation results for the magnetic field in z-direction with the second sample in configuration B.
Download figure:
Standard image High-resolution image
Figure 15. Comparison of measurement and simulation results for the magnetic field in z-direction with the second sample in configuration C.
Download figure:
Standard image High-resolution image
Figure 16. Comparison of measurement and simulation results for the magnetic field in z-direction with the second sample in configuration D.
Download figure:
Standard image High-resolution imageThe results obtained by the adjusted simulation model are found to be in reasonable agreement with the measurement results. The peak location changes in all four configurations in the correct position in z-direction. Also in the middle of the sample in z-direction the magnetic field fits between simulation and measurement. It therefore can be stated that the relative anisotrope permeability of 2.5 and 90 is correct for this position. Modeling the ends as separate triangles leads to basic agreement with the measurement results. In detail, however, there are also deviations which cannot be eliminated by this global simulation approach. Also, the determined values of 7 in these areas are in contradiction to the theoretical assumptions from [1], which shows that not all areas switched. Otherwise, it would be 2 or 90. An explanation could be, that the sample is attached at the ends to other componentens so these contact areas can't switch easily and an uncomplety switched area arises. The observation from Chmielus et al. can be confirmed by the presented investigations [21]. In one case the ends of the sample are both glued to the other components. In the other case only one end is glued and the other one is free. In the latter described case, the measured elongation of the sample was higher. If the triangular areas cannot switch completely, then the theoretically maximum possible elongation cannot be achieved. For detailed considerations, therefore, micro-simulations are necessary, which represent the different variants in a high local resolution [22, 23]. For global considerations, however, this approach is sufficient.
Another test with a reduced preload of 15 N and a current of 2.8 A is illustrated in figure 17.

Figure 17. Tilting of the sample in depending on the configuration.
Download figure:
Standard image High-resolution image
The clamp was replaced by two holders to allow relative movements. Due to the design of the test stand, there is a long guide length to the second bearing point, so the vertical stiffness at the top of the specimen is low. In combination with the local inhomogeneities and the resulting Maxwell forces, this leads to contact with the coil core in the case of configurations A and B but not in C and D. This must be taken into account, for example, in the actuator design, especially in the design of the sample guides.
Conclusion
It was shown that samples of Ni-Mn-Ga can be characterized by means of the test stand. Furthermore, a simulation approach was presented which provides a simple way for static simulation of Ni-Mn-Ga samples. During the experiments, inhomogenities in the permeability of Ni-Mn-Ga samples occur that can be explained because of mounting constrains in agreement with the literature. Practical consequences of this observation are a reduced maximum elongation and challenges for guiding the samples. The established simplified description of the magnetic shape memory effect is fitting for global understanding and assertions. For more detailed and complex cases micro simulations are necessary.
Data availability statement
The data that support the findings of this study are available upon reasonable request from the authors.
Funding information
The publication of this article was funded by the Chemnitz University of Technology.