
Abstract
To quantify design wind load of photovoltaic panel array mounted on flat roof, wind tunnel tests were conducted in this study. Results show that the first and the last two rows on the roof are the most unfavorable ones regarding to the wind load. Influences of array spacing, panels' tilt angle and parapet height on wind load of the panels are studied. Most unfavorable lift force of panels decreases with increase of array spacing for middle located panels. The aerodynamics are similar to flow over repeated hills. Middle located unit got greater turbulence, which leading to unfavorable Cfp_min. While the changing amplitude of most unfavorable wind pressure is small increase with array spacing. Cfp_max and Cfp_min of panel units shows quite strong dependence on tilt angle. There is significant pressure equalization for small tilt angle cases. The local flow separation is responsible for Cfp_min of larger tilt angle cases. Parapet height of 2 h (h is the panel height projected on the vertical plane) is the critical height for Cfp_max and Cfp_min. Increasing parapet height can significantly reduce the wind load of panel units. Design pressure coefficient of the basic working condition with different area sizes at different location are proposed.
Export citation and abstract BibTeX RIS

Original content from this work may be used under the terms of the Creative Commons Attribution 4.0 licence. Any further distribution of this work must maintain attribution to the author(s) and the title of the work, journal citation and DOI.
1. Introduction
Roof mounted photovoltaic (PV) panel systems are widely used in modern society. The natural flow of wind effectively reduces the elevated temperature and the direction of wind flow plays a very prominent role in heat evacuation for PV panel systems (Agrawal et al 2021). And wind load is one of controlling loads in design of these systems, comprehensive study of wind load characteristics and aerodynamic mechanisms of photovoltaic panels is an essential work for design.
Aerodynamic characteristics of solar panels mounted on roofs are not only affected by turbulence in the atmospheric boundary layer, but also by panel size and installation-related parameters, such as tilt angle, array spacing, panel size and position (Kopp et al 2012, Stathopoulos et al., 2012, Cao et al 2013, Li et al 2019a, Liu et al 2021a, Liu et al 2021b). Stathopoulos et al (2014) studied wind effect on solar panels mounted on the roofs of 7 m and 16 m high buildings, and it was found that height of building has little effects on wind load of panels. Li et al (2019b) also carried out a numerical investigation to prove that both the row spacing of PV array and the building height only have slight influence for flat roofs. Kopp (2014) investigated wind load on Multi-row solar panels by adopting building with height ranging from 7.3 m to 21.9 m, influence of building height, aspect ratio and panels tilt angle on wind effect on panels are studied. Results show that wind loads do not obviously depend on tilt angle, for arrays with tilt angle of 10° and above. Jiang et al (2020) conducted both analytical and experimental methods to determine the wind loads, finding out that the maximum vertical load occurs with the tilt angle of 15°and the maximum horizontal thrust load occurs with the tilt angle of 90°. Wang et al (2018) studied the effects of parapet height on wind loads of solar panels on flat roof, and found that most critical positive peak pressure coefficients generally decrease with increase of parapet height. Meanwhile, Banks (2013) and Kopp (2014) claimed that conical vortices of buildings play a key role on wind effect of solar panels. Wang et al (2020) found that small-scale local separations at the higher edges of the solar panels are also responsible for the large peak of uplift. Alrawashdeh and Stathopoulos (2020) proved that geometric test scaling is an important parameter in simulating solar panel models in atmospheric boundary layer wind tunnels, particularly when considering design wind loads. Although there is a number of studies above focusing on wind loads on roof top solar arrays, many of them are contradictive (Stathopoulos et al 2012) and it is difficult to generalize experimental data from different wind tunnel tests for the application of building code provisions. Thus, it is necessary to do more sophisticated and systematic studies on wind loads on rooftop PV panel arrays.
Some literatures gave the recommended design value for photovoltaic panels based on the wind tunnel tests. Cao et al (2013) gave the formulated recommendation values through taking account the effects of PV panel tilt angle. Kopp and Banks (2013) suggested that most unfavorable extreme wind pressure coefficient and design wind load of roof mounted photovoltaic panels should be given in combination with roof partition based on ASCE code. Stathopoulos et al (2015) conducted a literature review and comparison of current wind load effects on ground and roof mounted photovoltaic panel systems. Naeiji et al (2017) reported critical locations on flat roofs and presented codified area-averaged graphs based on large-scale model tests. They found that it is difficult to obtain widely accepted design wind load based on the existing studies. Thus, it is necessary to introduce more helpful method or formulas for design provision.
In this study, the influences of panel arrays' parameters such as tilt angle and array spacing, as well as parapet height on wind load characteristics of PV panels are specially studied. Based on the Arrangement of the actual structure, the recommended values of design wind load of panel units are given for different area size and different location. These results can provide a reference for engineering practice and relevant specifications.
2. Outline of wind tunnel experiments
2.1. Models and experimental configurations
2.1.1. Test model
The geometric scale ratio of wind tunnel test model is 1:25. A building with size Lp × Bp × Hp = 20 m × 20 m × 10 m and flat roof is adopted in this study, and the scaled model size is Lm × Bm × Hm = 800 mm × 800 mm × 400 mm.
PV panel arrays are arranged symmetrically along the center line of the building, and each row includes 16 panels. The full size of a single panel is 1 m × 1.5 m. The model of the panel used in the experiment is named as module, and the module size is 40 mm × 60 mm. Every four module form a panel unit, mounted on one single bracket. Two types of modules are adopted in the experiment, one is the dummy module without pressure taps, and the other is the measuring module with pressure taps. Two types of measuring tap arrangement are applied for each panel, as shown in figure 1. The panels located at the first and last row is arranged with 6 measuring taps on each upper and lower surface, a total of 12 measuring taps, so each module unit has 48 measuring taps. All the other Panels are arranged with 4 measuring taps on each upper and lower surface, a total of 8 measuring taps, each unit has 32 measuring taps. Figure 1 labels a total of 8 units from M1 to M8 for the study of wind load characteristics.
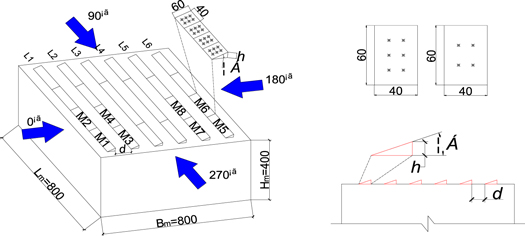
Figure 1. Test model and wind direction (Unit: mm).
Download figure:
Standard image High-resolution image2.1.2. Experimental configurations
In this study, the influence of panel design on wind load, such as panel tilt angle and array spacing are considered. These parameters were used based on a project, and they are similar to Cao et al (2013) and Wang et al (2020)).
2.1.2.1. Array spacing
For investigating the effect of array spacing, the cases of fixed panel tilt angle of 20° are adopted. The array spacing d (as defined in figure 1) is set 89.5 mm, 60.3 mm, 40.9 mm for model, and the number of array rows varies from 5 to 7 for the changing of array spacing. They are named case No.1, 2 and 3.
2.1.2.2. Tilt angle
Panel tilt angle is related to the economic benefits of PV panels. If the panel inclination is too large, the solar energy absorbed by the panels might be small. If the tilt angle is too small, the number of PV panels need to be reduced. In this paper, the commonly used tilt angle of the PV panel, 10°, 20°, 30° and 40°, are studied.
2.1.2.3. Parapet height
Four different parapet heights, 1.0 h, 1.4 h, 2 h and 2.7 h, were set respectively for this study. h is the net panel height from roof. In these cases, panel tilt angle is 20°, panel vertical height h is 20.5 mm for model, and array spacing d is 60.3 mm for model.
2.2. Upstream flow simulation
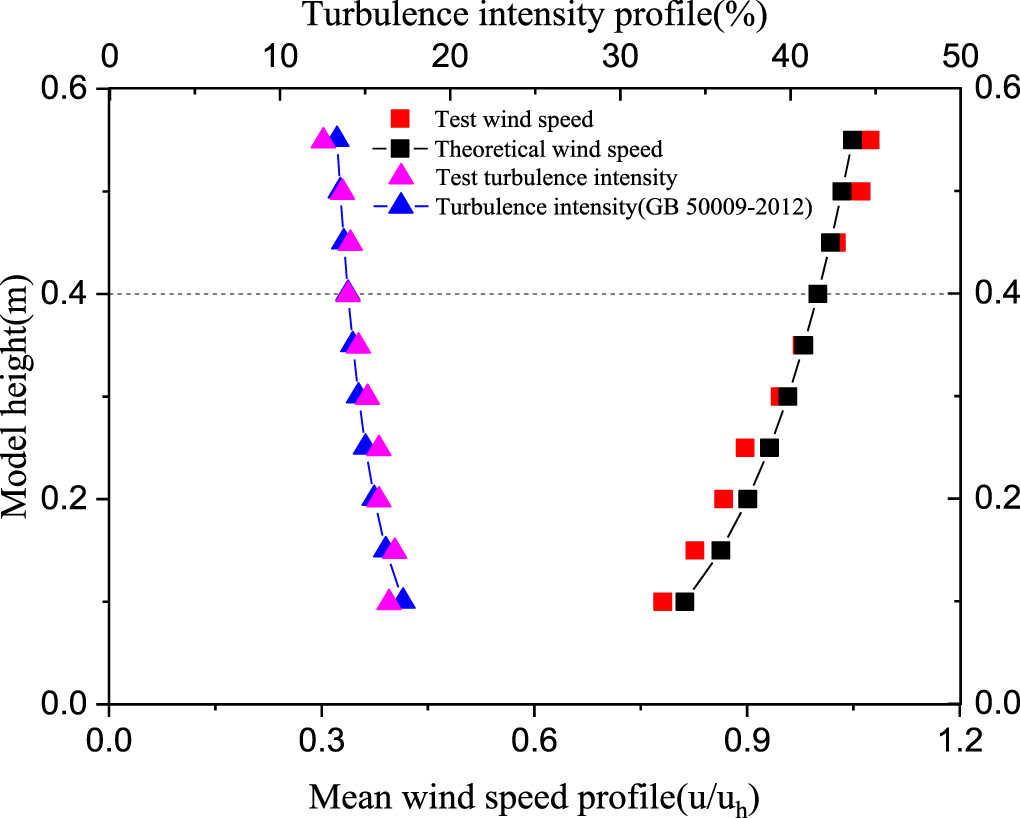
The test was conducted in the atmospheric boundary layer wind tunnel of Hunan University. The test section of wind tunnel is 30 m long, and the cross section is 3 m × 2.5 m. The mean wind speed profile with power law exponent of 0.15 is adopted to simulate the open terrain. The mean wind speed and turbulence intensity profiles are shown in figure 2, and spectra of the streamwise velocity fluctuation was shown in figure 3. The wind speed at 40 cm high above the floor (roof height) is used as the reference wind speed, which is 10 m s−1. The velocity scale is 1/3. That means the mean wind speed at the roof height in full scale is 30 m s−1. The time scale in this experiment becomes 1/8.33. The definition of wind direction angle is shown in figure 1, and test is performed with 10° interval.

Figure 2. Mean wind speed and turbulence intensity profile.
Download figure:
Standard image High-resolution image
Figure 3. Spectra of the stream wise wind velocity at the roof height.
Download figure:
Standard image High-resolution image2.3. Sampling setting
The multi-channel synchronous pressure measurement system was used to measure the wind pressure of taps. The sampling frequency was 330 Hz, 10 samples are collected for each measuring case. Each sample is 90 s, corresponding to 10 min in full scale.
2.4. Data processing
Pressure coefficients of the upper and lower surface of the PV panel model are given by equations (1) and (2):


where Cpu (i ,t), Cpl (i ,t) are the time history of pressure coefficients of the upper and lower surface measuring tap i; pu (i,t), pl (i,t) are the time history of wind pressure acting on the measuring tap i of upper and lower surface; p0 is wind tunnel static pressure; ρ is air density, ρ = 1.225 kg m−3; uh is the mean wind speed at the building height, which is 10 m s−1.
The net pressure coefficient at the measuring point i of the model is:

Cpn (i,t) is time history of net wind pressure coefficient at the measuring point i. The positive net pressure acts downward on a module or a panel.
The force coefficient of the panel unit, Cfp (t), can then be obtained as follows:

where Ai is tributary area of the measuring point i, n is the number of measuring points on the panel unit. The mean force coefficient Cfp_mean of panel unit can be obtained by averaging the time series of Cfp (t). For extreme force coefficient, the Cook-Mayne method is adopted, and the extreme value quantile of 80% is used accordingly for the 50 years return period design. Maximum and minimum force coefficients of the panel unit are expressed as Cfp_min, Cfp_max.
3. Wind load characteristics of panels under typical conditions
3.1. Mean wind load distributions for panels under typical wind
Figure 4 shows the contours of the mean pressure coefficient distribution of the panel array at 0° and 180° for Case 1. When wind direction is 0°, the mean pressure coefficients on the upper and lower surfaces of the row L1 and L2 are both negative. These results indicate that the pressure equalization phenomenon might be induced for the two sides of some panels. Pressure equalization is a phenomenon that occurs in multi-layer systems because openings in various layers allow the external wind pressures to be transmitted to interior layers, reducing the net loads across these layers (Bienkiewicz and Endo, 2009). And the absolute value of pressure coefficients of the upper surface is larger than that of the lower surface. The net pressure coefficients distributed on these two rows are negative, that means these two rows of panels are subjected to suction. Both upper and lower surface pressure coefficients of the last four rows of panels (L3-L6) become positive, and the values are relatively close to zero. Thus, the net pressure coefficient for L3-L6 is also close to null. The last four-rows No. Back located rows L3-L6 are obviously sheltered by the front-located panels. Pressure equalization of windward row panels is more significant than that of leeward row panels.
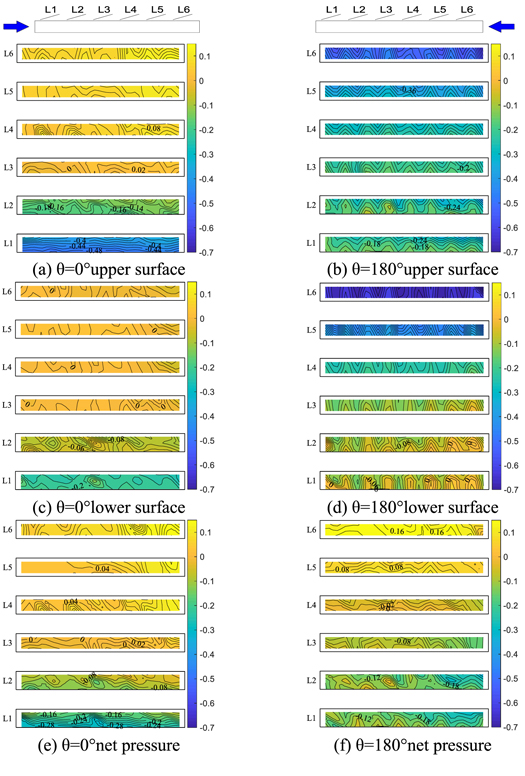
Figure 4. Local pressure coefficient distribution for wind direction of 0° and 180°.
Download figure:
Standard image High-resolution imageWhen wind direction angle is 180°, the lower surface of the panel is facing the attacking wind. It is clear that the mean pressure coefficients of the upper and lower surfaces of row No. L6 and L5 near windward leading edge of the roof are all negative. These results also indicate the pressure equalization phenomenon. As the absolute mean pressure coefficients at the upper surface are smaller than that on the lower surface, the net pressure coefficients are positive. That means the mean wind loads on L6 and L5 rows of the panel are along the downward direction, is overpressure. The negative pressure coefficients on the upper surface of row L1-L4, far from the front edge of windward, are greater than those on the lower surface. The net mean pressure coefficients of those panels are then negative, showing the effect of lifting up.
Combining the results of wind direction angles of 0° and 180°, the mean wind load characteristics of the front two rows and the last two rows in the array are more critical. Therefore, the force coefficients acting on the four rows of panels are studied in the following.
3.2. Typical position of photovoltaic panel units
Considering the symmetry, wind force acting on panel units M1-M8 as shown in figure 1, are checked. Figure 5(a) shows the variation of Cfp_mean , Cfp_max, Cfp_min of panel units M1-M4 with wind direction. It can be seen from figure 5(a) that the Cfp_mean of panel units M1-M4 show similar varying trend with wind direction, except for the wind direction from −60° to 60°. The most unfavorable values of Cfp_max for M1 ̃ M4 appear in the range of 290°−350. Such results indicate that when wind comes along the oblique direction from the back side, the maximum overpressure can reach the peak value. This may be induced by the conical vortex generated from the leading corner of building. The most unfavorable extreme wind pressure values of M1 and M3 panels are relatively large. That means the panel near the building edge may receive larger downward wind load than those located inner region. The Cfp_min of M1 ̃ M4 vary in the range of 0.0~−1.80. The most unfavorable wind direction angle occurs in the range of 200°~220°. That means when wind comes from this direction, the panels will experience the largest suction force along the upward direction. Among the four panels, most unfavorable extreme wind suction is the M2 and M3 panels. The most unfavorable values of Cfp_max and Cfp_min for each panel unit are shown in figure 5(b). It can be checked the suction for panels tends to be greater than pressing force in terms of absolute values. That means the vortex induced at the leading edge of building may be the main reason of such results.
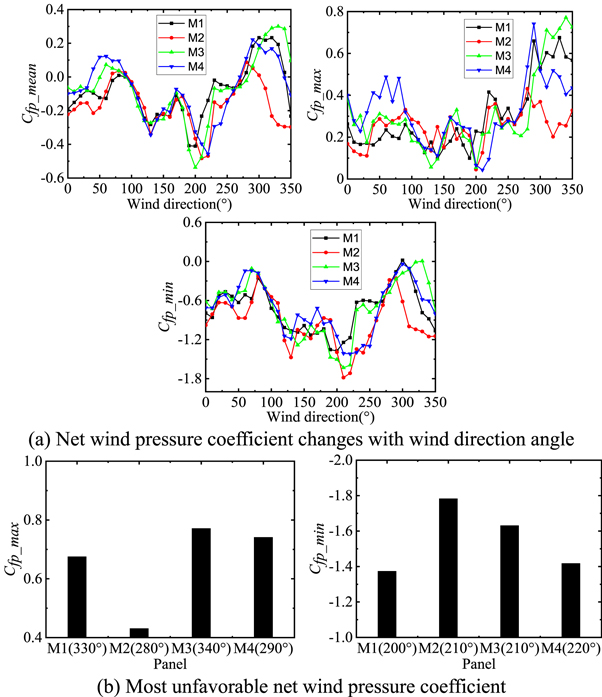
Figure 5. Net wind pressure coefficient at M1-M4 panel.
Download figure:
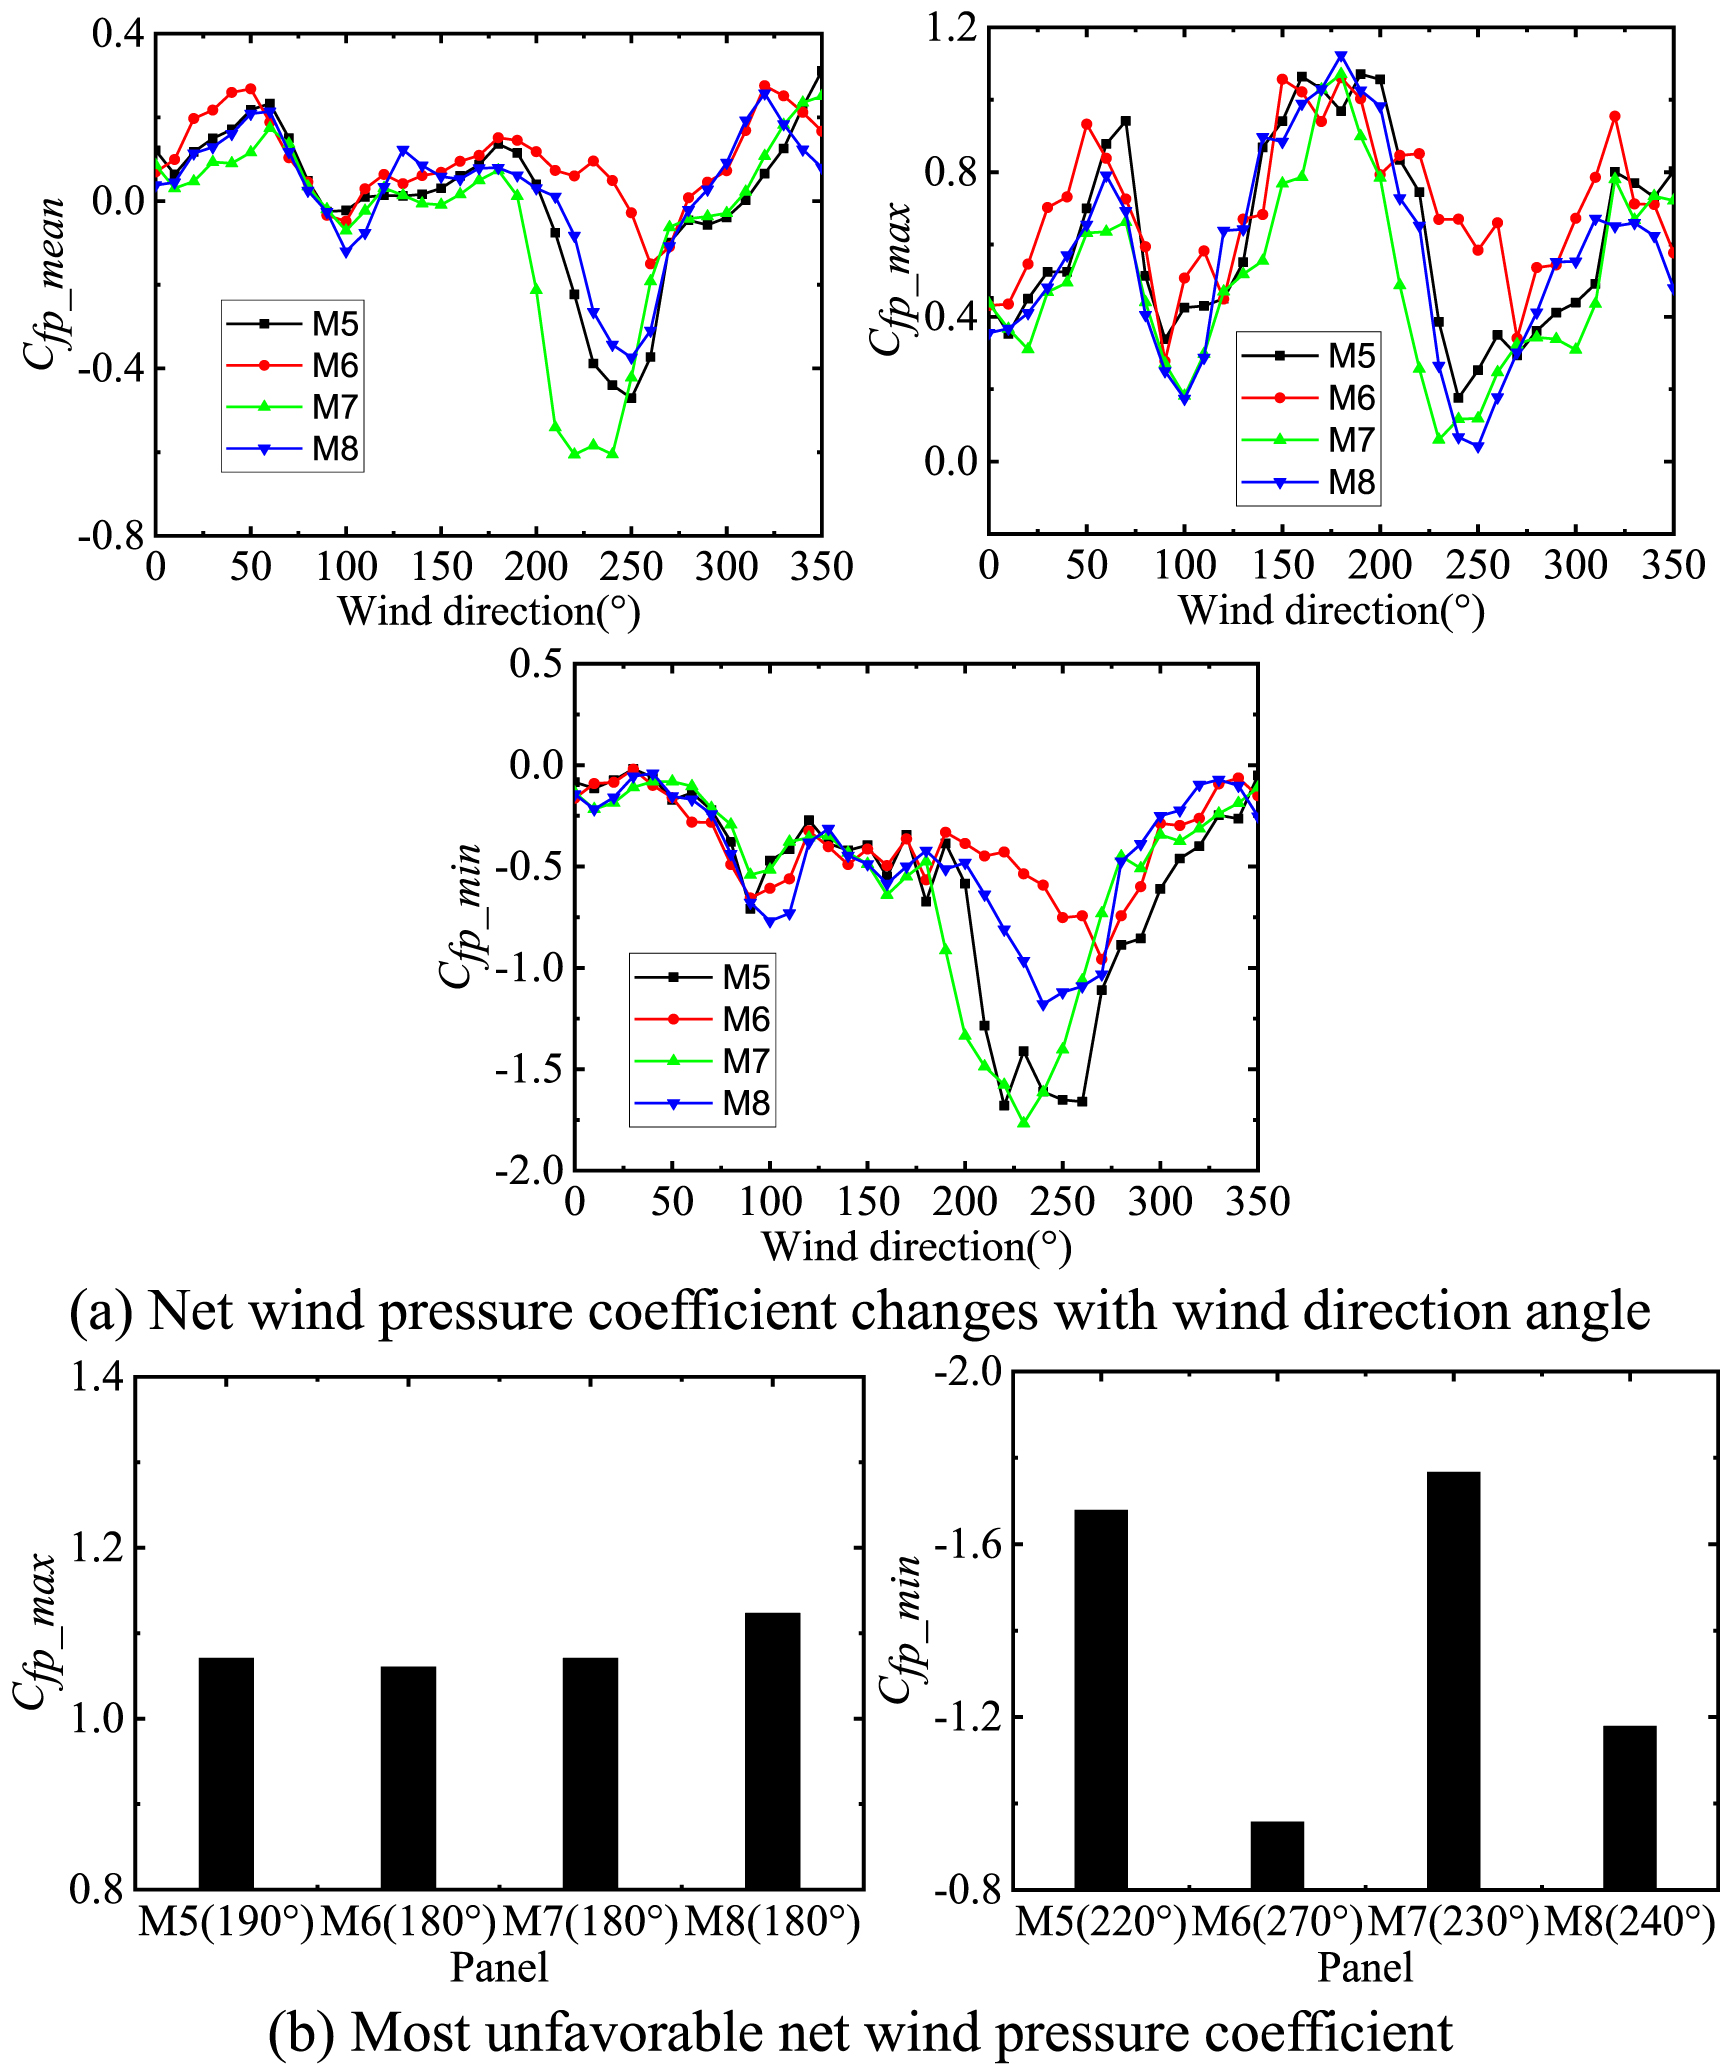
Standard image High-resolution imageFigure 6 shows how the Cfp_mean , Cfp_max, Cfp_min of panel units M5-M8 vary with wind direction angle, and the corresponding most unfavorable values on the panel units. Cfp_mean of M5-M8 also changes with wind direction similarly. Most unfavorable Cfp_max of M5 ̃ M8 between 180°−190°, and the largest values are close to 1.2. The difference of most unfavorable Cfp_max is quite small. Such results suggest that the maximum wind load for the panel is not sensitive to the location. Cfp_min of M5 ̃ M8 are also within the range of 0~−1.80, and the most unfavorable wind direction angle range are about 220°~270°. Among the four panel units, the panels with the larger most unfavorable extreme wind suction are M5 and M7. That means the vortex induced by the edge near M5 and M7 is still the major reason for inducing such high suction. And if the panels are close to the edge, they may endure higher peak suction.
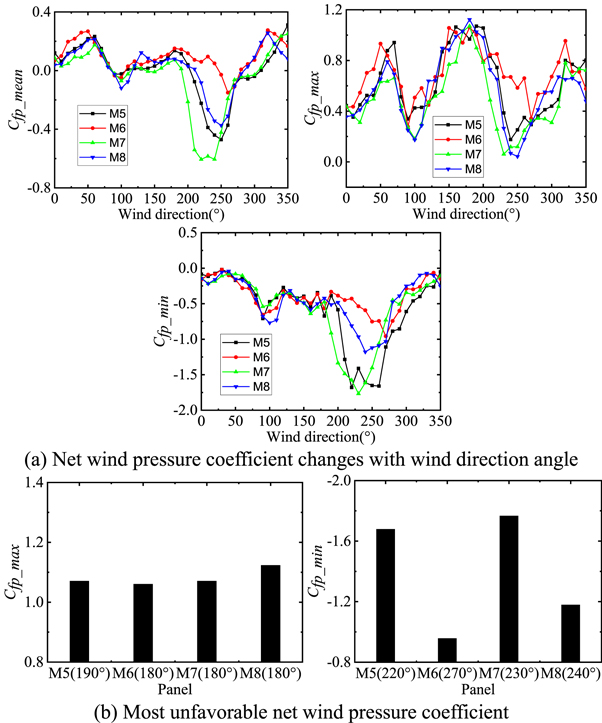
Figure 6. Net wind pressure coefficient at M5-M8 panel.
Download figure:
Standard image High-resolution imageAccording to the above research results, panels units which are located close to the roof edge may endure stronger wind load. Thus, the parametric influence analysis of wind load characteristics of panel units in the following paper is carried out for M1, M3, M5 and M7.
4. Effect of panels' design parameters and parapet height
4.1. Array spacing
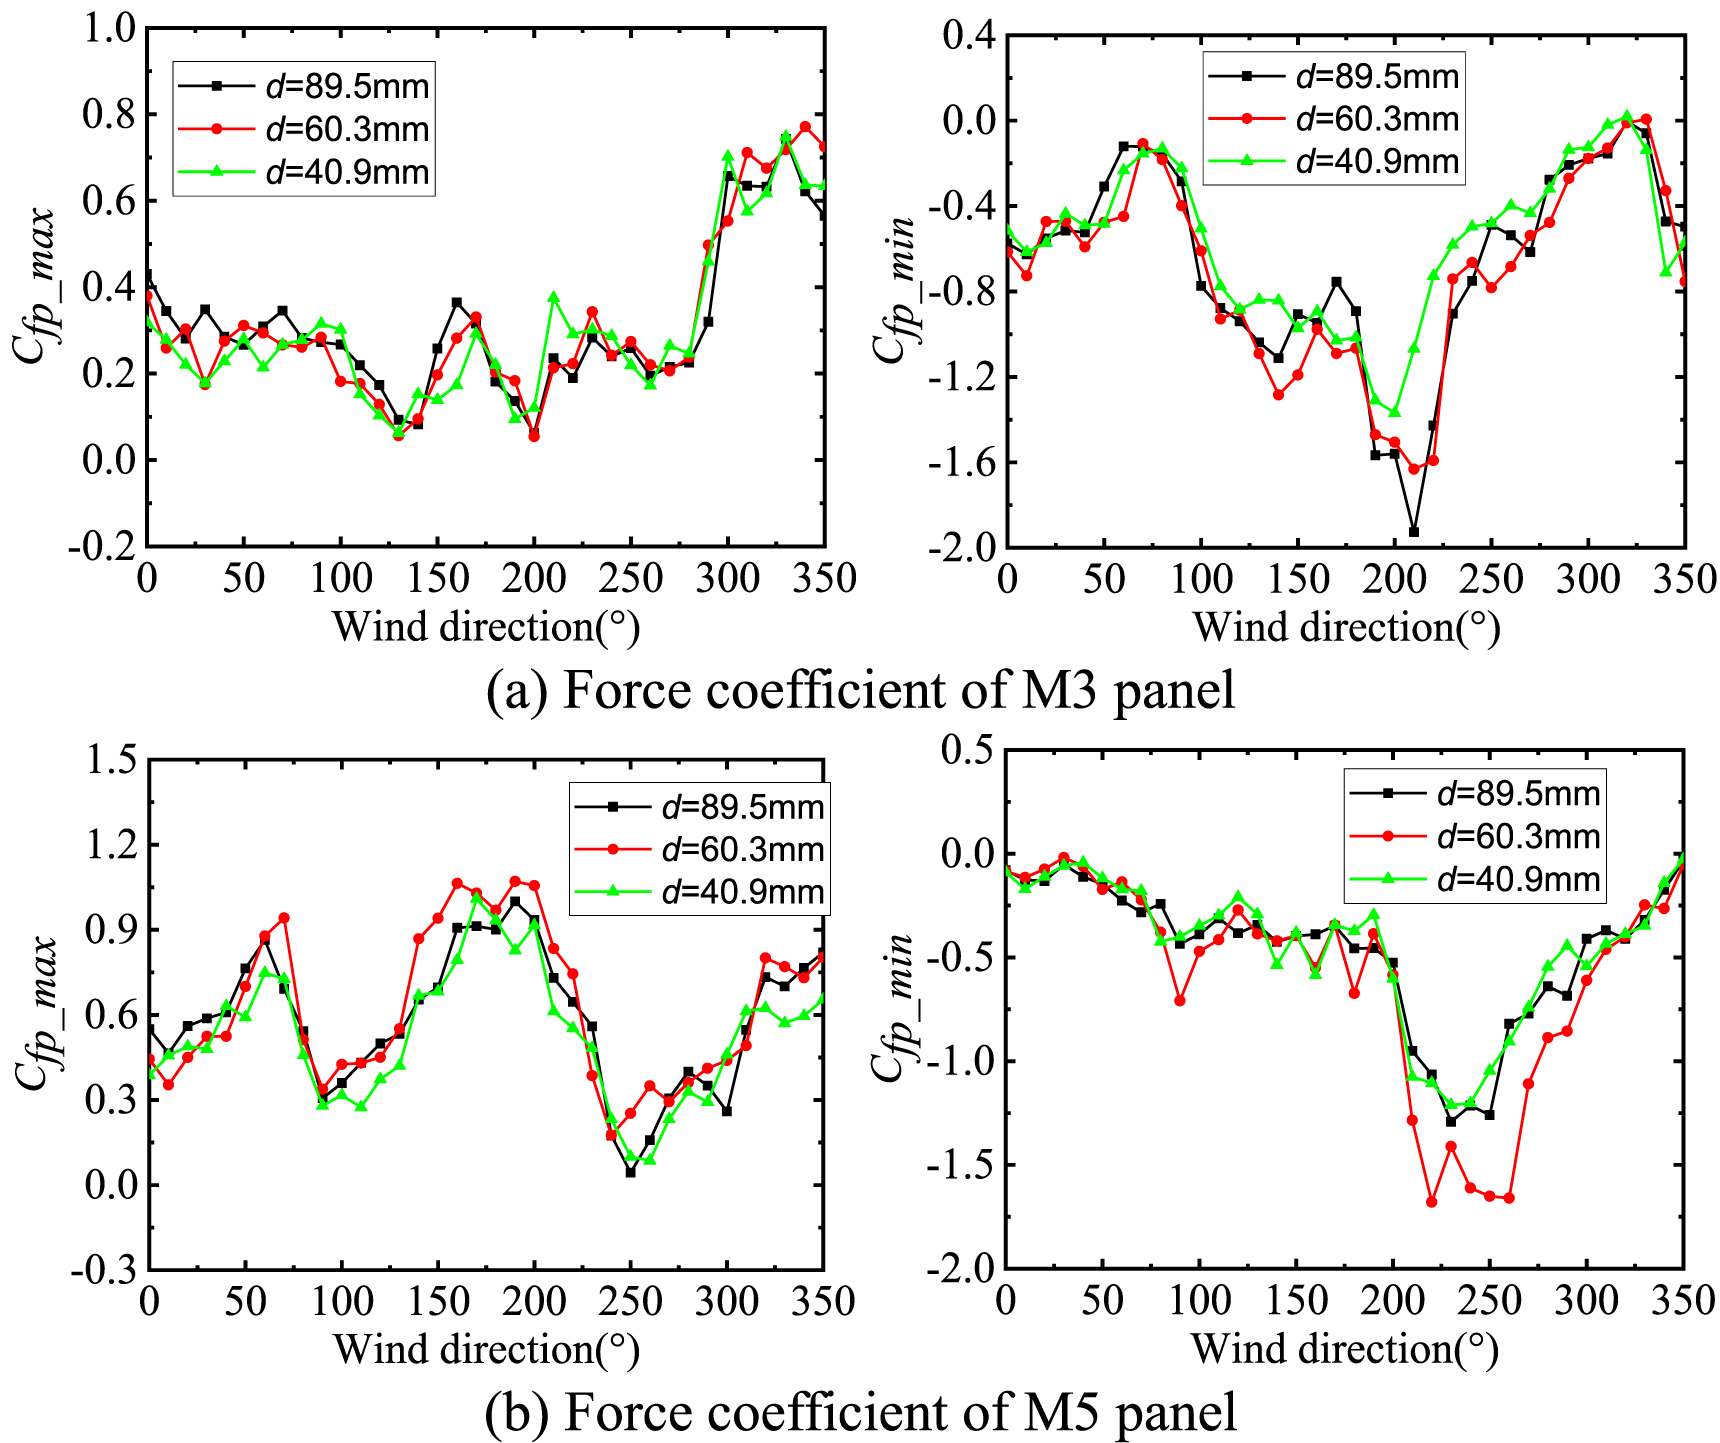
Three Cases are selected to study the effect of array spacing on force coefficients for panel units with different array spacing under the tilt angle 20°. Figure 7 shows Cfp_max, and Cfp_min of the M3 and M5 changing with wind direction. It can be seen that Cfp_max of panel units shows quite weak dependence on the array spacing. However, Cfp_min of panels with different spacing show relative larger discrepancies. The largest value of M3 in Case with largest array spacing (d=89.5 mm) is almost −2.0, and the largest value of M3 in Case with smallest array spacing (d=40.9 mm) is about −1.3. Such results suggest that array spacing is not a critical parameter for the positive peak force coefficients, but it plays an important role for the negative peak force coefficients. Cfp_max varies in the range of 0.3 ̃ 0.8, and most unfavorable maximum force coefficient of M3 appears in wind direction range of 300 ̃ 350°, while most unfavorable maximum force coefficient of M5 appears in wind direction range of 150°~200°. Cfp_min varies in the range of 0~−1.90, most unfavorable minimum force coefficient of M3 appears in wind direction range of 200°~220°, while most unfavorable minimum force coefficient of M5 appears in wind direction range of 220°~260°. The above results indicate that when the target panel unit is located near the leading edge of incident wind, they tend to be more vulnerable for wind load.

Figure 7. Force coefficient of M3 and M5 panels varies with wind direction for different array spacing.
Download figure:
Standard image High-resolution imageFigure 8 shows the variation of Cfp_max, Cfp_min of M3, M5 changing with array spacing. Cfp_max of panel units M3 and M5 are basically unchanged with the decrease of array spacing. Such results suggest that the maximum force coefficient of the panel is not sensitive to the array spacing. There is the same tilt angle lead to same pressure equalization is responsible for this phenomenon.
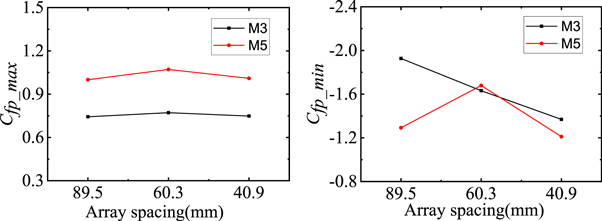
Figure 8. Most unfavorable force coefficients for different array spacing.
Download figure:
Standard image High-resolution imageThe absolute value of Cfp_min on M5 panel unit first increases and then decreases with the decrease of array spacing, while absolute value of Cfp_min on M3 panel decreases with the decrease of array spacing. Generally, largest lift force of panel unit M3 in the first row is larger than that of M5 in the last row. This is because when wind attacks from the back of panel, M5 is basically located inside the separation bubble, while M3 suffers the reattaching flow which has a greater wind speed and turbulence leading to higher lift force. The aerodynamics of this are similar to flow over repeated hills (or dunes), which depend on the hill slope and the spacing between hills (since it takes some time, i.e., distance, for the turbulence in the separated shear layers and reattached boundary layers to come into equilibrium). Here, the spacing is relatively short, so the turbulence continues to increase over many rows, middle located M3 unit got greater wind speed and greater turbulence. The aerodynamics of these lead to the unfavorable Cfp_min of M3.
4.2. Panel tilt angle
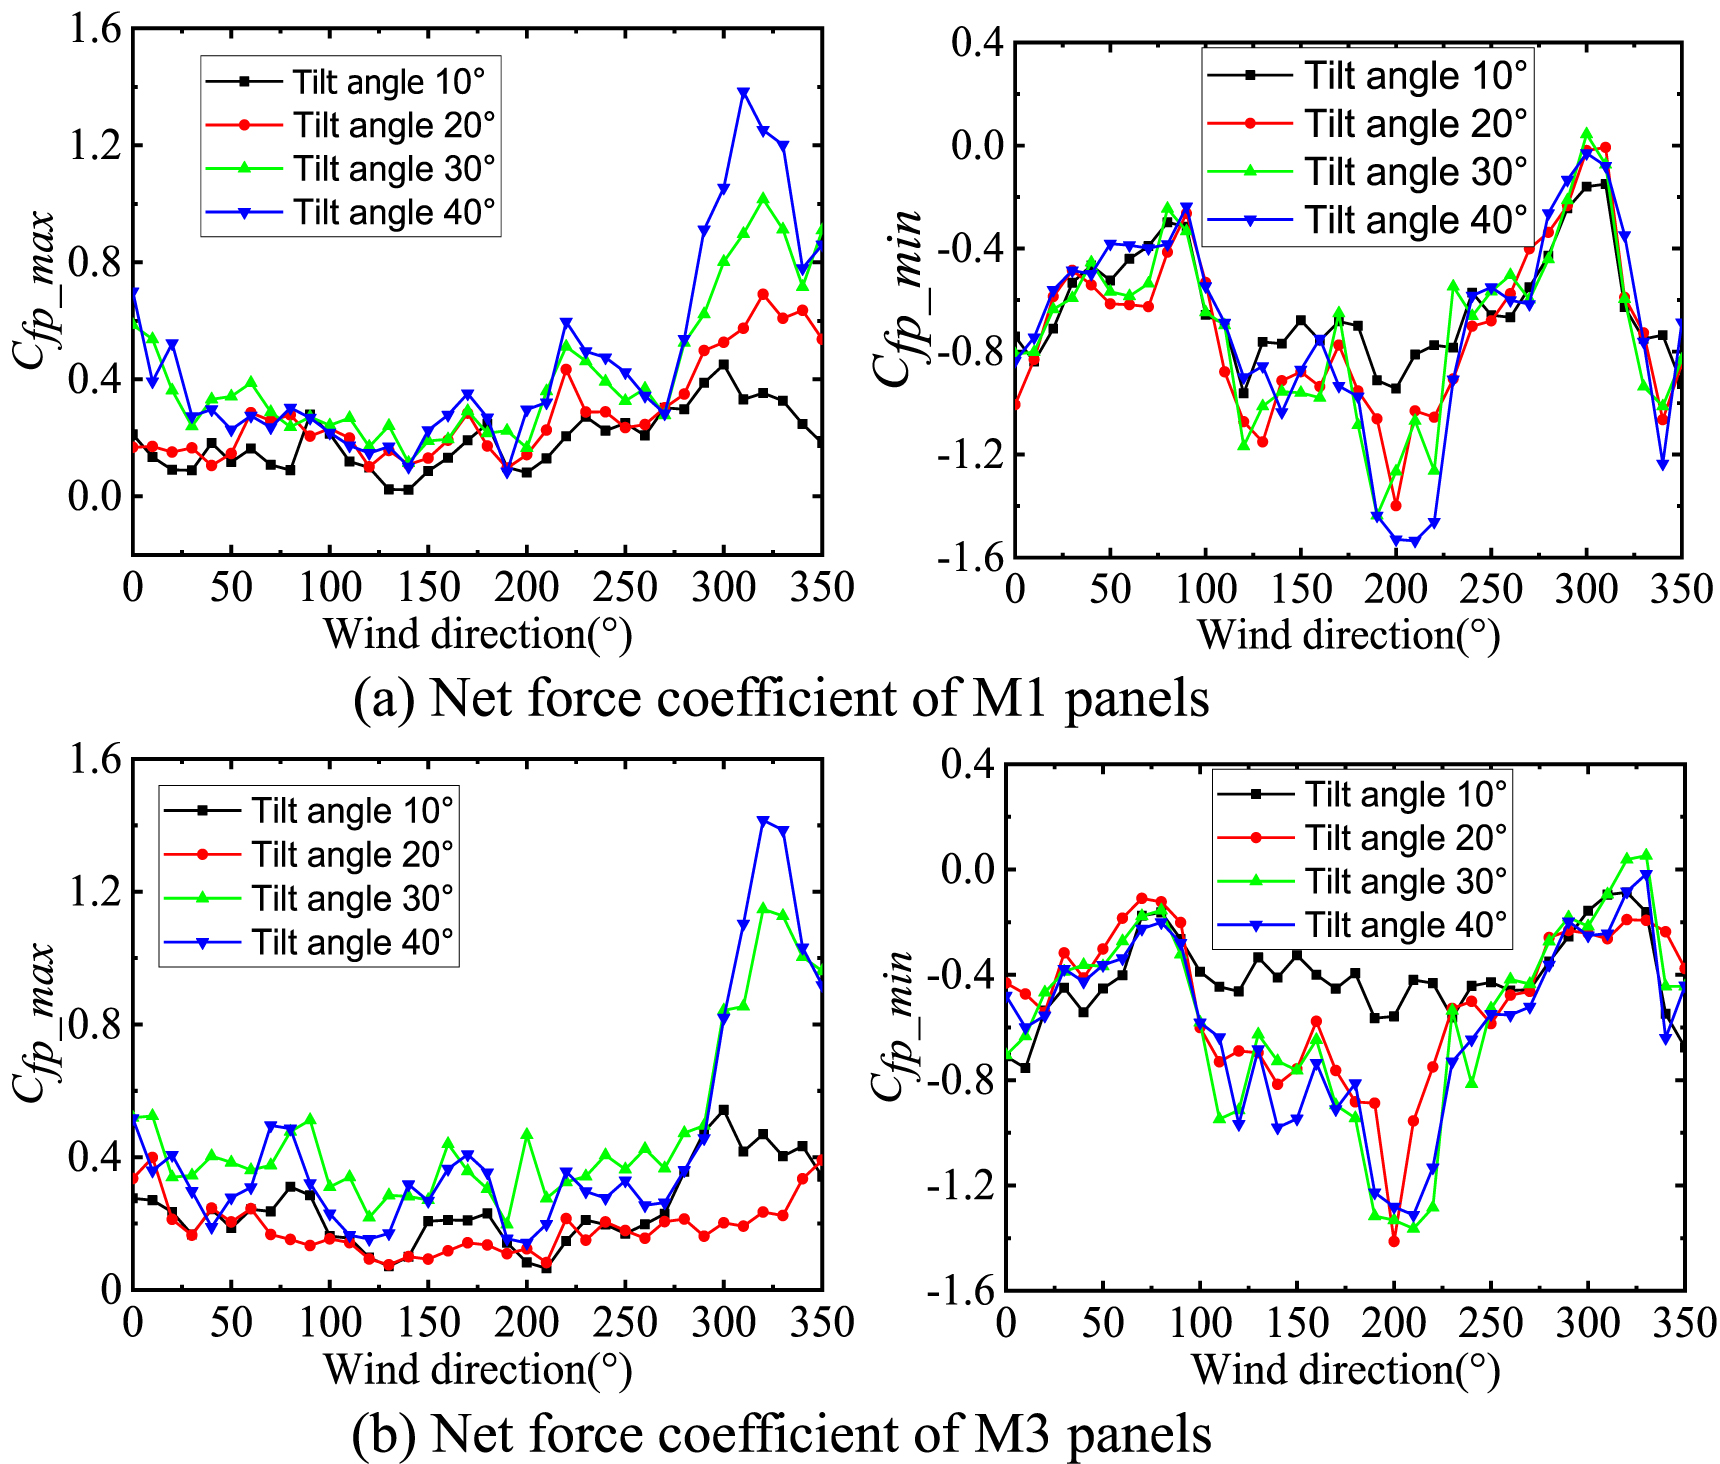
Tilt angles of 10°, 20°, 30° and 40° are selected to study effects on force coefficients of panel units. Figure 9 shows the Cfp_max, and Cfp_min of typical panel units M1 and M3 changing with wind direction. It can be seen from figure 9 that Cfp_max and Cfp_min of panel units shows quite strong dependence on tilt angle. Cfp_max varies in the range of 0.1 ̃ 1.4 for tilt case 40°. Most unfavorable Cfp_max for M1 and M3 appearing in the range of 300–330°. This may due to the increase of projected area with the increase of tilt angle. Cfp_min varies in the range of 0~−0.80 for tilt case 10°, most unfavorable minimum force coefficients of M1 and M3 appear about 0° wind angle. For the smaller tilt angle, the weakened flow separation leads to these lower wind loads. These results indicate that pressure equalization can also be induced for small tilt angle cases. Cfp_min varies in the range of 0~−1.60 for tilt case 20°~40°, most unfavorable minimum force coefficients of M1 and M3 appear in the range of 190°~220°. These results indicate that there is significant local flow separation for higher tilt angle cases.

Figure 9. Net force coefficient of M1 and M3 panels for different tilt angle.
Download figure:
Standard image High-resolution imageFigure 10 shows the most unfavorable Cfp_max, Cfp_min of panel units M1, M3 varying with tilt angle. The trends of force coefficients for the two panels follow the same pattern for both minima and maxima. The larger the inclination angel of the panel unit, the larger Cfp_max it may endure.

Figure 10. Most unfavorable wind pressure coefficient.
Download figure:
Standard image High-resolution imageFor minimum force coefficient Cfp_min, the extreme suction of panel M1 and M3 for 10 to 20° tilt angle changes greatly. In the tilt range of 20°~40°, Cfp_min almost keeps constant for both M1 and M3. These results indicate that for tilt angle greater than 20° the dependence of extreme lift force on the tilt angle of panel becomes quite weak.
4.3. Parapet height
Parapet wall of 1 h, 1.4 h, 2 h and 2.7 h (h is defined in figure 1) were set on the flat roof model of PV panel tilt angle 20° case. Figure 11 shows Cfp_max and Cfp_min of panels M3 and M5 changing with wind direction angle under different parapet heights.

Figure 11. Force coefficient of M3 and M5 panels for different parapet height.
Download figure:
Standard image High-resolution imageIt can be seen that Cfp_max and Cfp_min of panel units show quite strong dependence on the parapet height. The largest Cfp_max of M5 for Case without parapet is almost 1.2, and it reduces to 0.8 for the cases with parapet. The minimum Cfp_min of M5 for Case without parapet is almost −2.0, and reduces to −0.8 for the cases with parapet. Such results suggest that parapet height is a critical parameter for both suction and pressing force.
Cfp_max of M3 for with parapet cases varies in the range of 0.1 ̃ 0.8, and most unfavorable maximum force coefficient appears in wind direction about 90°, while most unfavorable maximum force coefficient of M5 appears in wind direction about 250°. Cfp_min of M3 varies in the range of 0~−1.60, most unfavorable minimum force coefficient appears in wind direction about 110° for higher parapet cases, while most unfavorable minimum force coefficient of M5 appears in wind direction about 250° for lower parapet cases. The above results indicate that the parapet has more significant effects on wind loads for the end row panel than the middle row panel.
Figure 12 shows the most unfavorable Cfp_max, Cfp_min of panel units M3, M5 changing with parapet height. Cfp_max of the M3 and M5 decrease with the increase of parapet height. The changing amplitude of Cfp_max for M5 is larger than M3, which means that Cfp_max of the M5 unit is more sensitive to parapet height; Cfp_max of most unfavorable panel has a small change within the range parapet height of 2 h to 2.7 h. Such results suggest that parapet height of 2 h is the critical height for Cfp_max.. Absolute value of Cfp_min on M3 and M5 decreases with the increase of parapet height within the range of 0 h~2 h. The changing amplitude of Cfp_max for M5 is greater than M3, which means that Cfp_min of M5 is more sensitive to parapet height. Cfp_min decreases with the increase of parapet height within the range of 0 h~2 h, and Cfp_min of parapet height of 2.7 h is slightly greater than that of 2 h. Such results suggest that Cfp_max and Cfp_min can be significantly reduced by settling a parapet with height 2 h.
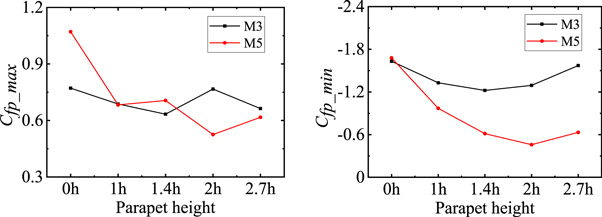
Figure 12. Most unfavorable maximum and minimum force coefficient of the panel for all wind directions.
Download figure:
Standard image High-resolution image5. Code and standard provisions
5.1. Design force coefficient for zoned panel units
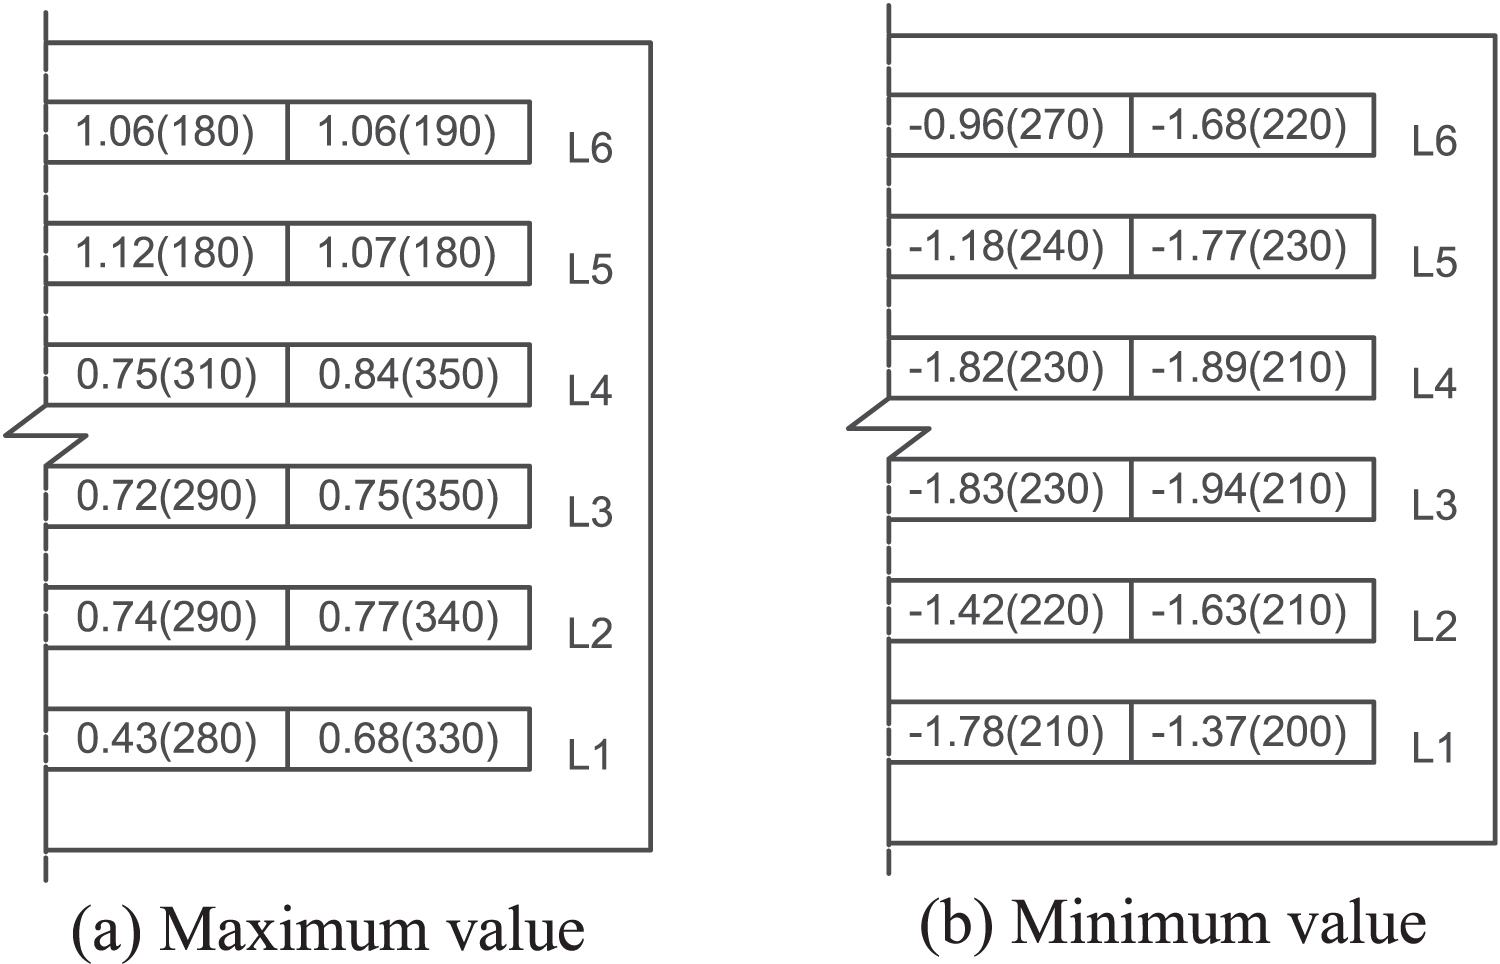
The position of panel unit has a significant influence on wind load characteristics. Figure 13 shows the most unfavorable peak force coefficients for panels about 6 m2 under typical test case with tilt angle of 20° at different
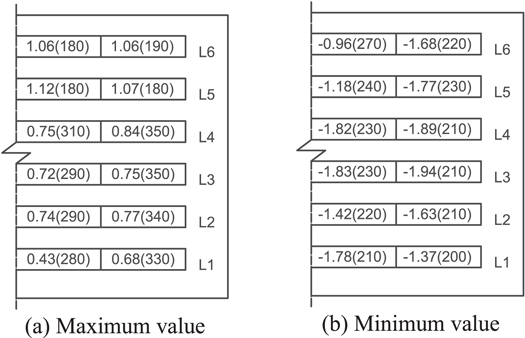
Figure 13. Most unfavorable peak module wind pressure coefficient and its corresponding wind direction.
Download figure:
Standard image High-resolution imagelocations, as well as the wind direction that lead to these values. It can be seen from figure 13 that worst Cfp_max generally appears on the rear L5 and L6 row of the roof, and the unfavorable wind direction is the direction of incoming flow impinging on the upper surface. These results indicate that there is pressure equalization for rear row panels.
The largest Cfp_min of the panels mostly occurs at the oblique wind direction of 200°−240°. When the roof corner is facing wind flow, the conical vortex is generated at the building edge will increase wind suction of panels. These results indicate that the conical vortex is the mechanism for worst Cfp_min of the panels.
5.2. Design force coefficient of panel units for different areas
Different manufacturers may use different bracket systems, and number of panels supported by the bracket system is different. Thus, design force coefficients of different areas and sizes need to be given to facilitate the design of bracket system. In this section, force coefficient is specially studied for case with tilt angle 20° and array spacing 60.3 mm with full-scale area size of 0.75m2, 1.5m2, 3m2, 6m2, and 12m2. Most unfavorable force coefficients for panel units with different area size in each row are shown in figure 14, where D is the distance from the front edge of the roof.
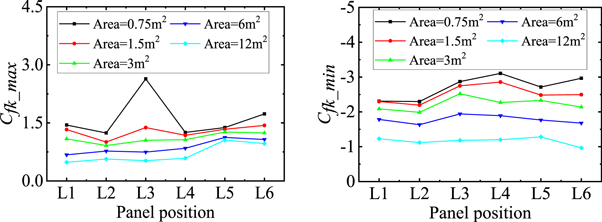
Figure 14. Most unfavorable force coefficient for different sizes for all wind directions.
Download figure:
Standard image High-resolution imageIt can be seen from figure 14 that force coefficient decreases significantly as area increases. For most unfavorable positive maximum force coefficient of panels, the difference for different rows is small, and the most unfavorable position appears in L6, because wind impinges on the lower surface. For small area size panel, most unfavorable negative minimum force coefficient of each row differs significantly, but when the area size is larger than 3m2, most unfavorable negative minimum force coefficients of different row are almost equal. It is indicated that extreme force coefficients for different location can be replaced by one uniform value with considering different area size.
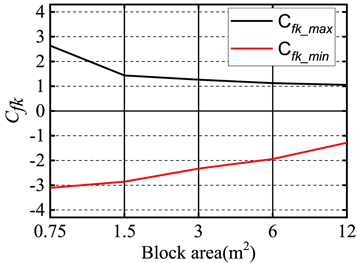
Figure 15 shows design recommended value of most unfavorable positive maximum force coefficient Cfk_max and negative minimum force coefficient Cfk_min for panel units of different area size. These values are referenced to the dynamic velocity pressure at the roof height based on the 10 min speed.
Figure 15. Most unfavorable net peak force coefficient for different block areas.
Download figure:
Standard image High-resolution image
6. Conclusion
The current study examined the wind load characteristics of solar photovoltaic panel arrays mounted on flat roof, and studied the effects of array spacing, tilt angle, building parapet height, and area size on force coefficients of panels. It is shown that unfavorable wind load of solar photovoltaic panel mounted on flat roof tends to occur in the first two rows and the rear two rows of arrays, unfavorable wind direction of edge panel unit tends to occur in the oblique wind direction, and unfavorable wind direction of the middle panel unit tends to occur under 0° or 180° wind directions. And the most unfavorable negative extreme wind pressure of the panel decreases with increase of array spacing for panel located in the middle of array. The aerodynamics of this are similar to flow over repeated hills (or dunes). Middle located M3 unit got greater wind speed and greater turbulence, which leading to the unfavorable Cfp_min. While most unfavorable positive extreme pressure has weak dependence on the array spacing. The tilt angle is mainly responsible for pressure equalization phenomenon. ·Cfp_max and Cfp_min of panel units shows quite stronger dependence on the tilt angle. The results indicate that the lift force becomes greater with increase of panel inclination angle, and greater overpressure occurs for larger panel inclination. For the case of tilt angle 10°, most unfavorable suction and overpressure of panel array is significant smaller than that of case of tilt angle 20°−40°. There is significant pressure equalization for small tilt angle cases. The significant local flow separation is responsible for higher tilt angle cases. As for the effect of the parapet heigh, results suggest that parapet height of 2 h is the critical height for Cfp_max and Cfp_min. Increasing parapet height can significantly reduce extreme lift and overpressure force of the panel unit, but decreasing amplitude is not proportional to parapet height. At last, the recommended values of design force coefficients in the basic working condition with different area sizes at different locations are given. And a uniform force coefficient with different area size is proposed for design of rackets.
Acknowledgments
The authors would like to gratefully acknowledge the supports from the National Science Foundation of China (Project No. 51508184). The work presented in this paper was also supported by grants received from Scientific Research Fund of Hunan Provincial Education Department (17K034) and Science Foundation of Hunan Province (Project No.2021JJ50120).
Data availability statement
All data that support the findings of this study are included within the article (and any supplementary files).