
Abstract
Chromium manganese austenitic stainless steel is exhibiting an admirable amalgamation of higher strength and stress corrosion resistance. This economical steel is developed to fulfill the requirement of a variety of consumers for high temperature and structural applications. Hitherto, the limitation associate with the TIG welding process is a low depth of penetration which reduces productivity. Activated tungsten inert gas welding (ATIG) is the best suitable option to overcome this problem and satisfy the sustainable welding requirement. Welding procedure has been developed for chromium manganese austenitic stainless steel during ATIG welding using a box behken design (BBD) to improve penetration depth and productivity. The activated flux using SiO2 and TiO2 flux indicates improvement in penetration 5.3 mm and 5.1 mm as compared to TIG welding. The ATIG welded test coupon has strength and hardness of 495 MPa and 195 HV when using SiO2 flux, and 487 MPa and 190 HV when using TiO2 flux, compared to 435 MPa and 165 HV for the TIG welded test coupon. ATIG welds have higher strength and hardness because of their finer grain size when compared to TIG welded test coupons.
Export citation and abstract BibTeX RIS
1. Introduction
Chromium manganese austenitic stainless steel is an economical version of austenitic stainless steel while endowing it with good strength and high formability making it highly suitable for a wide variety of consumer and structural applications [1]. This steel is also used in elevated temperature application boilers, feedwater heaters, and main steam lines [2]. This alloy exhibits excellent weldability when join by all conventional welding processes. Tungsten inert gas (TIG) welding is the most suitable process to get the desired weld bead and properties with aesthetic bead appearance [3]. The depth of penetration achieved during single pass TIG welding process is limited to 2–3 mm which reduced the productivity also if the plate thickness is more than 5 mm then edge preparation and filler materials are required [4]. Activated tungsten inert gas welding (ATIG) welding is the most suitable option for enhanced weld penetration capability and improves productivity to make the process more sustainable to overcome this limitation [5–7]. In this process penetration enhancing paste (PEP) is made with a mixture of oxide, halide, or sulfide with acetone, methanol, or ethanol and applied like paint on the surface to be joint prior to TIG welding as shown in figure 1. Due to ATIG process penetration enhanced up to 300% without filler metal consumption [8].

Figure 1. Schematic diagram of production of PEP paste and method of applying.
Download figure:
Standard image High-resolution imageThis process dramatically increases the depth of penetration of up to 300%. Reverse marangoni and arc constriction are the main responsible penetration enhancing mechanisms for this process [9–11]. In normal TIG welding, surface tension is higher at the edge and lower at the center but after applying penetration enhancing paste surface tension gradient will be reversed as shown in figure 2, This effect is known as the reverse marangoni effect and due to this molten metal flow from low surface tension to high surface tension like edge to center and improve the penetration [12]. The other mechanism is arc constriction, flux acts as an anode spot and it attracts the electrons. These electrons imping at the joint at a higher velocity, enhancing penetration [13, 14]. Also, the current density (Ampere mm−2) at the outer of the arc column is reduced due to the insulating effect of flux so current density at the center of the arc column increased, the magnetic force will be higher and it leads to strong molten metal downward flow which improves the penetration [15].

Figure 2. Surface tension gradient of molten metal during (a) TIG (b) ATIG process.
Download figure:
Standard image High-resolution imageKuang-Hung Tseng et al [16] was performed a bead on plate experiment on austenitic stainless steels with and without SiO2 flux by 2.4 and 3.2 mm diameters of a 2% thoriated tungsten electrode with a mechanized torch and they found smaller diameter tip is melted with flux but there is no wear on the tip without flux. Hung et al [17] investigate the effect of different oxide fluxes and found a mixture of MnO2 and ZnO gives full penetration up to 6 mm thickness. Also, δ ferrite content in the weld zone increased due to an increase in arc voltage which reduced hot cracking susceptibility [18]. They also observed the plasma arc column and anode spot play important roles in producing narrow beads and deeper penetration during the ATIG process [19]. Vasudevan [20] developed a multi component flux for 304 L and 316 L and increased penetration 10–12 mm in a single pass ATIG process. He also concludes that this increased in the depth of penetration due to arc concentration and reverse marangoni effect. The transverse strength of the weld zone increased and its impact value also improved due to grain refinement. Li et al [21] found that not only arc voltage significantly increased with SiO2 flux than TiO2 but also arc deflection is more with SiO2 flux. Adding nitrogen in argon shielding also increased the depth of penetration [22].
Researchers mainly focus on improving weld penetration using different fluxes during ATIG welding but a change in weld bead width is not much attended [23]. Not only flux but other welding variables are also important to get desired weld bead and mechanical and metallurgical properties Heat affected zone is increased with higher weld bead width which is not desirable [24, 25]. Also, weld penetration depth to weld bead width (D/W) ratio influences the solidification cracking [26]. Therefore, it's important to analyze weld penetration and weld bead width, and optimized process parameter during the ATIG process. Selection of optimized process parameters and suitable flux plays a major role to get high quality weld with enhanced penetration [27]. Optimization of the process parameter is done using the trial and error method of experiment or mathematical model [24]. The trial and error method required many experiments and was also time consuming. The other method is to optimized parameters using mathematical models [28].
Among the existing RSM designs, the Box Behken Design (BBD) is a rotatable second-order design based on three-level incomplete factorial designs. BBD requires fewer experimental runs and allows for the finding of the response function at intermediate levels, and also the estimation of system performance at any experimental point within the range studied through careful experiment design and analysis [29]. This design is intended to minimise the number of tests required to determine the potential interactions between the input process parameters and their impact on the responses [30, 31]. This design is less expensive to operate than CCDs with the same number of factors. The BBD is an excellent design for response surface methodology, as comparisons with other response surface designs (CCD, small composite design, three-level full factorial design) revealed that the BBD is slightly more efficient than the CCD but significantly more efficient than the three-level full factorial designs [32, 33].
This work aims to develop a welding procedure for chromium manganese austenitic stainless steel for the ATIG welding process using box behken design and derive the model for bead geometry in terms of welding variables. Also, analyze the effect of welding variables on the bead geometry. In addition, investigate the impact of flux on the geometry, mechanical, and metallurgical properties of weld joints.
2. Experimental procedure
In this experimental work, The Chromium manganese austenitic stainless steel of 5 mm thick welded using the ATIG welding process using systematics methodology and optimized the parameters. The chemical composition and mechanical properties of Chromium manganese austenitic stainless steel are summarized in table 1.
Table 1. Chemical Composition (weight %) and mechanical properties of chromium manganese austenitic stainless steel.
| C | Mn | Cr | Ni | Si | Cu | N | S | P | Hardness | Tensile |
|---|---|---|---|---|---|---|---|---|---|---|
| 0.1 | 10 | 16 | 2.0 | 0.75 | 2.0 | 0.2 | 0.01 | 0.06 | 158 HV | 410 MPa |
2.1. Optimized process parameters
In this study, bead on plate welding is performed on a chromium manganese austenitic stainless steel plate of 160 mm length, 80 mm width, and 5 mm thickness using TIG welding and Argon gas. The Box behnken experimental design is used to optimize and validate process parameters that affect bead geometry. As critical variables, the significant input process parameters such as current, welding speed, and gas flow rate were chosen and designated as ×1, ×2, and ×3, respectively. Table 2 shows the low, middle, and high levels of each variable as–1,0 and +1, respectively. Table 3 contains the details of the experimental plan. The output response of set of trails is shown in figure 3, measured and analyzed in terms of as depth of penetration, weld bead width, and depth to width ratio.
Table 2. Welding parameters and their levels.
| Level | −1 | 0 | +1 |
|---|---|---|---|
| Current (Ampere) | 140 | 170 | 200 |
| Welding Speed (mm min−1) | 160 | 190 | 220 |
| Gas Flow rate (lit min−1) | 8 | 10 | 12 |
Table 3. Experimental plan using box-behnken experimental design with coded and original values.
| Trial number | Current (Ampere) | Gas flow rate (lit min−1) | Welding speed (mm min−1) | |||
|---|---|---|---|---|---|---|
| Coded value | Original value | Coded value | Original value | Coded value | Original value | |
| 1 | −1 | 140 | 0 | 10 | 1 | 220 |
| 2 | 0 | 170 | 1 | 12 | 1 | 220 |
| 3 | 0 | 170 | 0 | 10 | 0 | 190 |
| 4 | 1 | 200 | −1 | 08 | 0 | 190 |
| 5 | 1 | 200 | 0 | 10 | −1 | 160 |
| 6 | 0 | 170 | −1 | 08 | 1 | 220 |
| 7 | 1 | 200 | 1 | 12 | 0 | 190 |
| 8 | 0 | 70 | −1 | 08 | −1 | 160 |
| 9 | 0 | 170 | 0 | 10 | 0 | 190 |
| 10 | 0 | 170 | 1 | 12 | −1 | 160 |
| 11 | −1 | 140 | −1 | 08 | 0 | 190 |
| 12 | 0 | 170 | 0 | 10 | 0 | 90 |
| 13 | 1 | 200 | 0 | 10 | 1 | 220 |
| 14 | −1 | 140 | 0 | 10 | −1 | 160 |
| 15 | −1 | 140 | 1 | 12 | 0 | 190 |
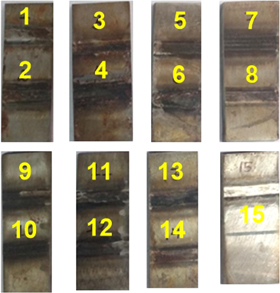
Figure 3. Bead on plate welding of Box-Behnken experimental design trails.
Download figure:
Standard image High-resolution image2.2. ATIG welding procedure
ATIG welding is carried out on chromium manganese austenitic stainless steel with SiO2 and TiO2 flux. For uniform coating thickness 0.15 mm during ATIG welding proper weight of flux taken as per calculation shown in table 4. This activated flux is combined with acetone in a 1:6 ratio to form penetrating enhancing paste (PEP), which is then applied to the surface to be joined prior to autogenous TIG welding. Figure 4 depicts the ATIG welding setup used for this experimental work.
Table 4. Weight calculation of flux.
| Flux | Appearance | Density (gm cm−3) | Length of the weld (mm) | Width of flux (mm) | Height of flux (mm) | Weight of flux (gm) |
|---|---|---|---|---|---|---|
| SiO2 | White/Whitish yellow | 2.19 | 160 | 10 | 0.15 | 0.527 |
| TiO2 | White solid | 4.23 | 160 | 10 | 0.15 | 1.015 |
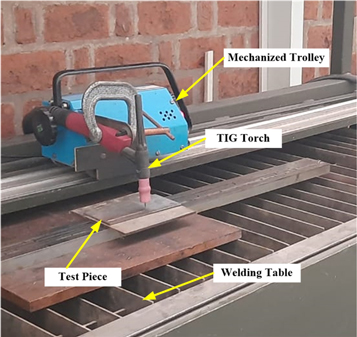
Figure 4. Setup of ATIG welding.
Download figure:
Standard image High-resolution imageVarious bead on plate trails performs based on BBD and welding parameters listed in table 2 and find out optimized parameters. Bead on plate welding on 80 × 160 × 5 mm plate perform by autogenously TIG machine with DCEN polarity and tungsten 2% thorium electrode and optimized BBD parameters listed in table 5 using with (SiO2 and TiO2) and without activated flux. Bead look of the TIG and ATIG using SiO2 and TiO2 flux shown in figure 5. Bead on plate welding plates is cut from the middle, ground, and polished. Table 5 shows the results of a macroscopic examination and measurements of weld bead geometry in terms of depth of penetration and weld bead width. Also, microscopic examination of all specimens was performed after applying 5% nital etchant.
Table 5. Welding parameters and weld bead geometry for TIG and ATIG welding.
| Input parameters | Weld geometry | |||||
|---|---|---|---|---|---|---|
| Flux | Current (I), ampere | Welding speed (S), mm min−1 | Gas flow rate (GFL), lit min−1 | Weld penetration (P) mm | Bead width (W) mm | |
| TIG | — | 170 | 220 | 10 | 2.6 | 8.1 |
| ATIG | SiO2 | 170 | 220 | 10 | 5.3 | 6.2 |
| ATIG | TiO2 | 170 | 220 | 10 | 5.1 | 5.4 |
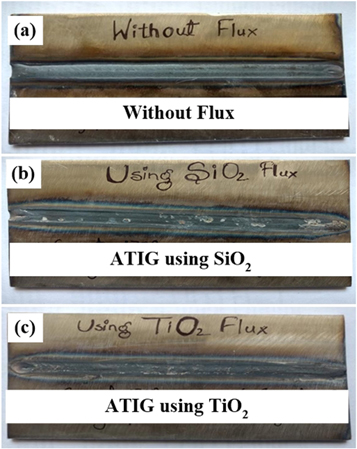
Figure 5. Bead appearance of (a) TIG (b) ATIG using SiO2 flux and (c) ATIG using TiO2 flux.
Download figure:
Standard image High-resolution image2.3. Mechanical testing
The ATIG process with SiO2 and TiO2 flux was used to achieve full penetration of a 5 mm thick plate of square butt geometry with zero mm root gap in a single pass using the optimized process parameters listed in table 5. Also, TIG welding of a similar joint is done on both sides of the plate to achieved full penetration. Tensile and hardness specimens for mechanical and metallurgical characterization are taken from the full butt weld pad as shown in figure 6. A 10 kg load was applied to the measured vicker hardness value at the weld portion of a full weld butt pad in accordance with ASTM E92 and tensile specimens were prepared in accordance with the ASTM E8.

Figure 6. Extraction of tensile and hardness specimen from full butt weld plate.
Download figure:
Standard image High-resolution image3. Result and discussion
3.1. Mathematical model
The values of weld bead morphology such as weld penetration (P) and bead width (W) are measured under 10X magnification and recorded and The results were further analyzed using Minitab software. The final model derived in terms of process variables for the welding variables is as follows:

The coefficient of determination (R2) and adjusted coefficient of determination (R2(Adj)) for P and W indicate that model is fit and showing a good correlation. The coefficient of determination (R2) for P and W are depicted in table 6.
Table 6. Coefficient of determination (R2) for P and W.
| Response | S | R2 | Adj R2 | Pred R2 |
|---|---|---|---|---|
| P | 0.0487 | 99.38% | 98.26% | 90.07% |
| W | 0.07107 | 99.32% | 98.09% | 89.06% |
The pred R2 values for all the response parameters were in reasonable agreement with the adj R2 values which indicate that the model predicts the new observations as close to the actual values obtained from experiments. The adequacy of the models generated can also be confirmed by the R2 values near unity. When these values approached unity, the models fit the experimental data better. The desirable values (near to unity) confirm the adequacy and robustness of the generated models. Hence, it can be concluded that aforesaid models are accurate and can be used as objective functions.
The process relationship between factors and responses was investigated using a surface to investigate the variation of the response surface with different factor combinations. The surface plots are shown in figures 7(a)–(d). As shown in figure 7(a), weld penetration (P) increases with increasing arc current and decreases with increasing weld speed (S). Weld penetration is primarily influenced by current and welding speed; however, as shown in figure 7(b), the gas flow rate has little effect on weld penetration. Similarly, bead width (W) is mainly affected by arc current and welding speed, it has very little influence from gas flow rate, as shown in figures 7(c) and (d)

Figure 7. Convergence plot for individual response parameters.
Download figure:
Standard image High-resolution image3.2. ANOVA analysis
Analysis of variance (ANOVA) is used to check the adequacy of the model. For the adequacy of a model, the P-value shall be lower than 0.05. Factors with P-values lower than 0.05 are considered during evaluating the output responses. The effect of ANOVA for predicting penetration, welding current is having a significant contribution of 99.38% while for S and GFL having the least significant. ANOVA for P and W is depicted in table 7.
Table 7. ANOVA table for penetration and bead width.
| Source | DF | Seq SS | Adj SS | Adj MS | F-Value | P-Value | Contribution |
|---|---|---|---|---|---|---|---|
| (a) ANOVA analysis for penetration | |||||||
| Model | 9 | 1.90246 | 1.90246 | 0.21138 | 89.00 | 0.000 | 99.38% |
| Linear | 3 | 1.84937 | 1.84938 | 0.61646 | 259.56 | 0.000 | 95.61% |
| I | 1 | 1.71125 | 1.71125 | 1.71125 | 720.53 | 0.000 | 89.39% |
| S | 1 | 0.13781 | 0.13781 | 0.13781 | 58.03 | 0.001 | 7.20% |
| GFL | 1 | 0.00031 | 0.00031 | 0.00031 | 0.13 | 0.732 | 0.02% |
| Square | 3 | 0.04496 | 0.04496 | 0.01499 | 6.31 | 0.037 | 2.35% |
| I*I | 1 | 0.03344 | 0.03345 | 0.03245 | 13.66 | 0.014 | 1.75% |
| S*S | 1 | 0.00791 | 0.00707 | 0.00707 | 2.98 | 0.145 | 0.41% |
| GFL*GFL | 1 | 0.00361 | 0.00361 | 0.00361 | 1.52 | 0.273 | 0.19% |
| 2-Way Interaction | 3 | 0.00812 | 0.00812 | 0.00271 | 1.14 | 0.418 | 0.42% |
| I*S | 1 | 0.00000 | 0.00000 | 0.00000 | 0.00 | 1.000 | 0.00% |
| I*GFL | 1 | 0.00250 | 0.00250 | 0.0025 | 1.05 | 0.352 | 0.13% |
| S*GFL | 1 | 0.00562 | 0.00562 | 0.00562 | 2.37 | 0.184 | 0.29% |
| Error | 5 | 0.01187 | 0.01187 | 0.00237 | 0.62% | ||
| Lack-of-Fit | 3 | 0.01187 | 0.01187 | 0.00396 | 0.62% | ||
| Pure Error | 2 | 0.00000 | 0.00000 | 0.00000 | 0.00% | ||
| Total | 14 | 1.91433 | 100.00% | ||||
| (b) ANOVA analysis for bead width | |||||||
| Model | 9 | 3.63233 | 3.63233 | 0.40359 | 80.72 | 0.000 | 99.32% |
| Linear | 3 | 3.45000 | 3.45000 | 1.14833 | 229.67 | 0.000 | 94.19% |
| I | 1 | 3.12500 | 3.12500 | 3.12500 | 625.00 | 0.000 | 85.44% |
| S | 1 | 0.32000 | 0.32000 | 0.32000 | 64.00 | 0.000 | 8.75% |
| GFL | 1 | 0.00000 | 0.00000 | 0.00000 | 0.00 | 1.000 | 0.00% |
| Square | 3 | 0.17733 | 0.17733 | 0.05911 | 11.82 | 0.010 | 4.85% |
| I*I | 1 | 0.16019 | 0.14769 | 0.14796 | 29.54 | 0.003 | 4.38% |
| S*S | 1 | 0.00791 | 0.00923 | 0.00923 | 1.85 | 0.232 | 0.22% |
| GFL*GFL | 1 | 0.00923 | 0.00923 | 0.00923 | 1.85 | 0.232 | 0.25% |
| 2-Way Interaction | 3 | 0.01000 | 0.01000 | 0.00333 | 0.67 | 0.608 | 0.27% |
| I*S | 1 | 0.00000 | 0.00000 | 0.00000 | 0.00 | 1.000 | 0.00% |
| I*GFL | 1 | 0.00000 | 0.00000 | 0.00000 | 0.00 | 1.000 | 0.00% |
| S*GFL | 1 | 0.01000 | 0.01000 | 0.01000 | 2.00 | 0.216 | 0.27% |
| Error | 5 | 0.02500 | 0.02500 | 0.00500 | 0.68% | ||
| Lack-of-Fit | 3 | 0.02500 | 0.02500 | 0.00833 | 0.68% | ||
| Pure Error | 2 | 0.00000 | 0.00000 | 0.00000 | 0.00% | ||
| Total | 14 | 3.65733 | 100.00% | ||||
3.3. Optimizing process parameters
In the current study, 15 sets of experiments are performed based on the box behnken experimental design to minimize the number of beads used in determining the optimum parameter. The heat input was calculated, and the width and depth of penetration of the weld beads were measured. Using Minitab software, the parameters were optimized in terms of minimized heat input and maximized depth to width ratio to reduce the risk of solidification cracking. Experiments were carried out at process parameters for optimized conditions to test the robustness and prediction accuracy of the algorithms, which are summarised in table 8. The percentage of error difference between the predicted and measured output response values was negligible which validates the results of the optimization process.
Table 8. Confirmation trials.
| Optimized parameter | Actual trail parameter | |
|---|---|---|
| Arc current | 170 Amp | 170 Amp |
| Welding speed | 220 mm min−1 | 220 mm min−1 |
| Gas flow rate | 10 l min−1 | 10 l min−1 |
3.4. Visual inspection and macroscopic examination
The normal TIG welding gives a very aesthetic look as shown in figure 5(a), after applying activated flux of SiO2 and TiO2 flux bead appearance is satisfactory but required to clean the residue of flux stick on the surface of the bead as shown in figures 5(b) and (C). weld bead geometry in terms of weld depth and weld bead width shown in figure 8 for TIG and ATIG welding. In normal TIG welding, weld depth is limited to 2.6 mm. after applying activated flux weld depth increased from 2.6 mm to 5.3 mm and 5.1 mm for SiO2 and TiO2 flux respectively for the same welding parameters. Also, weld bead width decreased from 8.1 mm to 6.2 mm and 5.2 mm during the use of SiO2 and TiO2 flux respectively. This enhanced in penetration due to arc constriction and reverse Marangoni effect in molten metal after oxide flux applied. Electronegativity is also an important factor for the oxides properties. SiO2 flux have more electronegativity than TiO2 flux [34], due to which oxides flux dissociation attract more electron in the outer region of the arc column compared to the center which lead to more depth of penetration for SiO2 than TiO2 flux during ATIG welding. Also, for the same arc length, arc voltages of 17 V and 15 V were observed during the ATIG welding process when SiO2 and TiO2 fluxes were used. This is greater than the arc voltage of 14V used in normal TIG welding. because of the high amount of heat generated during ATIG, which is also one of the factors contributing to the increased depth of penetration [21]. Furthermore, the arc voltage for SiO2 flux during ATIG welding is higher than for TiO2 flux, resulting in a greater depth of penetration with the use of SiO2 flux.
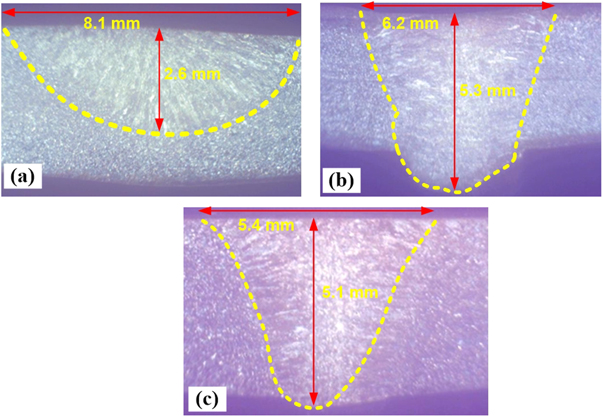
Figure 8. Weld bead macrograph of (a) TIG (b) ATIG using SiO2 flux and (c) ATIG using TiO2 flux.
Download figure:
Standard image High-resolution image3.5. Mechanical and metallographic properties of weld metal
The strength of the weld joint is determined using tensile strength and hardness distributed on the surface of the weld. Table 9 listed the tensile and hardness value in MPa and vicker hardness number (HV) respectively for the base metal, TIG, and ATIG weld joint. The tensile strength and hardness value of the ATIG weld zone are higher than the TIG weld zone and base metal.
Table 9. Mechanical properties of base metal, TIG, and ATIG weld metal.
| Base metal | TIG | ATIG- SiO2 | ATIG- TiO2 | |
|---|---|---|---|---|
| Hardness | 158 HV | 165 HV | 195 HV | 190 HV |
| Tensile strength | 410 MPa | 435 MPa | 495 MPa | 487 MPa |
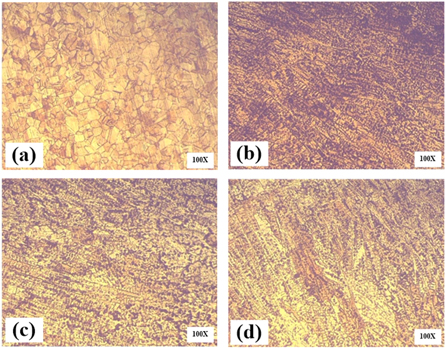
Microscopic examination is carried out in accordance with ASTM E340 after controlled surface etching of metals, as shown in figure 9. Table 10 summarizes the results of measuring the grain size of each micrograph with image analyzer software. The results show that the grain structure of the base metal is coarser than that of a TIG or ATIG weld bead. Furthermore, the ATIG weld zone of SiO2 and TiO2 has a finer grain size than the TIG weld zone. Because of the fine grain produced during ATIG welding, the tensile and hardness values of ATIG weld metal are higher than TIG welding.
Figure 9. Microscopic examination at 100 X (a) Base material (b) TIG weld (c) ATIG weld using SiO2 (d) ATIG weld TiO2.
Download figure:
Standard image High-resolution image
Table 10. Grain size measurement of base metal, TIG and ATIG weld metal.
| Grain | Avg. no. of intercept | Avg. dia (mm) | Avg. grain area (mm) | Grain no. |
|---|---|---|---|---|
| Base materials | 5.9509 | 0.0079 | 0.000063 | 11 |
| TIG | 3.2016 | 0.004 | 0.000016 | 13 |
| ATIG- SiO2 | 0.9889 | 0.0028 | 0.000008 | 14 |
| ATIG- TiO2 | 0.5816 | 0.0028 | 0.000008 | 14 |
4. Conclusions:
Chromium manganese austenitic stainless steel of 5 mm thickness successfully weld in a single pass with the help of ATIG welding process and optimized weld parameters using box behnken experimental design, to get desired and acceptable mechanical properties of weld metal.
- 1)Depth of penetration during ATIG welding significantly increased due to the reverse marangoni and arc constriction effect resulting in higher productivity and lower consumable cost.
- 2)The coefficient of determination (R2) for P and W is 99.38% and 99.32 which indicate that model is adequately fit and showing good correlation with input parameter and responses.
- 3)The effect of ANOVA for predicting penetration, welding current is having a significant contribution of 99.38% while for S and GFL having the least significant. The surface plot indicates that the penetration is primarily influenced by welding current and welding speed; however, the gas flow rate has little effect on weld penetration
- 4)The activated flux using SiO2 and TiO2 flux indicates improvement in penetration 5.3 mm and 5.1 mm as compared to TIG welding.
- 5)The ATIG welded test coupon has strength and hardness of 495 MPa and 195 HV when using SiO2 flux, and 487 MPa and 190 HV when using TiO2 flux, compared to 435 MPa and 165 HV for the TIG welded test coupon. ATIG welds have higher strength and hardness because of their finer grain size when compared to TIG welded test coupons.
Disclosure statement
No potential conflict of interest was reported by the authors.