
Abstract
Aluminum-based composites are known for better mechanical properties, superior corrosion performance, and light weight. Gradual increase in the reinforcement (SiC particles) produces improvement in several mechanical properties of Aluminum base alloy but adversely affects ductility. The present work depicts the end milling of the Al-4032/3%SiC composite. The investigation on the impact of end milling parameters has been attempted for rough and finish machining conditions. Two case studies (a) rough machining i.e., 100% weightage to material removal rate (MRR) (b) finish machining i.e., 80% weightage to surface roughness, and only 20% weightage to MRR have been investigated. Full factorial design with 3-factors at 3-level each has been used as the design matrix for conducting the milling experiments. Taguchi-based grey relational analysis (TGRA) has been adopted for the bi-objective optimization for finish machining. The significance of process parameters has been checked with analysis of variance (ANOVA).
Export citation and abstract BibTeX RIS
Notation
| ANOVA | Analysis of variance |
| CS | Cutting speed |
| D | Cutter diameter |
| DOC | Depth of cut |

| Table (machine) feed |

| Feed/tooth of the cutter |
| FR | Feed rate |
| GRC | Grey relational coefficient |
| GRG | Grey relational grade |
| L | Length of pass or cut |
| MMC | Metal matrix composite |
| MRR | Material removal rate |
| N | RPM of cutter |
| n | Number of teeth on the cutter |
| Ra | Average surface roughness |
| S/N ratio | Signal to noise ratio |
| t | Depth of cutter |
| TGRA | Taguchi grey relational analysis |
| V | Cutting speed |
| w | Width of cut |
Introduction
The metal matrix composites (MMCs) consist of a base metal like aluminum, magnesium, titanium, etc, and reinforcement like SiC, Al2O3, B4C, etc to obtain new materials with improved properties. Among all, aluminum-based MMCs have drawn vast attention in the aerospace and automobile business for their low cost, high dimensional stability, high stiffness, and light weight [1–4]. The Al-4032/SiC metal matrix composites have been carefully explored and analyzed owing to light weight and better mechanical properties. Generally, up to 15% SiC reinforcement has been explored in the MMC for industrial, aerospace, manufacturing, and structural applications. Though, most of the research has been in the range 2%–8% SiC. The choice of reinforcement fraction depends on the trade-off between the improvement of physical-mechanical properties and the reduction of ductility, for a given application.
As the Al-alloy-based MMC is becoming extensively popular in various industrial, aerospace, manufacturing, and structural applications. The process parameters for machining operations will have to be worked out for better machining performance. Also, the machining of the MMCs is very difficult due to their higher hardness values, posing a major challenge to industrial practitioners [5, 6]. Present study depicts the investigation on end milling of the Al-4032/3%SiC composite. The machining trials have been performed following full factorial design with 3-factors at 3-level each. The rough machining has been analyzed for only a single response parameter MRR (i.e., without any weightage to surface roughness) using ANOVA. For finish machining, the bi-objective optimization has been implemented, giving 20% weightage to MRR and 80% weightage to surface roughness, using TGRA.
A lot of work has been reported on the end milling of MMCs over decades. Khandey et al [6] examined the turning of MMC with 25% SiC to obtain the finest surface quality, low cutting force, and specific power consumption. The genetic algorithm (GA) merged with principal component analysis (PCA) and GRA is used to find the optimal solution. Polini et al [7] explored the dry turning of Al/10%Al2O3. It was noted that the finer the grain, the better would be the tool life. Muthukrishnan et al [8] examined the turning of Al-356/10%SiCp using Polycrystalline Diamond (PCD) inserts. At high CS, a better finish was noted with low power consumption. Built-up edge (BUE) formation was noted at low speeds. Suresh et al [9] studied the turning of hybrid LM 25/SiC/Gr composites. Al-10%(SiC−Gr) displays a better finish and MRR. Shoba et al [10] examined the turning of Al-356/6%SiC/6%RHA using the Taguchi L9 design matrix. Spindle speed 900 rpm, feed 0.25 mm/rev, and depth of cut 0.5 mm seem to be the best settings for surface finish.
Karabulut et al [11] examined the milling of Al-6061/B4C MMC with 5, 10, 15, and 20% B4C. The hardness of the MMC has been noticed to enhance with increase in B4C, the maximum hardness is observed at 20% B4C. But the impact resistance decreases with an increase in B4C %. The best surface finish appears corresponding to 15% B4C at high speed, small feed rate, and dry-cutting conditions. Kumaran et al [12] investigated drilling of stir cast Al-6351/SiC and Al-6351/B4C AMCs. The results show that both the thrust force and surface roughness decrease with the increase in spindle speed but raises the tool temperature. Likewise, the point angle around 90° lowers the thrust force but adversely changes other response parameters. Parashar and Purohit [13] studied the end milling of Al 206/Al2O3 (2, 4, 6%) with the help of the Taguchi method. As the % of Al2O3 increases, the hardness also increases, and the wear reduces. Composite with 2%–4% Al2O3 appears to be the best for the maximum MRR.
Das et al [14] investigated the Rz and Rt during dry turning of Al 7075/SiCp MMC. The MMC was prepared using 20% SiCp (by weight) having an average particle size of 30.65 μm through stir casting process. Results reveal that both Rz and Rt values decrease with rise in spindle speed. For Rz, the order of significance is FR, spindle speed, DOC. Whereas, for Rt, it is spindle speed, DOC, FR. Rana and Lata [15] investigated the drilling of Al 5052/10% MgO MMC fabricated using stir casting. The HAZ temperature drops with the rise in spindle speed and DOC. Under similar conditions, burr height was also spotted to be reducing.
Balasubramanian et al [16] presented a study on the turning of stir cast LM 6/SiC composites. SEM with EDX was employed for tool wear analysis. The adhesion of materials on the cutting tool in addition to abrasion wear of tool rake face has been the reason for poor surface quality. Bai et al [17] studied the ultrasonically assisted turning (UAT) of Al 2124/5%SiC. A minor rise in cutting temperature was observed together with a considerable drop of cutting forces. Rozhbiany and Jalal [18] studied the mechanical properties and machinability of Al-6063 based composite with 5% of straw ash (SA), nano fibrillated composite (NFC), mortar ash (MA), and met coke ash (MCA). The strength of the composite so obtained is much higher than the base alloy. It was observed that the NFC decreases roughness value considerably for all CS.
The literature review shows that the research is being carried out on turning, milling, and drilling of various Al-alloy-based composites. The pace of research has increased in the last decade. The artificial neural network (ANN), RSM and Taguchi methodology have been pretty popular for optimization. The GRA approach has also been employed in a few studies. The Al-alloy-reinforcement combinations, their composition to suit different engineering applications, and numerous machining options, still present several opportunities for research in machining to have a better insight.
The mechanical properties of MMC primarily depend on the reinforcement percentage and the fabrication process [19]. The increase in reinforcement percentage increases the porosity that results in poor wettability. This is owing to the density difference between the base alloy and reinforcement, agglomeration, air entrapment, and improper selection of casting parameters [20]. The major obstacle to the application of the MMCs is the brittleness of reinforcement particles [21]. In this study, the reinforcement percentage has been selected based on a pilot study for the fabrication of the composites. At higher percentage no more useful mechanical properties have been obtained. Also, for lower percentage, no significant improvement in the mechanical properties has been noticed. Based on the pilot study, 3% reinforcement has judiciously been selected for research.
The focus of the present work is on machining of Al-4032/3%SiC MMC for the rough and finish machining. An attempt has been made to investigate the influence of end milling parameters on the MRR and surface roughness. The bi-objective optimization has been attempted using TGRA assigning appropriate weightage to response parameters for finish machining. The results obtained are expected to be useful to the materials processing research community and industrial practitioners.
Materials and experiments
There are several experimental designs, such as full factorial design, Taguchi designs, box beckhen, fractional factorial design, etc. An experimental design has to be carefully planned to get the best results with limited experimentation. Design matrix based on full factorial design with 3-factors at 3-level each has been adopted for machining experiments. The analysis has been conducted for both rough and finish machining. For rough machining, response function showing the relationship between MRR, and the process parameters has been obtained. TGRA has been adopted for the bi-objective optimization for finish machining. Response function showing the relationship between grey relational grade (GRG) and the process parameters has been obtained. ANOVA has been used to obtain the significance of parameters. A systematic application of the TGRA based optimization has been presented in figure 1. The exhaustive details on the philosophy have been introduced by Roy [22]. Further, a few applications of the methodology in metal machining have been reported in research literature [23–30].

Figure 1. Block diagram of TGRA methodology. Reprinted from [28, 29], Copyright (2020), with permission from Elsevier.
Download figure:
Standard image High-resolution imageFabrication of MMC samples
The composites have been fabricated taking Al-4032 as the base alloy reinforced with 3% (by weight) SiC particles (37–54 μm). Chemical contents of the fabricated composites are—Pb 0.01, Zn 0.06, Mo 1.00, Mn 0.12, Si 12.75, Fe 0.46, Cu 1.06, along with Al-4032 the (balance, by weight%). The stir casting process meant for blending SiC particles into the molten base alloy has been applied for production of the MMC.
The ceramic particles are heated at 500 °C for 2 h. The molten Al-4032 alloy at temperature 800 °C is stirred with the stirrer for 15 min at 700 revolutions per minute. The Mg-powder, approximately 2% (weight fraction) of the base alloy is also blended to improve the wettability between the Al-4032 and SiC [31].
End milling experiments
End milling operation was conducted on CNC machine center, with specifications—spindle speed 6000 RPM, motor 3.7 kW, feed rate 5000 mm min−1, power supply 415 V, 50 Hz, 3-phase. Aluminum has been observed to cause a built-up edge on all tool-tips except the diamond-coated one [32]. Dry machining of the Aluminum-based composites creates an undesirable BUE on the surface of the composite sample [33–35]. Accordingly, PCD tools appear to be the safer option, but the cost associated with these tools is very high [36, 37]. Therefore, a commercially available carbide cutter (2 flutes, 10 mm Diameter, 0.8 mm nose radius, figure 2) has been used for machining the composite owing to less cost and durability.

Figure 2. Milling tool.
Download figure:
Standard image High-resolution imageMachining parameters are chosen from machining catalog/databases/handbooks, but the range offered is starting values and are not the optimal values. Also, these parameters are normally restricted to a particular machine tool/material/cutting tool. This fact reveals the need for Design of Experiments (DOE) techniques in process parameters optimization. Further, the range of parameters is easily decided by pilot experimentation, or the work reported in the literature on similar materials. Based on the trial (pilot) study, the parameter levels (cutting speed, feed rate, and depth of cut) have been selected for the end milling of the composites. At a higher level, no more useful results (surface roughness and MRR) have been achieved. And for the low level, no significant improvement has been noticed. The process parameters are—cutting speed (55, 110, 165 m min−1); feed rate (0.05, 0.16, 0.25 mm tooth−1); depth of cut (0.5, 1.2, 2.0 mm). The end milling operations were performed along the direction of width of the specimen. The design matrix for experimental trials (design of experiments) and corresponding results are summarized in table 1.
Table 1. Complete design layout and experimental results.
| Exp. no. | A: CS (m min−1) | B: FR (mm tooth−1) | C: DOC (mm) |
 (μm) (μm) | MRR (mm3 sec−1) |
|---|---|---|---|---|---|
| 01 | 55 | 0.05 | 0.5 | 1.80 | 29.16 |
| 02 | 55 | 0.05 | 1.2 | 1.41 | 70.00 |
| 03 | 55 | 0.05 | 2.0 | 1.68 | 116.66 |
| 04 | 55 | 0.16 | 0.5 | 2.54 | 93.33 |
| 05 | 55 | 0.16 | 1.2 | 2.75 | 224.00 |
| 06 | 55 | 0.16 | 2.0 | 2.62 | 373.33 |
| 07 | 55 | 0.25 | 0.5 | 3.49 | 145.83 |
| 08 | 55 | 0.25 | 1.2 | 3.97 | 350.00 |
| 09 | 55 | 0.25 | 2.0 | 3.78 | 583.33 |
| 10 | 110 | 0.05 | 0.5 | 1.21 | 58.33 |
| 11 | 110 | 0.05 | 1.2 | 1.18 | 140.00 |
| 12 | 110 | 0.05 | 2.0 | 1.43 | 233.33 |
| 13 | 110 | 0.16 | 0.5 | 2.38 | 186.66 |
| 14 | 110 | 0.16 | 1.2 | 2.73 | 448.00 |
| 15 | 110 | 0.16 | 2.0 | 2.08 | 746.66 |
| 16 | 110 | 0.25 | 0.5 | 3.49 | 291.66 |
| 17 | 110 | 0.25 | 1.2 | 3.14 | 700.00 |
| 18 | 110 | 0.25 | 2.0 | 3.26 | 1166.66 |
| 19 | 165 | 0.05 | 0.5 | 1.59 | 87.50 |
| 20 | 165 | 0.05 | 1.2 | 1.40 | 210.00 |
| 21 | 165 | 0.05 | 2.0 | 1.48 | 350.00 |
| 22 | 165 | 0.16 | 0.5 | 1.95 | 280.00 |
| 23 | 165 | 0.16 | 1.2 | 2.11 | 672.00 |
| 24 | 165 | 0.16 | 2.0 | 3.15 | 1120.00 |
| 25 | 165 | 0.25 | 0.5 | 3.25 | 437.50 |
| 26 | 165 | 0.25 | 1.2 | 3.21 | 1050.00 |
| 27 | 165 | 0.25 | 2.0 | 3.39 | 1750.00 |
Calculation of metal removal rate
The basic schematics for calculation of the MRR rate is shown in figure 3.
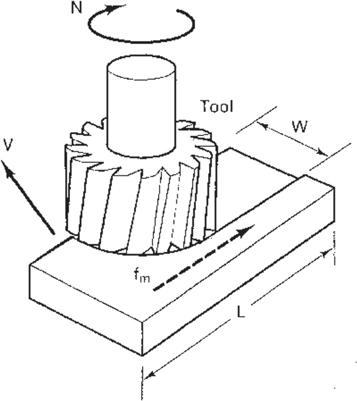
Figure 3. Schematic for calculation of material removal rate during end milling.
Download figure:
Standard image High-resolution imageTable feed, 
Measurement of surface roughness
The surface roughness/finish can be represented through many parameters, however, the arithmetic average value designated by 'Ra' is the most popular among the research community [38–42]. In this study, the Ra parameter has been evaluated using the Taylor Hobson tester (figure 4). For the stylus, 0.8 mm cutoff length was used in the surface texture meter. For each measurement, a total of three readings (one at central location and two at random locations) were recorded; and their average value has been calculated.
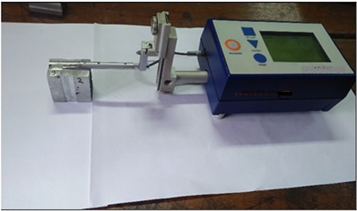
Figure 4. Surface roughness measurement.
Download figure:
Standard image High-resolution imageResult and discussion
The parameters like CS, FR, and DOC have been taken as process parameters. Two case studies (a) rough machining i.e., 100% weightage to MRR (b) finish machining i.e., 80% weightage to surface roughness and only 20% weightage to MRR have been investigated. Full factorial design with 3-factors at 3-level each has been used for conducting the milling experiments. TGRA has been implemented for the optimization during finish machining. Analysis of mean (ANOM) and ANOVA have been used for checking the significance of process parameters.
Based on results presented in table 1, it can be noted that at low CS, poor surface finish is achieved owing to discontinuous chip and BUE formation [8]. Also, it can be noticed that the surface roughness reduces with increased cutting speed which is a well-known fact. Whereas the feed rate increases the chip thickness, causing more cutting forces, and therefore increased surface roughness [43, 44]. The increase in depth of cut causes more abrasive contact between tool and workpiece thus producing enough heat production to generate BUE causing more surface roughness [8].
For rough machining, the surface finish does not play any significant role, and thus MRR has been considered the only response parameter. The production rate, denoted by the MRR, rises with a rise in the CS, FR, and DOC. Machining time reduces with an increase in the CS and FR. The average MRR for each level of the input parameter has been computed using the ANOM and shown in table 2. The order of significance of the controllable factors for maximization of MRR is FR, DOC, CS (i.e., 32.75 > 28.42 > 19.18). Table 2 and figure 5 represent the best possible combination 'A3 B3 C3' for MRR.
Table 2. Main effect for rough machining.
| Level | CS (A) (m min−1) | FR (B) (mm tooth−1) | DOC (C) (mm) |
|---|---|---|---|
| 1 | 220.6 | 143.9 | 178.9 |
| 2 | 441.3 | 460.4 | 429.3 |
| 3 | 661.9 | 719.4 | 715.6 |
| Max.—Min. | 441.3 | 575.6 | 536.7 |
| Rank | 3 | 1 | 2 |
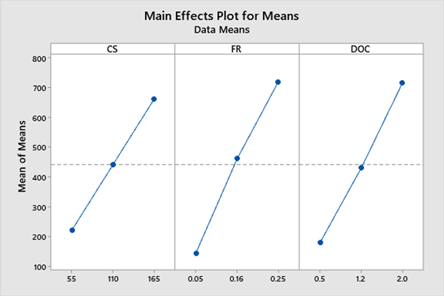
Figure 5. Main effects plot for rough machining.
Download figure:
Standard image High-resolution imageResponse function showing the relationship between process parameters and MRR, obtained through regression analysis using Minitab, is represented by equation (1).

Analysis of variance (ANOVA)
The principal objective of the ANOVA is the use of a statistical method to evaluate the impact of each factor. Results from ANOVA can clarify the impact of each factor on the response at a chosen confidence level of 90%. Table 3 shows the summarized results of ANOVA for rough machining. The table shows that all parameters are significant factors for the MRR. The % contribution of FR, DOC and CS are 32.75%, 28.42% and 19.18% respectively.
Table 3. Results of ANOVA for rough machining.
| Factor | D.F | Sum of squares | Mean squares | F-ratio | % Contribution | F > F table |
|---|---|---|---|---|---|---|
| CS (A) | 2 | 0876206 | 438103 | 09.77 | 19.18% | significant |
| FR (B) | 2 | 1495658 | 747829 | 16.68 | 32.75% | significant |
| DOC (C) | 2 | 1297969 | 648985 | 14.48 | 28.42% | significant |
| Error | 2 | 0896419 | 044821 | 03.30% | ||
| Total | 8 | |||||
| F0.10 (2,2) | 9 |
The surface roughness/finish is given priority over the MRR during finish machining. In this case, the response parameters, viz surface roughness, and MRR are assumed to have weightage equal to 0.8 and 0.2 respectively.
S/N ratios and subsequent normalization
TGRA requires an S/N ratio to start the optimization process. Also, it is important to normalize the computed S/N values. Table 4 indicates the computed and normalized S/N ratio values, for surface roughness and MRR.
Table 4. S/N ratio for the responses.
| Ra | MRR | |||||
|---|---|---|---|---|---|---|
| Exp. no. | Value (mm) | S/N ratio | Normalized | Value (mm3 sec−1) | S/N ratio | Normalized |
| 01 | 1.80 | −5.105450102 | 0.651950010 | 29.16 | 29.29575039 | 0.000000000 |
| 02 | 1.41 | −2.984382253 | 0.853224791 | 70.00 | 36.90196080 | 0.213867795 |
| 03 | 1.68 | −4.506185635 | 0.708816095 | 116.66 | 41.33843944 | 0.338610585 |
| 04 | 2.54 | −8.096674332 | 0.368103362 | 93.33 | 39.40042532 | 0.284118429 |
| 05 | 2.75 | −8.786653877 | 0.302629039 | 224.00 | 47.00496037 | 0.497939117 |
| 06 | 2.62 | −8.366025826 | 0.342543754 | 373.33 | 51.44185781 | 0.622693683 |
| 07 | 3.49 | −10.85650854 | 0.106214039 | 145.83 | 43.27693752 | 0.393116349 |
| 08 | 3.97 | −11.97581014 | 0.000000000 | 350.00 | 50.88136089 | 0.606933898 |
| 09 | 3.78 | −11.54983600 | 0.040422022 | 583.33 | 55.31828625 | 0.731689248 |
| 10 | 1.21 | −1.655707406 | 0.979306914 | 58.33 | 35.31783953 | 0.169326229 |
| 11 | 1.18 | −1.437640146 | 1.000000000 | 140.00 | 42.92256071 | 0.383152151 |
| 12 | 1.43 | −3.106720749 | 0.841615707 | 233.33 | 47.35941162 | 0.507905409 |
| 13 | 2.38 | −7.531539141 | 0.421730813 | 186.66 | 45.42102523 | 0.453402785 |
| 14 | 2.73 | −8.723252941 | 0.308645353 | 448.00 | 53.02556028 | 0.667223473 |
| 15 | 2.08 | −6.361266699 | 0.532781635 | 746.66 | 57.46245772 | 0.791978039 |
| 16 | 3.49 | −10.85650854 | 0.106214039 | 291.66 | 49.29753743 | 0.562400705 |
| 17 | 3.14 | −9.938592961 | 0.193317927 | 700.00 | 56.90196080 | 0.776218254 |
| 18 | 3.26 | −10.26435200 | 0.162405630 | 1166.66 | 61.33888616 | 0.900973604 |
| 19 | 1.59 | −4.027942486 | 0.754198087 | 87.50 | 38.84016106 | 0.268365186 |
| 20 | 1.40 | −2.922560714 | 0.859091230 | 210.00 | 46.44438589 | 0.482177152 |
| 21 | 1.48 | −3.405234308 | 0.813288819 | 350.00 | 50.88136089 | 0.606933898 |
| 22 | 1.95 | −5.800692227 | 0.585976305 | 280.00 | 48.94316063 | 0.552436507 |
| 23 | 2.11 | −6.485649106 | 0.520978598 | 672.00 | 56.54738546 | 0.766248474 |
| 24 | 3.15 | −9.966211076 | 0.190697157 | 1120.00 | 60.98436045 | 0.891005220 |
| 25 | 3.25 | −10.23766722 | 0.164937832 | 437.50 | 52.81956115 | 0.661431288 |
| 26 | 3.21 | −10.13010065 | 0.175145162 | 1050.00 | 60.42378598 | 0.875243254 |
| 27 | 3.39 | −10.60399396 | 0.130175939 | 1750.00 | 64.86076097 | 1.000000000 |
Main effects on GRGs
GRG values are presented in Table 5. As a large value of the GRG is needed, the finest grouping of input factors becomes 'A2 B1 C2'. The last row in table 6 displays the rank for individual factors. Accordingly, the important input factor seems to be the FR followed by CS and DOC to influence the composite-response. The desired MRR and SR are attained by optimal setting of machining parameters. Figure 6 displays the GRGs corresponding to process parameters. The GRG values appear to decrease with FR from A1 to A3, while with both CS and DOC, the GRG values first rise from level 1 to 2 and thereafter fall to level 3. From table 6 and figure 6, the FR seems to be a significant factor for finish machining conditions.
Table 5. Calculated GRCs and GRGs for finish machining.
| Full factorial design | Grey relational coefficient | ||||||
|---|---|---|---|---|---|---|---|
| Exp. no. | A | B | C | Ra | MRR | Grade for W1 = 0.8, W2 = 0.2 | Grade order |
| 01 | 1 | 1 | 1 | 0.589587885 | 0.333333333 | 0.538336975 | 12 |
| 02 | 1 | 1 | 2 | 0.773066117 | 0.388762522 | 0.696205398 | 05 |
| 03 | 1 | 1 | 3 | 0.631964322 | 0.430518820 | 0.591675221 | 08 |
| 04 | 1 | 2 | 1 | 0.441736448 | 0.411224260 | 0.435634010 | 21 |
| 05 | 1 | 2 | 2 | 0.417581532 | 0.498971678 | 0.433859561 | 22 |
| 06 | 1 | 2 | 3 | 0.431981772 | 0.569926365 | 0.459570690 | 18 |
| 07 | 1 | 3 | 1 | 0.358735139 | 0.451718660 | 0.377331843 | 27 |
| 08 | 1 | 3 | 2 | 0.333333333 | 0.559868971 | 0.378640461 | 26 |
| 09 | 1 | 3 | 3 | 0.342564774 | 0.650778346 | 0.404207488 | 24 |
| 10 | 2 | 1 | 1 | 0.960258573 | 0.375749497 | 0.843356758 | 02 |
| 11 | 2 | 1 | 2 | 1.000000000 | 0.447688555 | 0.889537711 | 01 |
| 12 | 2 | 1 | 3 | 0.759434885 | 0.503984201 | 0.708344748 | 04 |
| 13 | 2 | 2 | 1 | 0.463706100 | 0.477738707 | 0.466512622 | 15 |
| 14 | 2 | 2 | 2 | 0.419690309 | 0.600401169 | 0.455832481 | 19 |
| 15 | 2 | 2 | 3 | 0.516946346 | 0.706192784 | 0.554795634 | 09 |
| 16 | 2 | 3 | 1 | 0.358735139 | 0.533276852 | 0.393643481 | 25 |
| 17 | 2 | 3 | 2 | 0.382648550 | 0.690815985 | 0.444282037 | 20 |
| 18 | 2 | 3 | 3 | 0.373805401 | 0.834687759 | 0.465981873 | 16 |
| 19 | 3 | 1 | 1 | 0.670419305 | 0.405964491 | 0.617528342 | 07 |
| 20 | 3 | 1 | 2 | 0.780142235 | 0.491244622 | 0.722362712 | 03 |
| 21 | 3 | 1 | 3 | 0.728108139 | 0.559868971 | 0.694460306 | 06 |
| 22 | 3 | 2 | 1 | 0.547031770 | 0.527669126 | 0.543159241 | 11 |
| 23 | 3 | 2 | 2 | 0.510714065 | 0.681429587 | 0.544857170 | 10 |
| 24 | 3 | 2 | 3 | 0.381882620 | 0.821025099 | 0.469711116 | 14 |
| 25 | 3 | 3 | 1 | 0.374514395 | 0.596254061 | 0.418862328 | 23 |
| 26 | 3 | 3 | 2 | 0.377399837 | 0.800311486 | 0.461982167 | 17 |
| 27 | 3 | 3 | 3 | 0.365010379 | 1.000000000 | 0.492008303 | 13 |
Table 6. Main effects on GRGs for finish machining.
| Level | CS (A) (m/min) | FR (B) (mm/tooth) | DOC(C) (mm) |
|---|---|---|---|
| 1 | 0.479495739 | 0.700200908 | 0.514929511 |
| 2 | 0.580254149 | 0.484881392 | 0.558617744 |
| 3 | 0.551659076 | 0.426326665 | 0.537861709 |
| Max -min | 0.100758411 | 0.273874243 | 0.043688233 |
| Rank | 2 | 1 | 3 |

Figure 6. Main effects plot for finish machining.
Download figure:
Standard image High-resolution image
Response function showing the relationship between the process parameters and GRG, obtained through regression analysis using Minitab, is represented by equation (2).

Analysis of variance (ANOVA)
The influence of input factors for the two response parameters can be obtained through ANOVA. Table 7 shows that FR is significant among all three factors at 95% confidence level. The % contribution of the input factor are FR 82.02%, CS 10.63%, and DOC 03.48% respectively.
Table 7. ANOVA for finish machining.
| Factor | D.F | Sum of squares | Mean squares | F-ratio | Percent contribution | F > Ftable |
|---|---|---|---|---|---|---|
| CS (A) | 2 | 0.016177 | 0.008089 | 2.76 | 10.63% | Insignificant |
| FR (B) | 2 | 0.124798 | 0.062399 | 21.27 | 82.02% | Significant |
| DOC(C) | 2 | 0.005307 | 0.002653 | 0.9 | 03.48% | Insignificant |
| Error | 2 | 0.005867 | 0.002933 | |||
| Total | 8 | 0.152149 | ||||
| F0.05 (2,8) | 4.45 | |||||
The results can be understood in light of the mechanics of machining. The high feed rate generally causes an increase in vibrations of workpiece and cutting tool. This increases surface roughness during machining [45]. Also, increasing the feed rate means an increment in the machined mark due to a thicker chip generation which results in more cutting forces and therefore the roughness increases considerably [46].
Prediction of optimum condition
Focus of the present work is to obtain the best levels of machining parameters for low SR and high MRR. The likely mean at the ideal input parameters (μ) is premeditated using equation (3), where A2, B1, and C2 express the average of the GRG at the optimal settings, and  is the gross average value of GRG [47]. The Confidence interval is obtained using equation (4).


Where,


This produces, μ = 0.7648, and C.I = 0.0895. Thus, for significance level 0.05, the projected best state turns out to be '0.6753  μ
μ
 0.8543', where GRG for the validation test at an optimal combination (A2 B1 C2) lies.
Conclusion and future scope
Optimization of machining of Al-4032/3%SiC MMC has been attempted for both rough and finish machining. The MRR has been considered the only response parameter for rough machining, while both response parameters i.e., surface roughness and MRR have been considered for finish machining. The impact of input parameters has been explored on the response parameters. Full factorial design with 3-factors at 3-level each has been used for experimentation. TGRA has been employed to obtain the best combination of input parameters for the composite response problem for finish machining. Following conclusions have been derived from the research.
- The existence of hard SiC particles in the Al-4032 matrix makes this composite hard to machine. However, machining becomes comparatively easier at high CS and low FR, resulting in a better finish.
- For rough machining conditions, all three parameters appear to be significant to control the MRR. The % contribution of the process parameters is: FR (32.75%), DOC (28.42%) and CS (19.18%).
- The optimal setting of parameters for rough machining obtained in the study is: CS = 165 m min−1, F−1R−1 = 0.25 mm tooth−1, and DOC = 2 mm.
- For finish machining conditions, FR seems to be the only significant parameter to influence the composite response (GRG). The % contribution of the FR to the GRG is 82.02%.
- The optimal setting of parameters for finish machining obtained in the study is: CS = 110 m min−1, F−1R−1 = 0.05 mm/tooth, and DOC = 1.2 mm.
In this study, the optimization has been considered for the two response parameters only. The research can be extended to additional response parameters like cutting tool life, energy consumption, etc. Also, features other than Ra for surface roughness measurement like root mean square value (RRMS), maximum peak to valley height (Rt) can also be considered.