
Abstract
Hybrid organic-inorganic perovskites hold tremendous promise for next-generation portable power source applications. However, the device reliability under severe mechanical deformations is limited due to the use of brittle indium tin oxide (ITO). In the current study, we have attempted to enhance the bendability of the device by employing an encapsulation on the ITO coated polyethylene terephthalate (PET) substrate. The aim of this encapsulant buffer layer is to shift the location of the maximum bending stresses away from the ITO as well as provide barrier properties against the environment. Ethylene-vinyl acetate (EVA), as well as Polyimide (PI) films, have been used as encapsulating materials with the aim to shift the location of the neutral axis to the ITO. Finite element analysis has been done to evaluate the principal stresses generated in ITO during monotonic bending under different modes of bending, the thickness of encapsulant layers as well as radii of bending. The effect of the number of bending cycles, mode of bending as well as the bending radii on the conductivity of the ITO have been studied experimentally. A large change in resistance of ITO film has been used as a metric to determine the failure of the ITO film. Samples encapsulated with an optimum thickness of PI shows a significant reduction in percentage change in resistance as compared to raw samples for both cases of bending, while EVA encapsulated samples hardly show any improvement. Moreover, both the modulus and thickness of an encapsulant play an important role in enhancing the bendability.
Export citation and abstract BibTeX RIS
1. Introduction
Organic-inorganic hybrid perovskites are recognized as one of the most favorable materials for flexible and lightweight photovoltaic devices [1–5]. In addition, they can be processed at low temperatures and deposited on plastic substrates. High-power to weight ratio, portability, and compatibility with roll to roll production makes them even more attractive for commercial interests as compared to their rigid counterparts [6]. Moreover, their flexibility and lightweight make them amenable for a range of applications like portable power sources, unmanned vehicles, wearable electronics, and solar automobiles.
A critical layer of any flexible perovskite cell is the conducting transparent photoanode. It is through this layer that the generated electrons get transferred to the external circuit after the active perovskite layer absorbs the photons. Polyethylene terephthalate (PET) and Polyethylene naphthalate (PEN) coated with transparent conductive oxide are the most widely used flexible substrate for flexible photovoltaic application [7]. Indium tin oxide (ITO) is the most commonly used transparent conductive oxide because of its high transparency, conductivity and excellent adhesion with most kinds of substrates [8]. However, its inherent brittle nature makes it difficult to use it as a photoanode layer in flexible devices. ITO in the flexible photovoltaic (PV) device is the earliest to get damaged under the stresses resulting from tension, compression and bending loading scenarios [9]. It has been reported that the sheet resistance increases considerably indicating damage of ITO after bending ITO/PET and ITO/PEN to a radius of curvature ranging from 16 mm to 2 mm [7].
Graphene, carbon nanotubes, silver mesh, and other conductive oxides are used as alternatives to replace conventional ITO in flexible devices [6, 10, 11]. However, these alternatives though more flexible than ITO, are inferior to ITO in terms of conductivity, transparency, and cost of production. Poly(3,4-ethylene dioxythiophene): poly(styrene sulfonate (PEDOT: PSS) is another flexible photoanode material with acceptable conductivity that can be processed at low temperatures [12]. But PEDOT: PSS is sensitive to moisture and oxygen present in the atmosphere and degrades quickly when it is exposed to it [13]. Therefore, it becomes important to find an alternative solution to increase the mechanical stability of perovskite solar cells under bending while using ITO itself as a transparent anode.
An alternative approach to resolve the problem of stress-induced degradation of ITO can be to appropriately design the cell architecture after consideration of the straining conditions under use. One such approach is to have the ITO layer in the device shifted to the neutral axis position where the bending stresses are expected to be minimum [14]. This is achieved by means of having a buffer layer above or below the ITO layer. Various buffer layers could be used to increase the thermal, chemical, and mechanical stabilities of flexible devices. So, a design rule has been suggested which can be used to get the optimum value of thickness and modulus of the buffer layer so that the ITO layer can be shifted to the neutral axis. However, this design study does not shed light on the performance of the ITO coated substrate under multiple cycles of bending. This knowledge gap is critical to fill since in real-life applications ITO coated substrates may be subjected to several bending cycles when used for flexible applications. Cracks may nucleate in ITO in the initial cycles and propagate with subsequent cycles thus degrading the resistance progressively. Choosing an appropriate encapsulant as the buffer layer may help in both preventing environmental degradation as well as reducing the stress in the ITO. Hence, in this current study, we have used ethylene vinyl acetate (EVA) as well as polyimide (PI) films as the encapsulating materials. The effect of the encapsulant and its thickness on the conductivity of the ITO coated samples under bending fatigue has been studied experimentally as well as related to the stresses generated during bending. The stresses have been computed using finite element modeling of the device subjected to similar monotonic displacements as had been applied cyclically in the experiments. Although we have considered only two layers of a flexible photovoltaic cell (substrate and the transparent conductive oxide) in this study, the mechanics for the complete cell with other multilayers (electron transport layer, active layer, and hole transport layer) is going to be similar as the typical thickness of these layers is of the order of nanometers and their modulus is very less compared to ITO.
The specimens were bent to a radius of curvature of 5.5 mm and 4 mm in 3-point bend test for a displacement of 1 mm and 2 mm respectively and to 3.5 mm and 2.75 mm in buckling test for a displacement of 10 mm and 15 mm respectively. The percent change in electrical resistance at a different number of cycles was selected as a metric to determine the failure of the ITO film. Initial results showed a great influence of bending radius and number of cycles on the bending fatigue and hence the conductivity of such samples. The resistance increases as early as after 20 bending cycles because of the brittle nature of the ITO thin film. Encapsulation helps to reduce the stresses generated in the ITO layer and subsequently the percentage change in resistance, by shifting the ITO close to the neutral axis. Both the thickness and modulus of the encapsulant is critical for getting the optimum bendability for the ITO coated samples. The thickness of the encapsulant required to get the maximum bendability for ITO coated samples is more for lower modulus encapsulant and vice versa. However, with an increase in the thickness of the specimen, the load required to bend the specimen to a particular bending radius increases and hence the stresses generated in ITO may also increase. Also, with an increase in the thickness of the encapsulant, the probability of delamination of the encapsulation from the surface of ITO increases. Hence, it is important to select the encapsulant with optimum modulus and thickness based on careful experiments in order to get maximum flexibility under repeated bending.
2. Materials and methods
The raw test samples used in this study consist of a commercially available ITO coated PET sheet from Sigma Aldrich, with 72 nm thick ITO on 127 μm thick PET substrate. Each of the samples used in this study was prepared by cutting the sheet into strips of dimensions 60 mm × 10 mm × 0.127 mm. Commercially available EVA sheets and PI tape were used as an encapsulant on the ITO. The schematic of the cross-section of each kind of sample is shown in figure 1. Encapsulation with EVA was done at 135 °C inside laminator whereas PI tape was used directly for the encapsulation of ITO coated PET. Different thicknesses of EVA and PI have been used for encapsulation by varying the number of layers of the respective encapsulant. ITO coated PET was laminated with different EVA thickness that is 250 μm (E250), 700 μm (E700), 1200 μm (E1200) and 1800 μm (E1800) and PI thickness that is 25 μm (P25), 50 μm (P50), 75 μm (P75), 100 μm (P100), 125 μm (P125) and 150 μm (P150).
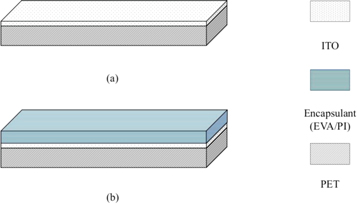
Figure 1. Schematic of (a) raw sample (b) encapsulated sample.
Download figure:
Standard image High-resolution imageFor the study of the bendability of the flexible devices, it is necessary to know the elastic modulus of the different layers of the device. This can be measured by using standard nanoindentation technique. From the load versus displacement plot (figure 2), obtained from the nano-indentation test, the modulus value can be calculated using the Oliver and Pharr method [15, 16]. The modulus for PET has been measured to be around 3.2 GPa while for the EVA it was 17 MPa. The modulus values of ITO and PI have been taken from the literature and shown in table 1 [17–19]. Thus, it can be seen from the modulus values of both PET and EVA that the stiffness of EVA is very less as compared to the PET. Therefore, the thickness of EVA required to make the stresses at the ITO layer minimum should be extremely large.
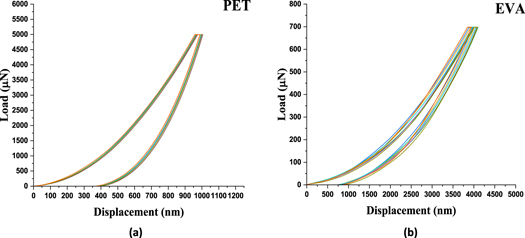
Figure 2. Load-Displacement Curve for (a) PET and (b) EVA.
Download figure:
Standard image High-resolution imageTable 1. Mechanical Properties of ITO, PET, EVA, and PI.
| Material | ITO | PET | EVA | PI |
|---|---|---|---|---|
| Modulus (MPa) | 116 × 103 | 3.2 × 10³ | 17 | 2.5 × 10³ |
| Poisson's Ratio | 0.35 | 0.38 | 0.49 | 0.34 |
In order to find the bending durability of ITO coated PET, the specimens were tested under 3-point bend and buckling induced bending under fatigue conditions using an ElectropulsTM E1000 machine as shown in figure 3. The specimen is bent by applying cyclic displacement in a sinusoidal form to the sample. The range of displacement being 1 mm and 2 mm for a 3-point bend test and 10 mm and 15 mm for buckling test as shown in figure 4. Each sample subjected to mechanical test was subjected to 1000 bending cycles and percentage change in resistance after every 20 cycles till 100 cycles and thereafter every 100 cycles till 1000 cycles, was recorded with the help of a two-point probe multimeter. A conductive silver paste was used to form terminals for the electrical resistance measurements to avoid direct contact between the probes and the surface of the thin film. The silver paste was used because it does not contribute to the thin film resistance. The total length of the sample taken was 60 mm, width 10 mm and span length of 10 mm, for all the conditions for a 3-point bend test. The percent change in the electrical resistance is plotted against the number of cycles during the test, where Ro is the initial resistance of the ITO film before testing. The electrical resistance was measured while the sample is in a flat position. The sample is bent in such a way that the thin ITO film will have tensile stresses and the substrate will experience compressive stresses for the unencapsulated films. The reference position is when the sample is flat; consistent electrical resistance measurement was made relative to the original resistance. Conductive failure is expressed in terms of percentage change in electrical resistance [(Ri - Ro)/Ro] *100, defined as the change in the electrical resistance with respect to the original resistance Ro; where (Ri - Ro) is the difference between the current resistance value at certain number of cycles and the original resistance. The percent change in resistance for both raw and encapsulated samples have been compared. The bending stress generated in the ITO layer is calculated using FEM since the analytical bending theory does not work very well for large deformation.
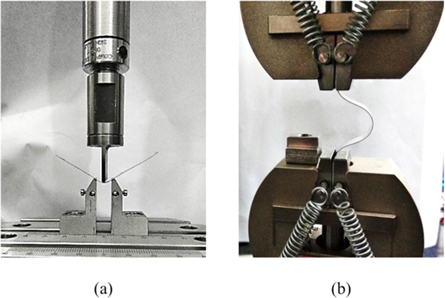
Figure 3. Samples tested under (a) 3-point bend test condition (b) Buckling Condition.
Download figure:
Standard image High-resolution image
Figure 4. Sinusoidal Displacement cycle used for (a) 3-Point Bend test and (b) Buckling test.
Download figure:
Standard image High-resolution image3. Results and discussion
3.1. Finite-element modeling (FEM)
The bending model for the ITO coated PET (both raw and encapsulated) is constructed by the use of a general-purpose FEM package (ABAQUS SIMULIA, Providence, RI, USA). 3-point bending, as well as the buckling response of the device under maximum displacement of 1 mm and 2 mm for 3-point bend and 10 mm and 15 mm for buckling test, has been analyzed. A three-dimensional model was built using solid elements. For meshing an 8-node linear brick, incompatible modes (C3D8I) element was used. The mesh was tested for convergence for both the 3-point bend and buckling test. For evaluating the bending resistance of ITO coated PET (both raw and encapsulated), the maximum principal stresses generated in ITO is calculated using FEM. The maximum principal stress generated in ITO for both the 3-point bend and buckling test has been summarized in table 2.
Table 2. Maximum Principal Stress in ITO for 3-point bend test and buckling test.
| Maximum Principal Stress (MPa) at the mid-section | ||||
|---|---|---|---|---|
| 3-Point Bending [Displacement(mm)] | Buckling [Displacement(mm)] | |||
| Sample | 1 | 2 | 10 | 15 |
| Raw | 945.1 | 1890.14 | 2492.46 | 3902.6 |
| E250 | 937.966 | 1875.93 | — | — |
| E700 | 1097.33 | 2194.65 | — | — |
| E1200 | 1585.18 | 3170.36 | — | — |
| E1800 | 2592.63 | 5185.25 | — | — |
| P25 | — | 1600.07 | 2115.05 | 3327.05 |
| P50 | — | 1297.57 | 1719.83 | 2730.77 |
| P75 | — | 989.798 | 1312.32 | 2114.79 |
| P100 | — | 693.546 | 905.161 | 1498.82 |
| P125 | — | 414.246 | 479.973 | 893.348 |
| P150 | — | 144.55 | 65.0734 | 265.78 |
Stress generated in ITO has a direct impact on the extent of the degradation of ITO. The failure stress of the ITO layer is around 1.2 GPa [20] but it can fail at a lower stress under cyclic fatigue. The degradation reflects in terms of resistance increase. In order to reduce the computational complexity of the problem in the 3-point bend test, symmetry was used to reduce the structure to 1/4th. The sample was supported at two ends at a distance of 10 mm and bent at the midsection of the sample by giving a displacement of 1 mm and 2 mm for the three-point bend test. It was found that the high-stress locations were in the middle section across the width of the sample for both raw and encapsulated samples as shown in figures 5–7, while it decreases towards the edges. The maximum stresses were at the midsection of the sample because there are no constraints on the edges.
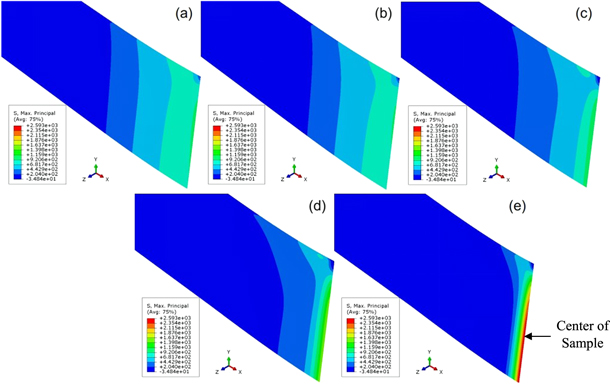
Figure 5. FEM contour plots for principal stress (MPa) in ITO of (a) Raw (b) E250 (c) E700 (d) E1200 (e) E1800, for 3-point bend test at 1 mm displacement.
Download figure:
Standard image High-resolution image
Figure 6. FEM contour plots for principal stress (MPa) in ITO of (a) Raw (b) E250 (c) E700 (d) E1200 (e) E1800, for 3-point bend test at 2 mm displacement.
Download figure:
Standard image High-resolution image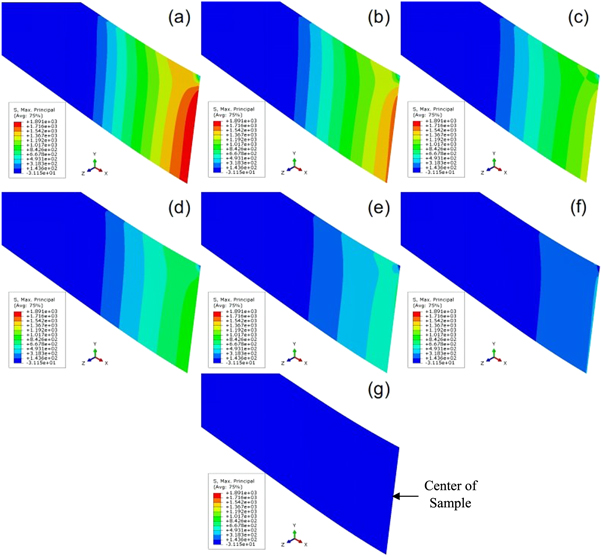
Figure 7. FEM contour plots for principal stress (MPa) in ITO of (a) Raw (b) P25 (c) P50 (d) P75 (e) P100 (f) P125 (g) P150, for 3-point bend test at 2 mm displacement.
Download figure:
Standard image High-resolution imageFigures 5 and 6 shows the FEM contour plots for maximum principal stress generated in the ITO layer of the samples encapsulated with different EVA thickness for 1 mm and 2 mm displacement for a 3-point bend test. From the plots, it is clear that the regions of high principal stress in the ITO decrease with an increase in the thickness of the EVA sample at both 1 mm and 2 mm displacement. However, the maximum principal stress gets enhanced with an increase in the thickness of EVA beyond 250 μm.
However, encapsulation with PI shows a significant reduction in the maximum principal stress generated in the ITO layer as shown in figure 7 and table 2. The stress in the ITO layer decreases with an increase in the thickness of PI being used and thus we can see a significant reduction in the stress in the ITO layer that is from 1.89 GPa in the raw sample to 31.15 MPa in P150 sample.
For modeling of the buckling test in Abaqus, the bottom part of the specimen up to 15 mm length from the end was encastre while the top portion of the sample up to 15 mm from the end was constrained from all directions except in the y-direction. A displacement of 10 mm and 12 mm was given at the center of the specimen from the PET side so that the sample buckles similarly as it buckles during the experiment while giving the displacement of 10 mm and 15 mm to the top of the sample during testing. Figures 8 and 9 shows the maximum principal stress generated in
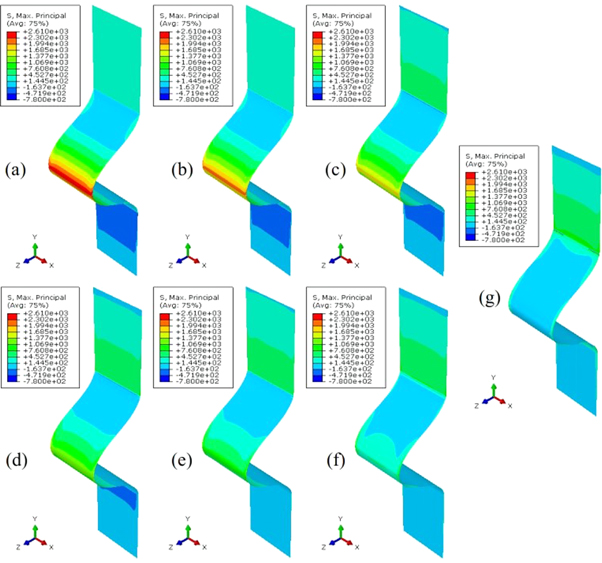
Figure 8. FEM contour plots for principal stress (MPa) in ITO of (a) Raw (b) P125 (c) P150, for buckling test at 10 mm displacement.
Download figure:
Standard image High-resolution image
Figure 9. FEM contour plots for principal stress (MPa) in ITO of (a) Raw (b) P25 (c) P50 (d) P75 (e) P100 (f) P125 (g) P150, for buckling test at 15 mm displacement.
Download figure:
Standard image High-resolution imageITO for samples encapsulated with PI at 10 mm and 15 mm displacement respectively during buckling test. Table 2 shows the values for maximum principal stress in ITO for PI encapsulated samples at 10 mm and 15 mm displacement respectively. It can be seen that encapsulation with PI helps in reducing the stress generated in the ITO layer. In both buckling 10 and 15 mm displacement, the stress in the ITO reduces with increases in thickness of PI with minimum stress is for the P150 sample.
3.2. Point bend fatigue test
The percentage change in resistance of ITO was measured after the tests for different thicknesses of EVA laminated on to the ITO coated PET, for 1 mm and 2 mm displacement in 3-point bending fatigue. Four specimens with different thicknesses of EVA as an encapsulant were used i.e. E250, E700, E1200 and E1800. All specimens were subjected to 1000 cycles. It can be seen from figure 10 that when 1 mm displacement is applied in the middle of the specimens to bend them, there is hardly any change in percentage resistance. It is around 0.375% for the raw specimen and 0.32% for E250 respectively even after 1000 cycles of bending fatigue. However, for E700, E1200 and E1800 the percentage change in resistance increases to 2.5%, 16%, and 75% respectively after 1000 cycles of loading and unloading (figure 10). Thus, we can say that the raw specimen is resistant to bending displacement of 1 mm in the center up to 1000 cycles and thus encapsulation is not required for its mechanical stability. 250 μm of encapsulation of EVA makes the ITO more robust against degradation, However, encapsulation thicker than 700 μm exacerbates the degradation of the ITO layer which is reflected by the increased percentage change in resistance for encapsulated samples. This is consistent with the principal stress calculations as well. (table 2).
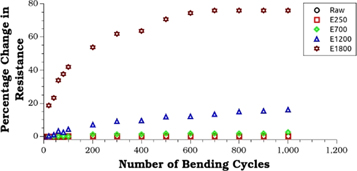
Figure 10. Percentage change in resistance versus Number of bending cycles for 3-Point bend test at 1 mm displacement (sample encapsulated with EVA).
Download figure:
Standard image High-resolution imageFor 2 mm displacement (figure 11) we can see a reasonable increase in percent change in resistance of raw specimen which is around 222% after 1000 cycles. Sample E250 and E700 show a marginally lower resistance change. Although the maximum principal stress in specimens with EVA thickness above 250 μm is higher than the raw specimen according to FEM computations, the region of the ITO layer having principal stress above 900 MPa decreases with an increase in the thickness of EVA. Hence, for E700, the resistance change is less than the raw sample. However, with a further increase in EVA thickness the resistance change increases due to a sharp increase in the principal stress at the mid-section.
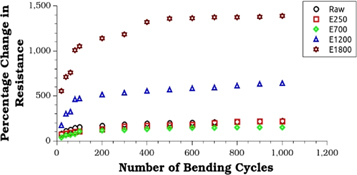
Figure 11. Percentage change in resistance versus Number of bending cycles for 3-Point bend test at 2 mm displacement (sample encapsulated with EVA).
Download figure:
Standard image High-resolution imageAnother encapsulant with higher modulus: Polyimide (PI) is used and tested for 2 mm displacement under the 3-point bend test condition. PI encapsulated samples P25, P50, P75, P100, and P150 were used, which shows the percentage change in resistance of 217.9%, 58.3%, 186.9%, 179.5%, and 165% respectively (figure 12). The percentage resistance change for raw specimen was 222%. It can be seen that P50 shows the lowest resistance change, while for PI thicknesses above 50 μm

Figure 12. Percentage change in resistance versus Number of bending cycles for 3-Point bend test at 2 mm displacement (sample encapsulated with PI).
Download figure:
Standard image High-resolution imagethe resistance change is much higher. This is most probably due to the delamination of the layers due to the higher loads faced by the thicker structure to bend it to 2 mm displacement. Moreover, there is no clear trend for resistance change for specimens with PI thickness 75 um or more because of delamination. This is because of the random nature of delamination and its aftermath on the ITO stress-development.
3.3. Buckling fatigue tests
Buckling test to induce bending has also been used to investigate the bending durability of ITO coated PET. Samples encapsulated with EVA were not tested for buckling since it imposes a more severe stress state than 3-point bend and encapsulation is suspected to be not of much help in reducing the resistance. Raw and samples encapsulated with the different numbers of layers of PI were tested.
Figure 13 shows the plot for the percentage change in resistance versus the number of bending cycles for the buckling test for 10 mm displacement of the sample in the loading direction for which the buckling occurs in a direction perpendicular to the loading direction. There is a significant reduction in percentage resistance change for the samples encapsulated with PI and subjected to buckling with 10 mm displacement. The percentage change in resistance after buckling for 1000 cycles reduces from 598.92% for the raw sample to 127.1%, 150.3%, 106 and 55.2% for samples P25, P50, P75, and P100 respectively. Further increase in the thickness of PI is not beneficial as there occurs the problem of delamination of PI from the substrate. Thus, we are getting the least percentage change in resistance for the sample encapsulated with 4layers of PI tape (P100) and subjected to buckling with 10 mm displacement.

Figure 13. Percentage change in resistance in ITO versus Number of bending cycles for buckling test of PI coated specimens under 10 mm displacement.
Download figure:
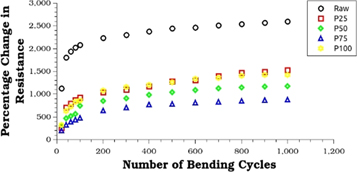
Standard image High-resolution imageSimilarly, for the samples encapsulated with PI shows a reduction in percentage resistance change subjected to buckling with 15 mm displacement. The reduction in percentage resistance change after 1000 buckling cycles takes place from 2601.6% for the raw sample to 1529.6%, 1172.3% and 874.5% for samples encapsulated with P25, P50 and P75 and P100 respectively (figure 14). Thus, sample encapsulated with 3layers thick PI (P75) shows the least percentage resistance change and a further increase in PI layers creates a delamination problem.
Figure 14. Percentage change in resistance in ITO versus Number of bending cycles for buckling test of PI coated specimens under 15 mm displacement.
Download figure:
Standard image High-resolution image
The FEM computations suggest that principal stress can be tuned by changing the thickness and modulus of the encapsulating layer. However, these stresses have been calculated for monotonic loading. It can be seen from the change in resistance versus the number of cycles plots, that the resistance change after monotonic loading is not the same as that seen after multiple cycles of loading and unloading. This implies that damage gets accumulated and the robustness of the ITO keeps on worsening with more cycles of loading. This damage in the form of cracks leads to a decrease in the conductivity of ITO. The percentage increase in resistance for all the samples during both bending and buckling increases sharply during the initial 100 cycles, and beyond that, the resistance begins to approach the plateau. Most of the increase in resistance is attributed to the initial 100 cycles which might be due to the fracture of the ITO layer in the high-stress region. With further increase in the number of cycles, the resistance increase is less significant compared to the initial 100 cycles and this slight increase might be due to the damage of ITO in the low-stress region due to fatigue loading.
The majority of the FEM and experimental results are completely consistent with each other however, we see some inconsistency only for the PI specimens when the thickness of the PI is increased by bonding more than 3 layers of PI. This might be due to the poor adhesion of the encapsulating layer with ITO film. The situation becomes even worse for the samples encapsulated with thick buffer layers at higher loads, which results in complete delamination of the buffer layer from the ITO surface. Even though the samples encapsulated with PI show resistance change, but it is much less than the percentage resistance change in raw samples. Moreover, with small displacements, this resistance change is even smaller for encapsulated samples. Thus, from the experimental and FEM modeling results we can say that encapsulation of the ITO based substrate is a reliable technique to make the cell more durable for bending if the optimum modulus and thickness of the encapsulant is chosen and proper adhesion of the encapsulant with the ITO coated substrate is achieved.
4. Conclusion
This work provides a solid background to show that the bending durability of the ITO coated PET could be significantly enhanced with the help of encapsulation. The material of the encapsulation layer, as well as its thickness, plays a key role in alleviating the resistance rise of the ITO film after multiple cycles of bending. It has also been shown that the direct correlation between the principal bending stresses under monotonic loading evaluated using FEM and the experimental rise in resistance only exists for the low thickness of encapsulants. There are inconsistencies that arise at higher encapsulation thicknesses because of delamination. Moreover, stress determined using the conditions of monotonic loading may not be appropriate for fatigue loading. Thus, through careful fatigue experiments, we have shown that ITO coated PET encapsulated with polyimide films shows a significant reduction in percentage change in resistance as compared to uncoated as well as EVA coated samples. However, the optimum thickness of polyimide is necessary to get the least percentage change in resistance. Our work shows that this optimum thickness can be found out using a combination of FEM simulations and a limited number of experiments. If the device architecture is similar, then the results in this study can be used as guidelines for the selection of encapsulants to enhance the flexibility of solar cells under fatigue.
Acknowledgments
The authors will like to acknowledge the support of the Department of Science and Technology- Clean Energy Research Initiative (DST-CERI), Solar Energy Research Institute for India and the United States (SERIIUS) and National Center for Photovoltaic Research and Education (NCPRE) towards this work.