
Abstract
Ultrasensitive nanomechanical instruments, e.g. atomic force microscopy (AFM), can be used to perform delicate biomechanical measurements and reveal the complex mechanical environment of biological processes. However, these instruments are limited because of their size and complex feedback system. In this study, we demonstrate a miniature fiber optical nanomechanical probe (FONP) that can be used to detect the mechanical properties of single cells and in vivo tissue measurements. A FONP that can operate in air and in liquids was developed by programming a microcantilever probe on the end face of a single-mode fiber using femtosecond laser two-photon polymerization nanolithography. To realize stiffness matching of the FONP and sample, a strategy of customizing the microcantilever's spring constant according to the sample was proposed based on structure-correlated mechanics. As a proof-of concept, three FONPs with spring constants varying from 0.421 N m−1 to 52.6 N m−1 by more than two orders of magnitude were prepared. The highest microforce sensitivity was 54.5 nm μN−1 and the detection limit was 2.1 nN. The Young's modulus of heterogeneous soft materials, such as polydimethylsiloxane, muscle tissue of living mice, onion cells, and MCF-7 cells, were successfully measured, which validating the broad applicability of this method. Our strategy provides a universal protocol for directly programming fiber-optic AFMs. Moreover, this method has no special requirements for the size and shape of living biological samples, which is infeasible when using commercial AFMs. FONP has made substantial progress in realizing basic biological discoveries, which may create new biomedical applications that cannot be realized by current AFMs.
Highlights
A miniature fiber optical nanomechanical probe (FONP) can be used to detect the mechanical properties of single cells and in vivo tissue measurements is demonstrated.
The FONP is developed by programming a microcantilever probe on the end face of a single-mode fiber using femtosecond laser 3D printing.
A strategy of customizing the microcantilever's spring constant according to the sample based on structure-correlated mechanics is proposed and the stiffness of FONP is adjustable.
The FONPs can operate in air/liquids and show ultra-high force resolution, whose highest microforce sensitivity and detection limit are 54.5 nm μN−1, 2.1 nN respectively.
The FONPs provide a universal protocol for directly programming fiber-optic AFMs and make substantial progress in realizing basic biological discoveries
Export citation and abstract BibTeX RIS

Original content from this work may be used under the terms of the Creative Commons Attribution 4.0 license. Any further distribution of this work must maintain attribution to the author(s) and the title of the work, journal citation and DOI.
1. Introduction
Over the past few decades, tremendous progress has been made in the development of ultrasensitive nanomechanical instruments that allow scientists to track and measure molecular-level forces to deeply understand the mechanics of biomolecular systems [1–4]. In addition, materials science, pharmacology and minimally invasive medicine all need to accurately control or measure the weak force acting on small objects [5–9]. Additionally, microforce measurements can also be used to study the mechanical properties of materials such as friction forces, adhesion [10, 11], and Young's modulus. Many biological studies have shown that biological performance and pathogenesis are closely related to mechanical properties from the cell to organ level [12–16]. Currently, atomic force microscopy (AFM), which uses microcantilever probes to interact with the tested sample to obtain information on the force distribution, is the most commonly used nanomechanical instrument for characterizing soft biomaterials [17–19]. Despite success, AFM has limitations outside professional laboratories because of the complex structure and instrument size [1]. Additionally, for many decades, the conventional AFM has remained largely unchanged in its detection principle, force feedback mechanism, and the nanomachining processes and constituent materials of the microcantilever used, which greatly limit its application in biological sample examination [20]. Furthermore, microcantilevers with different stiffness are needed for different samples. In this case, tailoring and calibrating the microcantilever creates more operation difficulties, increases the cost, and reduces the efficiency and throughput. All of which limit the widespread applicability of AFM [21, 22]. Therefore, a new generation of nanomechanical instruments must be developed with miniaturization, integration, high-throughput, and real-time monitoring. Optical fibers, which have characteristics of compactness, flexibility, and great biocompatibility [23–26], have become an all-optical platform for realizing miniaturized and integrated sensors. As a result, various fiber optic microforce sensors have been reported. In 2017, Huang et al develop a compact fiber-optic microforce sensor that uses evanescent field to measure local forces and monitor heart-cell beating [1]. However, there are deviations in the micro-force quantitative measurement. It is difficult for the sensor to monitor the target object in real time and it is extremely susceptible to the influence of the external environment, which was attributed to the hysteresis effect caused by the touchless working mode. In 2021, our group [27] reported a micro-force sensor that was fabricated using a femtosecond laser directly polymerized clamped-beam probe at the fiber optical tip. We achieved a force resolution of ∼55 nN. However, this force resolution is relatively low because the beam was supported by two bases. Furthermore, the deflection method is only suitable for objects with regular shapes and thus it cannot achieve the accurate measurement of mechanical properties of heterogeneous soft biomaterials.
The microcantilever probe, the key actuating element in an AFM system, is the product of conventional silicon micromachining [28, 29], and has the advantages of no labeling, speed, real time function, and high sensitivity [30–32]. However, the conventional silicon micromachining technology relies on 2D lithographic patterning and anisotropic etching, resulting in a highly complex and cumbersome manufacturing process that greatly limits the flexibility of the geometry of the microcantilever probe. Femtosecond laser two-photon polymerization (TPP) nanolithography technology has ultra-high machining accuracy, producing features smaller than 100 nm [33–36]. In addition, the conventional silicon micromachining technology can only achieve limited 3D designs [28], while TPP nanolithography can program any complex 3D structure without multiple manufacturing steps. Furthermore, microstructures with different material properties can be fabricated by TPP nanolithography when different doped printing resins are used, overcoming the limitations of single traditional silicon micromachining materials [37]. Therefore, TPP nanolithography has been used to manufacture a variety of functional structures in recent years. Sun et al programmed a controllable microstructural AFM tip by 3D direct laser writing and applied it to shear force imaging [20]. Stassi et al reported nano-electro-mechanical systems resonators with high quality factors for highly sensitive mass sensing, which was fabricated by a 3D printing method [37]. Alsharif et al reported a microcantilever probe printed using TPP lithography technology, and installed the printed probe in an AFM system to realize intermittent contact mode imaging, which created a new idea for imaging technology [28]. However, it is still challenging to make nanomechanical instruments, such as AFM, portable with flexibility to detect tissues or cells in vivo. In addition, the mechanical properties of biomaterials will change greatly from the molecule, cell, tissue, and organ level. To realize the stiffness matching of different biomaterials, it is necessary to use new materials and machining processes to construct a stiffness adjustable nanomechanical probe to improve the applicability of the nanomechanical instruments. The combination of fiber optic platforms and nanolithography opens new avenues for developing compact nanomechanical instruments with adjustable stiffness.
We developed a compact fiber optical nanomechanical probe (FONP) which is fabricated by printing a microcantilever probe on the end face of a single mode fiber (SMF) and it can be used to measure the mechanical properties of single cells. The stiffness characteristics of the FONP were simulated and designed based on the finite element method (FEM), and combined with TPP nanolithography technology. The stiffness of FONP was adjustable, and the stiffness mismatching problem of the sample and FONP was solved. As a proof of concept, three FONPs with spring constants varying from 52.6 N m−1 to 0.421 N m−1, ranging more than two orders of magnitude, were fabricated; their corresponding microforce sensitivities were 0.461 nm μN−1, 2.782 nm μN−1, and 54.5 nm μN−1, and an ultra-small detection limit of 2.1 nN was obtained. The Young's modulus of polydimethylsiloxane (PDMS), onion cells, and MCF-7 cells (human breast cancer cells) were measured using the three FONPs respectively. In addition, in vivo measurements of muscle tissue in living mice were performed using FONP and compared with in vitro measurements. To our knowledge, this is the first time that all-fiber-optic-based nanomechanical instrumentation has been used to achieve in vivo measurements of brain muscle in living vertebrates, which is difficult to do with commercial AFMs. Compared with AFMs, FONP offers some originality and substantial progress in biomechanical measurements. This novel FONP platform uses an optical interference readout, simplifies the complex optical lever readout of AFM, and introduced a new method to realize a portable AFM. As a result, the unique concept and superior performance of fiber end printing stiffness tunable microcantilever probe provide an unprecedented opportunity for tissue or cell measurement in vivo.
2. Results
2.1. FONP construction and theoretical basis
Figure 1(a) shows a schematic diagram of the FONP programmed on the SMF end face using TPP nanolithography. A polymer base of 20 μm in length, 20 μm in width and 40 μm in height was designed to support and connect the microcantilever, and there were rectangular stiffeners on both sides of the support base to increase the adhesion between the base and the fiber tip. The microcantilever with length of 60 μm, width of 20 μm, and variable thickness was parallel to the fiber end surface. Additionally, a cylindrical (diameter of 3 μm, height of 20 μm) or conical (bottom diameter of 10 μm, height of 20 μm) probe was printed at the end of the microcantilever, and the tip of the probe was hemispherical. Furthermore, a magnetron sputtering coating instrument was used to deposit a gold coating on the upper surface of the microcantilever to enhance the reflectivity of the surface of the microcantilever and avoid light leaking from the upper surface of the microcantilever. As shown in figure 1(b), the introduction of the fiber end face and the two surfaces of the microcantilever define the Fabry–Perot interferometers (FPIs). The light reflected from the end face of the fiber optical interferes with the light reflected from the lower surface and upper surfaces of the microcantilever and form a reflection spectrum; when a microforce is applied to the microcantilever probe, the microcantilever will deform, which in turn causes a change in the FPI cavity length (D), resulting in a drift of the dip wavelength (λ) in the SMF reflection spectrum. The relationship [27] between the cavity-length reduction (ΔD) and dip-wavelength shift (Δλ) follows Δλ/λ = ΔD/D. Therefore, the deformation of the microcantilever can be tracked by monitoring the change of dip wavelength in the reflection spectrum, and thus the force applied to the probe can be obtained. This FONP provides a powerful optical inspection configuration, replacing the complex optical lever path of commercial AFM [38], and enables greater functional integration [39]. In addition, the structure of the microcantilever with one end fixed and the other end suspended, and the low Young's modulus of the polymer material [40–42] enables deformation of the microcantilever probe under a weak force, resulting in a small force detection limit.
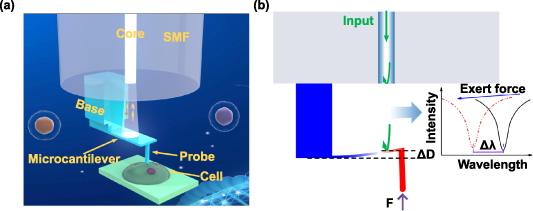
Figure 1. Structure diagram and sensing principle of FONP. (a) Schematic diagram of the fiber optical nanomechanical probe (FONP) based on a microcantilever probe. (b) Simulation diagram of the force sensing principle of FONP.
Download figure:
Standard image High-resolution image2.2. Characterization
FONP measures the mechanical properties of materials using the depth sensing indentation method, which relies on a probe to indent the sample, and then records the relationship between the applied load and the depth of the indentation [43]. An important parameter of FONP is the microcantilever spring constant because its uncertainty is considered to be the main source of quantitative force measurement error [17, 44, 45]. Compared with the sample, if the spring constant is too small, the microcantilever will have a large deformation, and the sample has no indentation depth. Alternatively, if the spring constant is too large, i.e. the microcantilever is too stiff, the microcantilever will not deflect even if the measured sample is significantly indented or damaged [46]. The stiffness matching of FONP and the measured sample is very important for obtaining a reliable Young's modulus. The theoretical calculation formula of the microcantilever's spring constant k is shown in equation (1) [44]:
Here, k (N m−1) is the spring constant of the microcantilever, F (N) is the load on the end of the microcantilever, and dc (m) is the deflection of microcantilever. E (Pa) is the Young's modulus of the microcantilever material, and L (m), b (m), and h (m) are the length, width, and thickness of the microcantilever, respectively.
For a microcantilever made of a certain material, the spring constant k is proportional to the third power of the microcantilever thickness [21]. To investigate and design the stiffness performance of the FONP structure, models of mechanical deformation with different microcantilever thicknesses (6.3, 2.8, and 1.3 μm) were established using COMSOL Multiphysics®. The polymer material parameters including the density ρp, the Young's modulus Ep and the Poisson's ratio υp reported in our previous work [27] are used in the simulation, i.e. ρp = 1499 kg m−3, Ep = 2.34 GPa, and υp = 0.33. When the same micro force of 100 nN was applied to the probe, the microcantilever deflects. The distribution results are shown in figures 2(a)–(c). When the thickness of the microcantilever is 6.3, 2.8, and 1.3 μm, the corresponding deflection is 2.06, 24.35, and 233.3 nm, respectively. The corresponding spring constants are 48.54, 4.11, and 0.429 N m−1, respectively. The relationship curve of the spring constant with the variation of microcantilever thickness was also evaluated, as shown in figure 2(d). The results obtained by finite element simulation are basically consistent with the theoretical calculation results of equation (1). The spring constants of the FONP increases rapidly as the microcantilever thickness increases, and the spring constant increases from 0.1 N m−1 to 70.7 N m−1 when the thickness increases from 0.8 μm to 7.8 μm. This is nearly three orders of magnitude and the range covers the spring constant commonly used for commercial AFM microcantilevers, i.e. from 0.2 N m−1 to 40 N m−1 [47]. This is a major step forward for FONP because researchers can now tailor the mechanical properties of microcantilever probes for specific applications.

Figure 2. FONP stiffness characteristics and SEM images. (a)–(c) The simulation results of the deflection distribution when the same micro force (100 nN) acts on FONPs with different microcantilever thickness (6.3, 2.8, and 1.3 μm). (d) Relationship between the thickness and spring constants of the FONP under the same micro force (100 nN). (e) SEM side views of three different FONPs (FONP-1, FONP-2, and FONP-3) and their corresponding force–deflection test curves. Three strictly repeated measurements were performed for the FONPs, respectively. The spring constants of FONP-1, FONP-2, and FONP-3 are 52.6 ± 1.14, 3.99 ± 0.125, and 0.421 ± 0.032 N m−1, respectively. (f) SEM axonometric view of FONP-3. (g) SEM axonometric view of FONP-1.
Download figure:
Standard image High-resolution imageTaking advantage of the flexible programmability of TPP nanolithography, three FONPs (FONP-1, FONP-2, and FONP-3) with different microcantilever thicknesses were separately programmed on the SMF end face according to a pre-simulated design. Figures 2(e)–(g) shows a series of scanning electron microscope (SEM) images of the FONPs, where three main components, i.e. the base, the microcantilever, and the probe, were clearly distinguished. The polymer is structurally intact, the surface is smooth and flat, and the SMF core is fully blocked by the microcantilever, exciting multi-beam interference with a high extinction ratio. The top half of figure 2(e) is a side view of the FONPs with a measured thickness of 6.34, 2.82, and 1.32 μm. The measured thickness is generally consistent with the designed value, indicating the high accuracy of TPP nanolithography. The microcantilevers of the three FONPs have good parallelism with the fiber tip and the straight base shows repeatability of machining. These data show the reliability and flexibility of programming the microstructure on the fiber tip by TPP nanolithography. Notably, the probes of FONPs with a thickness of 1.32 μm and 2.82 μm are cylindrical, while the probe with a thickness of 6.34 μm is conical. The reason for this design is that for the 6.34 μm thickness, the microcantilever is very stiff. The conical probe makes the FONP more suitable for measuring biological materials with high hardness to avoid bending or damaging the device. The typical force–deflection curves for three FONPs were obtained using a commercial nanoindenter, as shown in the plots of figure 2(e). Three strictly repeated measurements were performed for the FONPs, respectively. Through linear fitting of the measured data [48], the spring constants were 52.6 ± 1.14, 3.99 ± 0.125, and 0.421 ± 0.032 N m−1. The measured spring constants are consistent with the pre-simulated design, indicating that the design is feasible for tailoring spring constants according to the tested sample to match the FONP and sample stiffness. If necessary, we can change the microcantilever thickness using TPP programming, and the spring constant span can exceed more than three orders of magnitude, thereby creating unlimited practical applications.
2.3. Force measurement
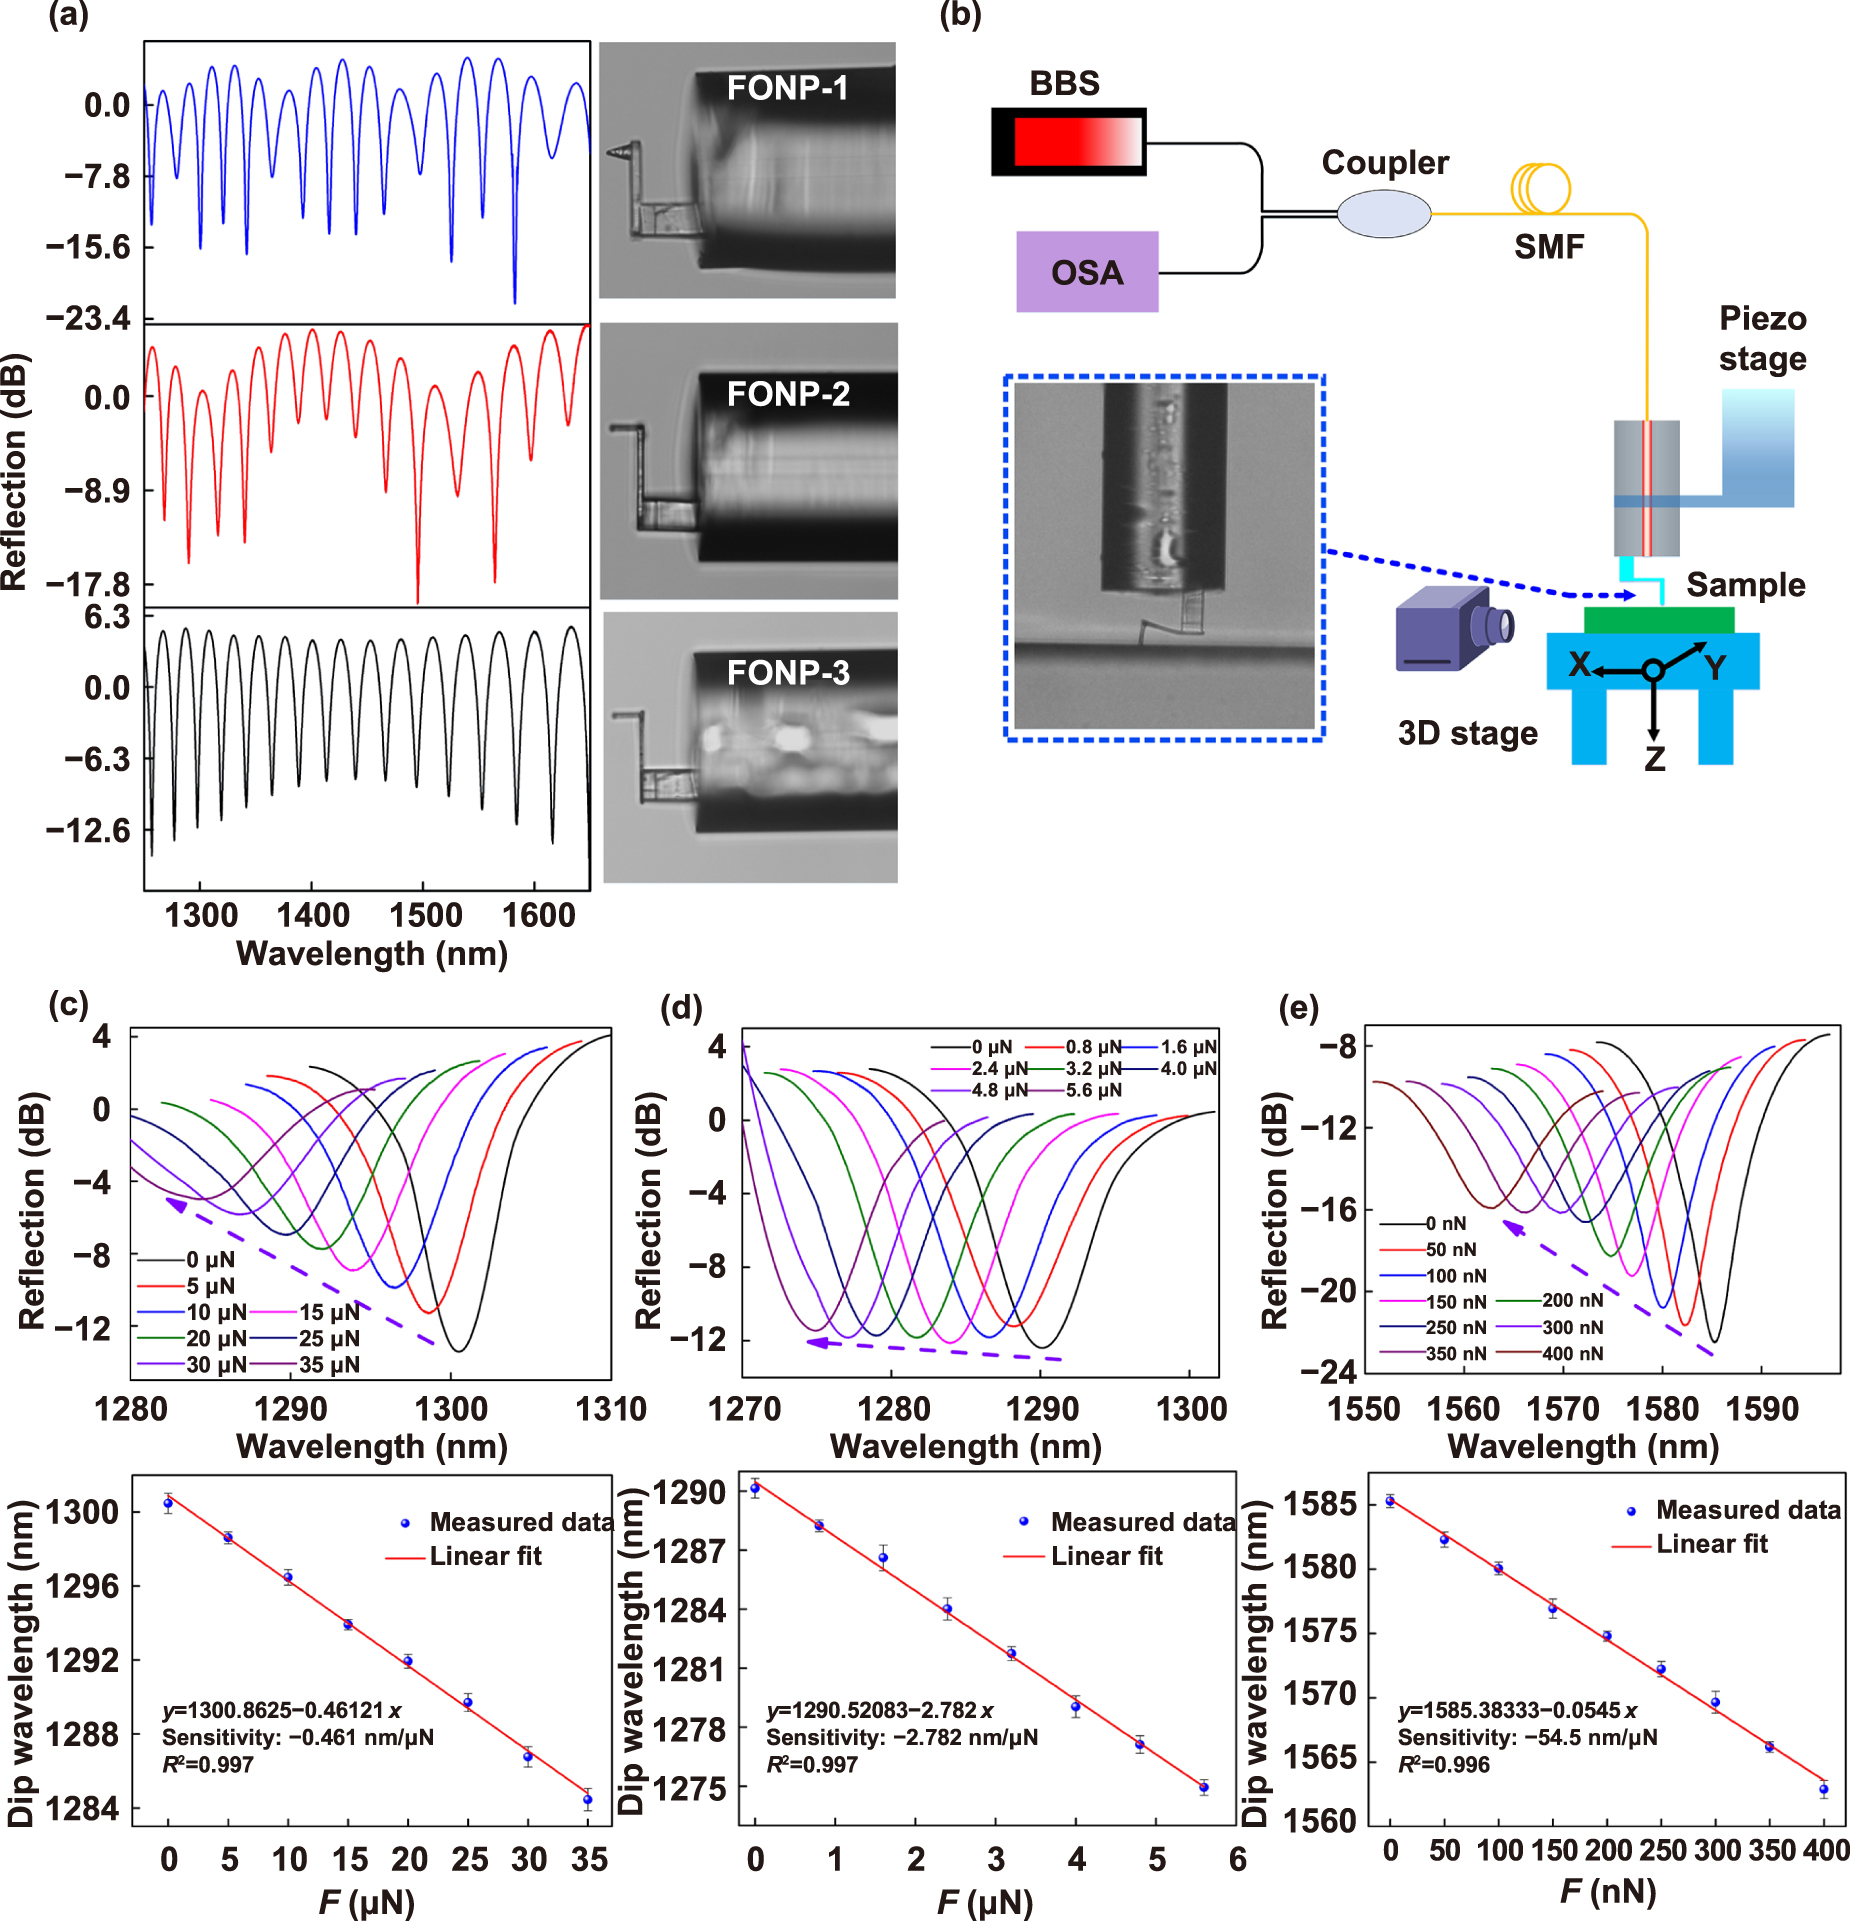
The reflection spectra of three different FONPs were measured separately using a broadband light source (BBS), a 3 dB coupler, and an optical spectrum analyzer (OSA). Figure 3(a) shows the optical microscopy images of the FONPs with different microcantilever thicknesses and their corresponding reflection spectra. Even when the microcantilever thickness was as small as approximately 1.3 μm, the FONP still had high reflectance spectral contrast (>15 dB), which is attributed to the excellent parallelism between the microcantilever and fiber end face, as well as the gold coating deposited on the microcantilever surface that increases reflectivity [49].

Figure 3. Experimental setup and microforce measurements. (a) Optical microscope images of the FONPs with different microcantilever thickness and their corresponding reflection spectra. (b) Measurement system setup. The inset shows a very stiff glass substrate indentation using FONP. The evolution of the reflection spectra of (c) FONP-1, (d) FONP-2, and (e) FONP-3 under a micro force and their corresponding dip wavelength. The line is the linear fitting of measured data points and the error bar is obtained by critically repeating the experiment of force measurement three times. The microforce sensitivity of FONP-1, FONP-2, and FONP-3 are −0.461, −2.782, and −54.5 nm μN−1, respectively.
Download figure:
Standard image High-resolution imageBefore using the FONP to measure the mechanical properties of a material, the linear relationship between the applied force and the output of FONP is quantified by demodulating the reflection spectra of the proposed sensor to obtain the microforce sensitivity. The experimental setup shown in figure 3(b) was used to characterize the sensing performance of the device and further study the mechanical properties of the target sample. The system consisted of an OSA, a BBS, a 3 dB coupler, a z-piezoelectric translation stage (Piezo stage, P-631.XCD, stroke of 80 μm, resolution of 0.1 nm, linearity error of 0.02%) for controlling the accurate movement of FONP, a 3D translation stage (3D stage) for installing fixed samples (indentation of any point of the sample can be realized), and a charge-coupled device (CCD) camera for real-time observation of the measurement process. To reduce the vibration and noise of the surrounding environment, the whole experiment setup was installed on a vibration isolation platform (Newport, S-2000 A-116). The FONP was mounted on the high-precision piezo stage for the indentation test, and its reflection spectrum was analyzed by the demodulation system comprising the BBS, OSA, and 3 dB coupler to obtain the force on the sensor during the indentation test. As shown in the inset in figure 3(b), to obtain the microforce sensing characteristics and microforce sensitivity of FONP, a very stiff glass substrate was indented using FONP. The indentation depth di of the glass substrate was considered zero, the deflection dc of the microcantilever was the displacement dp of the piezo stage, and the force [17] of FONP was obtained by F = k d c .
The piezo stage was used to drive FONP-1 ( k = 52.6 N m−1) to gradually press towards a stiff glass substrate in steps of 95.1 nm that correspond to the force change of 5 μN. The upper part of figure 3(c) shows the evolution of the reflection spectrum of FONP-1 as the force gradually increases from 0 μN to 35 μN. As marked by the arrow, a blue shift of the dip wavelength was clearly observed. The dip wavelength vs. the magnitude of the force was plotted in the lower part of figure 3(c). By using the linear fitting of the dip wavelength change, the microforce sensitivity of FONP-1 was calculated to be −0.461 nm μN−1. Similarly, the reflection plots of figure 3(d) presents the blue shift of the reflection spectrum of FONP-2 as the force gradually increases from 0 μN to 5.6 μN. A sensitivity of −2.782 nm μN−1 was obtained by a linear fit of the traced dip wavelength at each microforce in figure 3(d). To detect the cells in a liquid environment, microforce measurements were performed on FONP-3 in phosphate buffered saline (PBS). As shown in figure 3(e), the reflection spectrum of FONP-3 was steadily blue-shifted when the force was applied with a step of 50 nN, indicating that the proposed FONP can work in a liquid environment, and a microforce sensitivity of −54.5 nm μN−1 was obtained, which is 30 times greater than that of a previously reported optical fiber microforce sensor based on a polymer clamped-beam probe [27]. It is worth noting that although the reflection loss of FONP will increase when it works in liquid, its reflection spectral contrast is still high, which is crucial for the FONP to be able to measure stably in liquids as well as reduce the interference of background noise. In addition, the matching degree of the linear fitting of the three FONPs is greater than 0.996, i.e. the nonlinearity is less than 0.4%. Furthermore, at the end of the microforce test, the FONP was withdrawn from the hard glass substrate and the microcantilever quickly recovered from the bent state to its original state. The reflection spectrum also coincided with when no force was applied, indicating that the polymer structure had excellent recovery and high elasticity.
The detection limit (DL) can be used to evaluate the performance of various sensors. White and Fan defined the DL equation as DL = R/S, where R and S represent the resolution and sensitivity of the sensor, respectively [50]. For micro-force sensing, the DL describes the minimum applied force that can be accurately measured. In our experiment, the device is dominated by FWHM. For FONP-3 with the highest sensitivity, the FWHM is ∼3.05 nm. Assuming an SNR of 50 dB, the calculated DL is 2.1 nN. This ultra-small DL allows the FONP to detect weak force change. Therefore, this FONP with compact structure and high-resolution detection will become a valuable tool for minimally invasive detection, biological tissue, and intracellular research.
2.4. Mechanical property measurement
Three soft materials with different stiffness, PDMS, onion cells, and MCF-7 cells, were measured using the three fabricated FONPs, and their Young's modulus was obtained. PDMS is a widely used silicone-based organic soft material [51, 52]. PDMS is widely used in mammalian cell culture [53], flexible wearable electronics [54], microfluidic chips [55], and self-healing materials [56] because of its great biocompatibility and controllable elastic properties [52]. Characterization of the mechanical properties of PDMS samples can help to study the effect of the local stiffness of the culture matrix on cell growth and behavior [53]. To prepare the required PDMS samples, Sylgard 184 silicone elastomer base matrix and curing agent were mixed thoroughly using a 10:1 ratio, and then cured in an oven at 65 °C for 1 h to obtain a PDMS network with a thickness of 2 mm. All processing was performed in a cleanroom. The PDMS sample was fixed in a petri dish on a 3D translation stage and the PMDS was gently pressed with tweezers to remove the air between the PDMS sample and the petri dish to create full contact. Indentation experiments were performed on PDMS samples using FONP-1 with a large spring constant, as shown in the insertion diagram in figure 4(b). Figure 4(a) presents the evolution of the reflection spectrum when the piezo stage was used to drive FONP-1 to gradually indent the PDMS sample in 1 μm steps. The reflection spectrum gradually blue shifts when the displacement dp of the piezo stage gradually increases from 0 μm to 13 μm. The relationship between the piezo stage displacement dp, microcantilever deflection dc and sample indentation depth di is as follows:

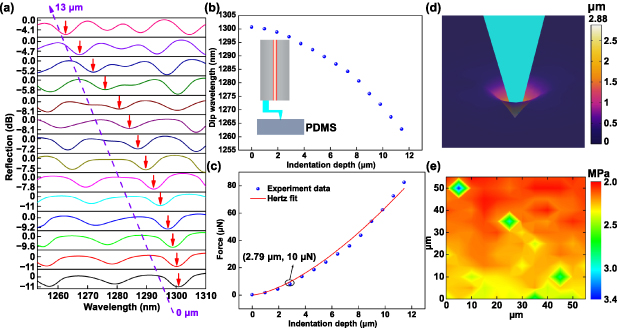
Figure 4. Indentation of PDMS with FONP-1. (a) Evolution of the reflection spectrum when PDMS was gradually indented by FONP-1. (b) Dip wavelength vs. PMDS indentation depth. The inset shows the schematic diagram of the FONP-1 indentation of PDMS. (c) The Young's modulus of the PDMS was estimated by the Hertz model fitting based on the force indentation experimental data. (d) Simulation results of the FONP-1 indentation PDMS sample based on FEM. (e) Young's modulus mechanical diagram of the PDMS thin film obtained by commercial nano-indenter transducers.
Download figure:
Standard image High-resolution imageThe piezo stage displacement dp can be obtained by the motor controller, and the microcantilever deflection dc can be calculated according to dc = F/k, where k is the spring constant of the FONP-1, i.e. k = 52.6 N m−1. F is the load applied during the indentation process, which can be calculated according to the linear fitting function between the dip wavelength (indicated by the red arrow in figure 4(a) and force applied. The curve of the dip wavelength vs. PDMS indentation depth is plotted in figure 4(b). When the indentation depth increases from 0 μm to 11.4 μm, the dip wavelength shifts approximately 38 nm toward the short wavelength. The Hertz contact model is a classical model suitable for spherical or parabolic probes [57, 58]. The classical Hertz contact model can obtain mechanical properties, e.g. Young's modulus, by analyzing the force indentation curve of the sample as in equation (3) [57]:
Here, F is the load applied during the indentation process, E and  are the Young's modulus and Poisson's ratio, respectively, of the sample to be tested, and R is the radius of the probe tip. The probe tip radius of FONP-1 was calibrated with the SEM as 0.95 μm. PDMS is a soft material with a Poisson's ratio of 0.5 [59]. Force indentation curves of the PDMS sample are presented in figure 4(c). By fitting the force indentation curve obtained from the FONP-1 indentation experiment in OriginPro 8.5, the Young's modulus of PDMS is 2.07 MPa. Our Young's modulus values were comparable to values obtained by Wang et al that ranged from 0.57 MPa to 3.7 MPa [51]. In addition, the FEM simulation model of the FONP-1 indented PDMS sample was established; the Young's modulus of the PDMS sample in the simulation was set to 2.07 MPa based on the Hertz fit. The density and Poisson's ratio of PDMS samples were set to 1030 kg m−3and 0.5 respectively [59]. The other values of the established simulation model were set to match the corresponding values used in the FONP-1 fabrication process. Figure 4(d) shows the simulated indentation distribution results. The indentation depth di induced by an external load F of 10 μN was 2.88 μm, which is consistent with the indentation depth of 2.79 μm corresponding to an external load of 10 μN in the force indentation curve (shown in the ellipse in figure 4(c)). Direct comparison of the FEM simulation and indentation experimental data provides a useful technical combination for quantitative evaluation of the mechanical properties of soft materials.
To verify the Young's modulus of the PDMS samples measured using FONP-1, an indentation test was performed on the same PDMS sample using a Hysitron Triboindenter (Hysitron, USA). The Berkovich tip (AA04111601) was used for indentation, and the nanoindenter transducer with indenter tip was carefully calibrated before the experiment. In the measurement, the PDMS sample with an area of 55 × 55 μm was selected for the indentation test. Figure 4(e) presents the Young's modulus mechanical diagram of the PDMS thin film. The overall distribution of the Young's modulus of PDMS film was relatively uniform, with an average of 2.25 MPa, except for individual points. The FONP-1 measurement was consistent with those of a commercial nanoindenter transducer, and the error was within 10%, verifying the accuracy of the FONP-1 measurements.
Similarly, FONP-2 with a spring constant of 3.99 N m−1 was used to measure onion cells that are softer than PDMS. Analyzing the micro/nano-mechanical properties of plant cells is significant for understanding cell structure and growth [60]. Onion epidermal peels are often used to study the micromechanical properties of plant cells because of its monolayer structure, small cell gap, and easy preparation [61]. To obtain a monolayer of epidermal cells, a small piece of inner epidermis was torn from the inner side of the scale leaves with tweezers. The fresh onion epidermis was fixed in a petri dish, and the part not affected by peeling was facing the FONP-2. The side view of FONP-2 indentation on onion cells is shown in figure 5(a). The center of the onion cells was chosen for indentation to reduce the error when the indentation is not perpendicular to the surface. A top view of the onion cells is shown in figure 5(b). Irregular long strips of onion cells were closely arranged on the epidermis and the cells were in a turgid state filling with cell sap. Similar to the indentation process of PDMS, figure 5(c) presents the variation curve of the dip wavelength and force with indentation depth during the indentation process of the onion cells. The maximum force applied to onion cells was approximately 13 μN and the maximum indentation depth was approximately 6 μm. The radius of the cylindrical probe tip of FONP-2 was 1.71 μm, and the Young's modulus of the onion cells was 599.4 kPa, as obtained by Hertz fitting of the force indentation curve. This onion cell Young's modulus is comparable to that reported by Maghsoudy-Louyeh [62].

Figure 5. Indentation of single onion cells and MCF-7 cells with FONP-2 and FONP-3. (a) Side view of the FONP-2 indentation onion cells. (b) Top view of the onion tissue under an optical microscope. (c) Variation of the dip wavelength and corresponding force with indentation depth during indentation of the onion cells. The blue dotted line represents the experiment data, and the red line represents the Hertz fit curve. (d) Schematic diagram of the FONP-3 indentation MCF-7 cells. (e) Fluorescence microscopy image of MCF-7 cells after incubation with DAPI. (f) Variation curve of the dip wavelength and corresponding force with indentation depth during indentation of MCF-7 cells.
Download figure:
Standard image High-resolution imageChanges in cell morphology, surface roughness, and mechanical properties will affect cell properties or tissue functions, and may cause disease. Alternatively, diseases can also cause changes in the cell structure and mechanical properties. Therefore, the biomechanical properties of cells can be used as an indicator of disease progression and early cancer diagnosis [38, 63, 64]. Characterization of breast cancer cell mechanics will help to understand the underlying molecular events that lead to tumor proliferation and reveal potential sources of label-free markers of cancer progression. The mechanical properties of MCF-7 cells were tested by FONP-3 with the smallest spring constant (0.421 N m−1). After MCF-7 cells in the petri dish were cultured to 80% confluence, the culture medium in the petri dish was carefully removed and replaced with PBS cell buffer, and then the adherent cells were subjected to indentation test with FONP-3, as shown in figure 5(d), each sample was repeatedly measured three times. Before the indentation test, the in vitro fluorescence microscope images of MCF-7 cells were obtained with a fluorescence microscope, as shown in figure 5(e). Fluorescence microscopy showed that most of the cancer cells grew individually, with spindle shape, stable adhesion, and the nucleus (blue) is morphologically intact and clearly stained. Figure 5(f) presents the representative evolution of dip wavelength and corresponding force with indentation depth. When the maximum indentation depth of MCF-7 cells was 9.1 μm, the corresponding force was only 212 nN. Similar to the Hertz fitting process, the Young's modulus of the MCF-7 cells was calculated to be ∼5.7 ± 0.15 kPa, which is consistent with the values reported in literature [65]. It is worth noting that compared to silicon-based micro-cantilever probes used in commercial AFM, the use of 3D-printed polymer probes with small hardness and large diameter will reduce mechanical damage to cell membranes during indentation testing, allowing measurements to be completed while maintaining the original activity of the cells [20].
2.5. In vivo measurement of muscle tissue
To confirm the substantial progress and superiority of this portable FONP in vivo measurement compared to commercial AFMs, the Young's modulus of brain muscle tissue of the living mouse was directly measured by FONP-1. The biomechanical properties of muscle tissue are crucial to the motion, strength or deformation of the body. Furthermore, mechanical properties such as Young's modulus provide insights for both tissue activity regulation and functional biological materials design. However, up to date, the critical biomechanical properties of tissues such as muscle are basically determined by in vitro measurement. For example, most biological tissue samples need to be prepared such as sectioned before they can be measured by AFM. An in vivo brain muscle tissue indentation test model for BALB/c mouse was developed as shown in figure 6(a). Approval was obtained from the ethic committee of the investigator's institution (Approval No. AEWC-202200011). Under anesthesia, a six-week-old female mouse was tested on a special fixture. The skin of the mouse head was cut open to expose the muscles, and the surrounding of the mouse head was fixed with a steel ring. FONP-1 was then used to perform indentation tests on the muscle tissue of the mouse head in the in vivo state.

Figure 6. In vivo experiments performed on the mouse muscle with FONP-1. (a) Schematic diagram of the experimental setup for indentation of muscle tissue in mouse brain. (b) Typical force indentation curves of mouse brain muscle tissue measured in vivo and in vitro. The green and blue dotted lines represent the experimental data, and the red and black lines represent the Hertz fit curves. (c) Comparison between the Young's modulus in vivo and vitro. In the inset shows indentation experiments performed on different locations of muscle tissue in the brain of mice. Six different locations of the muscle tissue of the mouse brain were selected for the indentation test, and each location was strictly repeated for three measurements. Averaged Young's modulus in vivo (7.98 ± 1.24 MPa) and in vitro (15.01 ± 2.76 MPa).
Download figure:
Standard image High-resolution image
A critical issue concerning the nano-biomechanical properties is how much difference exists between in vivo and in vitro tissues. To investigate this issue, in vitro measurements of mouse brain muscle were performed using FONP-1 as well, and the results were compared to those in vivo measurements. Typical force-indentation curves for in vivo and in vitro measurements of mouse brain muscles were plotted in figure 6(b). It is clear that, for the same indentation depth, the force on FONP-1 is greater when measured in vitro, indication that the mouse brain muscles measured in vitro is harder. As shown in figure 6(c), the indentation test was carried out at multiple locations of the muscle tissue of the mouse head. The Young's modulus measured in vivo ranged from 5.82 to 9.42 MPa, with an average of 7.98 ± 1.24 MPa. The Young's modulus measured in vitro ranged from 12.56 to 19.77 MPa, with an average of 15.01 ± 2.76 MPa. The results showed that the nano-biomechanical environment within the same tissue inconsistent in different parts of the muscle, and there can be an almost twofold difference in the measurement results. There will be a certain deviation between the artificially designed functional biological materials with isotropic mechanical properties and the real biological materials. More interestingly, since the indentation size of FONP-1 is smaller than that of a single cell, the uneven mechanical properties of muscle tissue may be caused by the change of Young's modulus of muscle cells at different locations. In addition, the Young's modulus of brain muscle measured in living mice is significantly lower than that measured in vitro, which indicates that there is a significant difference in tissue biomechanical properties measured in vivo and in vitro. In most normal tissues, the nano-biomechanical environment that cells sense and respond to does not present a single stiffness, but remains diversified in different locations or under different conditions in vivo and in vitro, and changes with muscle contraction and relaxation [66]. Micro physiological circulation in living tissues, such as interstitial flow, may also lead to dynamic changes in biomechanical properties of tissues. In addition, extracellular matrix plays an important role in controlling cell fate. In vivo tissues, the encapsulated cells tend to grow into 3D structures with a certain height due to the space limitation of the surrounding substrates environment. There are complex interactions between cells, which may cause the tissue cells in vivo to show different biomechanical properties from cells in vitro [67]. To our knowledge, this represents the first in vivo measurement of the biomechanical properties of muscle tissue in living vertebrate brain. This information is of great significance for the design of functional materials closer to the real biological mechanical environment and also for the treatment of musculoskeletal system diseases such as myasthenia.
3. Conclusions
In summary, we propose a strategy for miniature FONPs with tunable stiffness that use structure-correlated mechanics to tailor microcantilever probes with desired stiffness on a fiber tip using TPP nanolithography. Based on this strategy, the stiffness mismatch between the sample to be measured and FONP is solved, and the accurate measurement of mechanical properties of soft biomaterials, such as living tissue and cells, is realized. As a validation of the strategy, three FONPs with spring constants of 52.6 N m−1, 3.99 N m−1, and 0.421 N m−1 were prepared based on the finite element analysis of the stiffness properties, and linear force responses were obtained with the corresponding microforce sensitivity spanning two orders of magnitude from 0.461 nm μN−1 to 54.5 nm μN−1. The force detection limit reached 2.1 nN, comparable to that of commercial AFM, and the Young's modulus of PDMS, onion cells, and MCF-7 cells were successfully measured, which validated this strategy. To our knowledge, this is the first report of in situ nanoindentation mechanics testing of a single cell using a miniature all-fiber microforce sensor, and this FONP is easy to use in air and in liquid. In addition, this study has developed a new method applicable to in vivo biomechanical property measurements, and this method has no special requirements for the size and shape of living biological samples, which is infeasible when using commercial AFM measurement methods. More critically, the in vitro measurement methods can only monitor a static state without taking into account the effects of cell metabolism in vivo, micro physiological circulation of living tissue and other activities on biomechanical properties. It highlights the unparalleled advantage that FONP can measure the dynamic changes of nanomechanical in vivo in real time. All these indicate that FONP has made substantial progress in realizing basic biological discoveries.
4. Experimental section
4.1. Fabrication of the FONPs
The fabrication of the FONPs by femtosecond laser TPP nanolithography is divided into four steps. First, the end face of the standard SMF (Corning SMF-28) is cleaved with a fiber optical cleaver and placed horizontally on a glass slide. A drop of photoresist containing photo-initiator (IGR-369) and monomers (SR454 and SR368) are dropped on the end face of the standard SMF. The femtosecond laser is then focused at the photoresist on the end face of the fiber optical through an oil immersed objective (Zeiss, 63x, NA = 1.40). The femtosecond laser (a center wavelength of 1026 nm) power measured in front of the objective was 1.4 mW. The microcantilever structure was programmed on the end face of the SMF according to the pre-designed scanning path. The step length in the laser scanning process was chosen as 50, 100, or 200 nm according to the different parts. The scanning method was adopted from the side of the fiber optical to avoid the bending deformation of the microcantilever under the gravity of the photoresist droplets during vertical fabrication, and the scanning speed was 0.8 mm s−1. A mixture of isopropanol and acetone (4:1) was then dropped on the fiber tip to dissolve the unexposed photoresist. Finally, a 20 nm thick gold film was coated on the upper surface of the microcantilever using a magnetron sputtering coating instrument (40 mA, 300 V, 12 W).
4.2. Characteristics
SEM images were taken at 5 kV (Phenom Pro). The optical microscope images were obtained using a Leica Microsystems microscope (DM 27000 M RL/TL). The fluorescence images of MCF-7 cells were obtained with a fluorescence microscope (BX51, OLYMPUS, Japan). After washed with PBS, the cultured cells were fixed in 4% formaldehyde (Sigma, USA) for 10 min. Subsequently, the fixed cells were treated with 4ʹ, 6-diamidino-2-phenylindole (DAPI, Sigma, USA) for 10 min to counterstain nuclear in dark conditions. To image the nuclear, filter for the inverted microscope was set for DAPI (excitation at 405 nm and the emission was collected with a 450/50 nm band pass filter).
4.3. Cell culture
The MCF-7 human breast cancer cells (HTB-22, American Type Culture Collection) were cultured in Dulbecco's Modified Eagle's Medium (Gibco, USA), containing 10% fetal bovine serum (FBS, Gibco, USA), 100 units ml−1 penicillin and streptomycin (FBS, Gibco, USA). The cells were incubated at 37 °C in a humidified atmosphere with 5% CO2.
4.4. In vivo assay
All the animal procedures complied with the guidelines of the investigator's institution Animal Care and Use Committee. Female BALB/c nude mice aged 6 weeks (16–20 g) were supplied by Guangdong Medical Laboratory Animal Center and kept under specific pathogen-free conditions with free access to standard food and water. The mice were grown normally for more than 7 d before the experimentation. According to requirements for Biosafety and Animal Ethics, all efforts were made to minimize the number of animals used and their suffering. A gaseous anesthesia system (Matrx VIP 3000, Midmark) was used to anaesthetize mice. To keep the body temperature of the mice at about 38 °C, a heating blanket was used and set to 38 °C.
4.5. Numerical simulation
The structural mechanics simulation analysis of the microcantilever probe was conducted in COMSOL Multiphysics 5.5. The stiffness characteristics and indentation process of FONPs were simulated using the structural mechanics field of COMSOL Multiphysics 5.5, and its stiffness characteristics were obtained according to the relationship between force and displacement.
Acknowledgments
This study was supported by the National Natural Science Foundation of China (NSFC) (62122057, 62075136, 62175165); Natural Science Foundation of Guangdong Province (2022B1515120061, 2019B1515120042); Science and Technology Innovation Commission of Shenzhen (RCYX20200714114524139, JCYJ20200109114001806).
Conflict of interest
The authors declare no conflicts of interest.