
Abstract
The periodic undulation of a molten track's height profile in laser-based powder bed fusion of metals (PBF-LB/M) is a commonly observed phenomena that can cause defects and building failure during the manufacturing process. However a quantitative analysis of such instabilities has not been fully established and so here we used Rayleigh–Plateau theory to determine the stability of a single molten track in PBF-LB/M and tested it with various processing conditions by changing laser power and beam shape. The analysis discovered that normalized enthalpy, which relates to energy input density, determines whether a molten track is initially unstable and if so, the growth rate for the instability. Additionally, whether the growth rate ultimately yields significant undulation depends on the melt duration, estimated by dwell time in our experiment.
Export citation and abstract BibTeX RIS

Original content from this work may be used under the terms of the Creative Commons Attribution 3.0 license. Any further distribution of this work must maintain attribution to the author(s) and the title of the work, journal citation and DOI.
1. Introduction
Laser-based powder bed fusion of metals (PBF-LB/M), an additive manufacturing technique, has been widely used in aerospace, automotive, and many other industries due to its ability to easily manufacture products. In the conventional PBF-LB/M process, a small Gaussian laser beam (<100 μm in diameter) is used to melt a thin layer of powder. Sufficient energy is delivered so that the molten pool extends to previously fused material or the substrate beneath. By repeating this process in a layer-by-layer fashion, a 3D part is produced. The laser scanning speed—and hence the overall productivity of PBF-LB/M—is limited by several defects arising at higher speeds, including the humping or balling phenomenon, a periodic undulation of molten tracks.
Such periodic undulation had been documented in laser-based manufacturing processes before. Bradstreet first reported the formation and geometry of periodic weld beads in laser welding [1]. Gratzke et al proposed to use the Rayleigh–Plateau instability of a liquid jet to explain this phenomenon [2]. Subsequent research in laser welding discovered that flow inside the molten pool contributes to the undulation [3]. Numerical simulations were also developed to estimate processing conditions where such undulation arises [4–6]. Generally speaking, periodic undulation exists at a high laser welding speed, where an elongated molten pool is more susceptible to capillary instability.
Recently, humping was observed in the PBF-LB/M process as well [7, 8]. Besides at a high laser scanning speed [9], the undulation emerges under other processing conditions, including those with small laser beam powers [10] and modified, non-Gaussian laser beams [11, 12]. The undulation can be amplified by repeated powder deposition and scanning in the printing process, and it has been correlated with defects in PBF, including cracks, high surface roughness, and sometimes complete building failures. It is believed that poor wettability and the resulting large contact angle between the molten track and the substrate contributed to the undulation [13, 14].
However, while previous studies focused on the critical condition where periodic undulation arises during welding and PBF-LB/M, they overlook how geometric properties (such as wavelength and amplitude) of the undulation in the molten track can be associated with—and potentially be controlled by—processing conditions. Therefore, in this work, we used a self-built dual-laser system to further investigate the undulation with an expanded parameter space; two laser beams that overlap or operate in close proximity are effectively used as a single beam whose shape is adjustable. We examined a modified, quasi-one-dimensional (1D) Rayleigh–Plateau instability model in PBF-LB/M and found that the wavelength and perturbation growth rate of an unstable molten track can be described by the dispersion relation. A parameter, the normalized enthalpy, which relates to the input energy density, presents data points acquired under different processing conditions in the same context and links the processing conditions to the instability criteria. A smaller normalized enthalpy generally leads to a larger contact angle between the molten track and the substrate, therefore resulting in an unstable initial state. Furthermore, we show that in our configuration, the dwell time together with the perturbation growth rate from the dispersion relation determines whether a perturbation can grow significantly should the molten track start from an unstable initial state.
2. Experimental methods
Experiments were carried out in a dual-laser PBF-LB/M system developed in-house. The detailed description can be found in previous literature [15]. In these experiments, two identical laser beams with powers  at 40, 60, 80, and 100 W were used. Scan speed was held constant at 150 mm s−1. The nominal
  diameter,
  , of the laser beam was 100 μm. A 100 μm thick layer of 316L stainless steel powder with diameter <44 μm was deposited with a doctor blade on a 316L substrate.
Figure 1 illustrates the methods and observations in this experiment. Two molten pools, as shown in orange in figure 1(a), were created by two laser beams whose scan paths converged onto the same 4.5 mm long main line, resulting in a single molten track. Short ramps measuring 1.27 mm in length and angled 11 from the main line were included to avoid sudden start or stop of the molten track, which may introduce uncertainties to the track formation. On the main line, the two laser spots were separated by a spatial offset
  , which is controlled by the scan speed
  and the temporal offsets between the firing of two lasers
  , as
, as  . A set of experiments with single lasers were included for reference. The length of a molten pool is between 150 and 300 μm for a single laser beam with a power between 40 and 100 W at 150 mm s−1 scan speed.

Figure 1. Overview of experimental methods, with (a) position of molten pools and tracks created during the experiments, (b) and (c) illustrations of molten tracks with small contact angles and low amplitudes, with the red lines representing the molten pool boundary, (d) confocal image of such a molten track, (e) and (f) illustrations of molten tracks with large contact angles and high amplitudes, (g) confocal image of such a molten track, and (h) height profile extracted from confocal measurement for the molten track shown in (g). Wavelength  and amplitude
  are defined as shown in image (h). Molten pools in (a) are not to scale.
Download figure:
Standard image High-resolution imageFigures 1(b)–(g) describe two scenarios of molten tracks in our experiments. Figures 1(b)–(d) depict the result where the molten track made a small contact angle (<90 ) with the substrate and undulated with relatively small amplitude. Figure 1(b) illustrates the condition where the powder particles were first melted and the track had not solidified yet, while figure 1(c) is where the track was fully solidified and bonded to the substrate. Figure 1(d) is a confocal image of a molten track with such condition. On the other hand, figures 1(e) and (f) represent the beginning and end of a molten track solidification where the contact angle between the track and the substrate is large (>90
 ). The resulting molten track undulated with a large amplitude, as shown in the schematic figure (figure 1(f)) and confocal image (figure 1(g)). Figure 1(h) is the height profile from confocal image (figure 1(g)), with amplitude
  and wavelength
  defined. Among these geometric parameters, amplitude
  is the most important as it directly represents the significance of the undulation. Besides that, a higher energy input leads to longer contact length
  and generally, smaller contact angle
  , which are important to the initial stability of the molten track as described below in section 3.2.
After each experiment, a confocal image of each molten track was taken. Height profiles from confocal images were used to calculate the wavelength  and amplitude
  for each molten track. After being cut, polished, and etched, cross-sections of each sample were imaged using an optical microscope to determine the molten pool depth and contact length between the track and the substrate, as shown in figure 2. Contact length
  and molten pool depth
  are measured for each molten track, while bead height
  and contact angle
  from the cross-section images are not recorded because these variables change along an unstable molten track and results from a single slice are not representative. Instead, height profile
  is collected from the confocal image and contact angle
  is calculated as described in section 3.2. Results on the molten pool depth
  are not presented in this project as previous literature has covered it well [16].
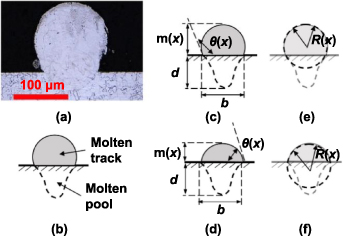
Figure 2. Cross-section of the molten tracks, with (a) optical image of a cross-section after polishing and etching, and (b) the schematic diagram for the molten track and molten pool. Variables such as molten track height  , molten pool depth
  , contact angle
  , constant contact length
  are shown in (c) and (d), while (c) is the schematic of unstable track with
  , and (d) stable track with
  .
.  is the radius of the approximated segmented circle for the molten track, as shown in (e) and (f). Gray areas in (c) and (d) represent the cross-section area
  in equation (4).
Download figure:
Standard image High-resolution image3. Results and discussions
3.1. Wavelength and amplitude at various laser powers and spatial offsets
Figure 3 shows the wavelength and amplitude at various spatial offsets and laser powers. Values for power in the plot refer to the power of a single laser. The standard deviation is represented using shaded bands to enhance clarity.
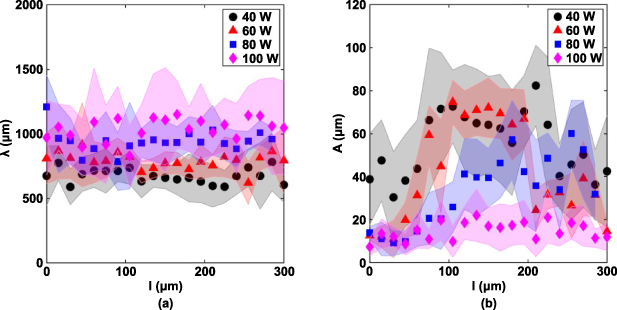
Figure 3. (a) Wavelength and (b) amplitude of the undulations at various spatial offsets and laser powers. Shaded area represents the standard deviation. Power values in the legend each refer to the output of a single laser.
 on the x-axis is the spatial offset between the two laser spots, as shown in figure 1(a).
Download figure:
Standard image High-resolution imageFrom figure 3(a), we notice that wavelength does not change significantly with spatial offset  at a constant laser power. For example, wavelength remains constant between 600 and 700 μm for 40 W power inputs, even though the spatial offset increases from 0 to 300 μm. At the same time, wavelength increases from around 600 μm to around 1100 μm as laser power increases from 40 W to 100 W. This can be explained by approximating the molten track as a free-standing cylinder with radius
  . The wavelength must exceed the circumference of the cylinder, i.e.

so that instability commences and perturbation begins to grow [17]. A higher-powered laser beam creates a molten track with larger radius and consequently greater circumference. Therefore, it is expected that wavelength increases with higher laser power.
More interestingly, the amplitudes vary significantly with varying spatial offsets, as shown in figure 3(b). The amplitude increases at specific spatial offsets  for 40 and 60 W laser power, and between
  for 80 W laser power. At the same time, the amplitude is nearly constant for 100 W laser power. Here, we consider these molten tracks with low amplitudes (or more precisely, low ratio between amplitude and wavelength,
  as explained in section 3.2) as stable ones. Roughly speaking, unstable molten tracks exist because when the spatial offset increases from 0 to ∼150 μm, the energy density decreases as the effective shape of the combined beam becomes elongated. Consequently, a shorter contact length between the molten track and the substrate is created. The larger contact angle that results from this leads to larger undulations. The detailed explanation is provided in the next section. As the two spots are further separated (
 becomes larger than 200 μm), the two molten pools cease to remain connected. In such a case, the amplitude drops as the melting process is no longer different from using one laser beam to scan a single line twice, as the lagging beam can remelt and smoothen the molten track.
3.2. Stability analysis with Rayleigh–Plateau theory
To further probe this instability, we turned toward the Rayleigh–Plateau instability of a liquid jet with infinite length. In specific, we consider the molten track as a liquid bead suspended on a flat surface, similar to some previous fluids models [18–20]. In such case, the original cylindrical system is modified with a quasi-1D model for a cylinder segmented on a flat surface. The equations for motion and mass conservation are:
and
where  is the molten track's cross-sectional area as shown in figure 2,
  the flow velocity,
  time,
time,  the material density, and
  the pressure inside of the molten track.
To approximate the cross-sectional area of a molten track, we treat the cross-section as a circular segment. A geometrical analysis gives
where  is the bead height from confocal measurement as sketched in figure 2, and
  is the contact angle calculated using the equation

where  is the radius of the circular segment modeled from the cross-section, and
  is the contact length. Illustrations for variables
  ,
,  , and
, and  are shown in figure 2. For each molten track, we assume the contact length
  is constant, as suggested in literature [21].
With  collected from confocal measurement,
  can be calculated using
  and
and  is then integrated and averaged over a period of length
  to find the mean cross-sectional area
  for each molten track, as shown below
Therefore, we can estimate the original, unperturbed shape of the circular segment, which translates to the melting volume (when  is integrated over track length).
Then the capillary pressure at position  can be written as

where  is the surface tension,
  computed from equation (5), and
  is the average value of the longitudinal curvature of the molten track. The longitudinal curvature can be further simplified as shown below, according to Schiaffino [22]

where  is the curvature of the surface over the centerline.
  is a coefficient that accounts for the difference between the longitudinal curvature over the centerline and the average longitudinal curvature, as suggested from literature [20, 22]. Based on literature [20, 22],
  is between 0.65 and 0.56 when
  , which is the range of the contact angle in our work.
Now with the bead's height along the  -axis and over time
  approximated as

where  is the unperturbed height,
  the initial perturbation,
  is the wave number,
  is the growth rate of the perturbation, and
  at
at  solidification time is equivalent to the measured height profile
  . The unperturbed height is the height of a homogeneous molten track before the instability grows (height of the uniform bead with cross-section area
  ). The initial state of a molten track is shown in figures 1(b) and (e).
Then the dispersion relation is shown below, using equations (2), (3), (5) and (7) after substituting equations (8) and (9):
as detailed derivation can be found in the previous literature [22]. Here,  describes the contact angle of a homogeneous molten track at the unperturbed state with a cross-section area of
  . Thus,
  is constant for each molten track. This is in contrast to
  , the contact angle of the solidified molten track as shown in figure 2, which is a function of
  and can be calculated based on height profile
  and contact length
  . On the other hand,
  is calculated from the geometry relations in equation (5) after
  is determined.
For the molten track to be unstable,  must be real. This condition, applied to equation (10), gives

which suggests that the instability can only arise at a large contact angle when  .
.
From the dispersion relationship in equation (10), one can also find the most rapidly growing wave number  with the corresponding growth rate
  , as shown below [20]:
Figure 4 plots the stable and unstable regions based on equations (11) and (12).  , the unperturbed bead height can be calculated from the averaged cross-sectional area
  and fixed contact length
  based on geometry correlations. Empty data points represent unstable molten tracks while filled ones for the stable tracks. In this work, a molten track is deemed stable if
  . This threshold is chosen to best distinguish stable molten tracks upon visual inspection of all confocal images. Afterwards, data points are grouped based on their stability and the processing conditions in figure 3. Data points of Gaussian represent the experiments with a single Gaussian beam at various laser powers. An unstable region exists in figure 3 because for contact angle
  , the internal pressure moves liquid from lower
  to higher
  , thus growing the perturbation.

Figure 4. Stability map for molten tracks at different processing conditions. The empty data points represent unstable molten tracks and filled ones for stable tracks. The stability boundary is derived from equation (11) and fastest-growth wavelength from equation (12).
Download figure:
Standard image High-resolution imageWe notice that the results from molten tracks mostly follow the stability analysis in figure 4, suggesting a good alignment between the Rayleigh–Plateau instability theory and our experimental results. For example, many molten tracks produced by 100 W laser power remain in the stable regime, aligning with the observation from figure 3 in which 100 W laser produces tracks with long wavelength but small amplitude. One may find that the stable data points (filled points) in figure 4 still carry finite wavelengths, while unperturbed molten tracks should have infinite wavelength and  . This is because small ripples are difficult to avoid in PBF/LB-M and these molten tracks with small ripples are deemed stable based on our stability threshold. In summary, we think the trend between
  and
and  follows the dispersion relation from linear stability analysis nicely.
From analysis above, we notice that the contact angle  is vital in determining the stability of the molten track: a contact angle greater than
  introduces growing perturbations. To correlate the contact angle to the processing parameters, we first normalize energy input with enthalpy at melting,
  , similarly to previous literature [16, 23] to present all data from this work in the same context. In this case,
  , where
  is the specific heat capacity and
  the melting temperature. We approximate the combined laser beam in this experiment as an elliptical beam, with a semi-major axis length
  and a semi-minor axis length
  , similarly to our previous work [24]. With a dwell time
  proportional to the length of the major axis of the combined elliptical beam, the laser energy absorbed is
  , where
  is the absorptivity, and
  is the total laser power input. This energy is distributed in a volume of
 ![$\pi \left( {\sigma /2} \right)\left[ {\left( {\sigma + l} \right)/2} \right]\sqrt {D\tau } $](https://content.cld.iop.org/journals/2631-7990/4/1/015201/revision2/ijemac466dieqn115.gif) , where
, where  is thermal diffusivity. This gives an energy density of
 ![${A_{\text{b}}}P\tau {\left\{ {\pi \left( {\sigma /2} \right)\left[ {\left( {\sigma + l} \right)/2} \right]\sqrt {D\tau } } \right\}^{ - 1}}$](https://content.cld.iop.org/journals/2631-7990/4/1/015201/revision2/ijemac466dieqn117.gif) . Normalizing the energy density by the melting enthalpy and following the same modification as in previous literature [16, 25], we have the normalized enthalpy
. Normalizing the energy density by the melting enthalpy and following the same modification as in previous literature [16, 25], we have the normalized enthalpy  as
as
where

and
.
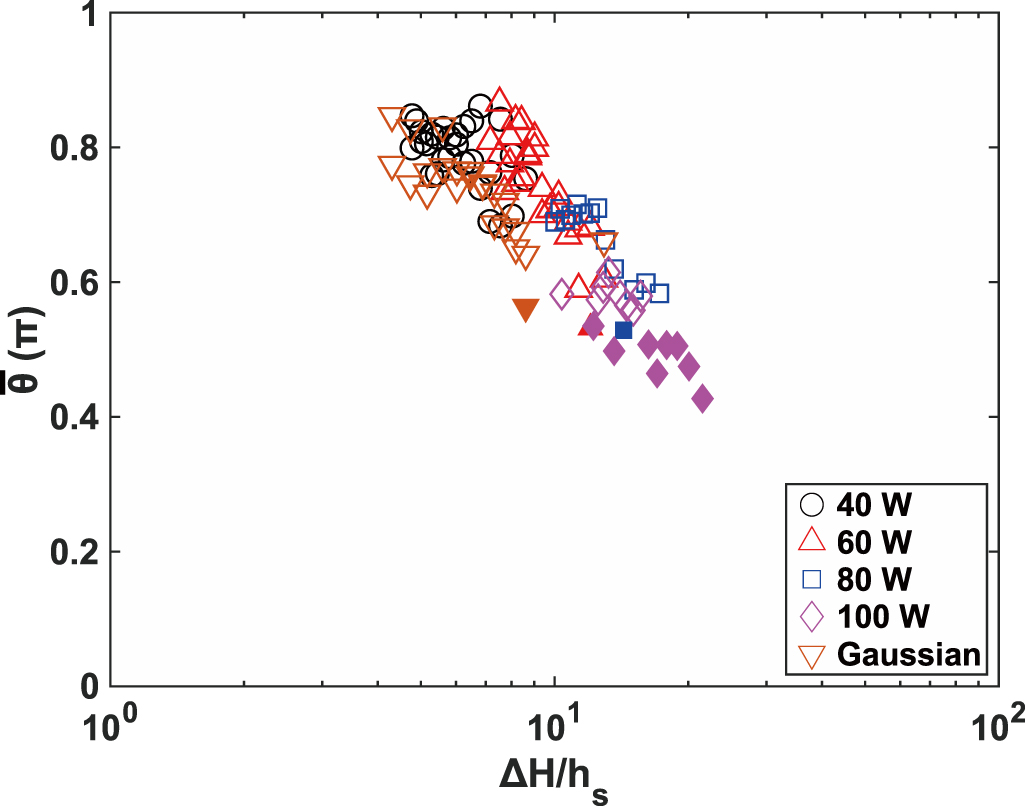
Figure 5 plots the averaged contact angle  against normalized enthalpy, which describes the amount of energy density above that required to melt the material. It is clear that, as data points from various laser powers and beam shapes collapse into the same trend, contact angle decreases with increasing normalized enthalpy. Therefore, we observe more instability in lower laser power experiments as shown in figure 3, because lower laser power and consequently lower normalized enthalpy tend to create greater contact angles and introduce growing perturbations to a molten track, with the reasoning provided below.

Figure 5. Contact angle  between molten track and substrate vs normalized enthalpy. The filled data points represent stable molten tracks and empty ones for unstable tracks.
Download figure:
Standard image High-resolution imageFrom figure 2 and geometry correlations, contact angle between the molten track and the substrate clearly depend on (a) the contact length between the liquid bead and the substrate, and (b) the volume of liquid accrued on the substrate (gray area in figure 2). A small contact length together with a large volume of liquid accrued is more likely to yield a large contact angle and therefore a strong instability and undulation with a higher amplitude. First, we discover that contact line length increases continuously with increasing normalized enthalpy (see supplementary materials figure S1 available online at stacks.iop.org/IJEM/4/015201/mmedia). At the same time, experimental data reveal that while changing beam shape can impact the liquid accrued when the laser power is constant, the volume of liquid accrued will reach a plateau with increasing power and normalized enthalpy (see supplementary materials figure S2) because only a finite volume of powder is deposited and available for melting. Therefore, a higher normalized enthalpy cannot continuously increase the melting volume of a molten track, but it can continuously increase the contact length between the molten track and the substrate. Thus, contact angle decreases with increasing energy input and introduces less amplitude growth.
3.3. Amplitude dependency on perturbation growth
With the stability criteria established in the previous sections, we now turn to the understanding of the correlation between the Rayleigh–Plateau instability and the resulting amplitude of the undulations. Theory only predicts a growth rate for the perturbations, and the molten track can ultimately break into small droplets to minimize its surface energy should the growth time be infinite. However, molten tracks solidify within a finite period of time in our PBF-LB/M experiment, preventing the perturbations from further growing. Thus, in additional to the perturbation growth rate from the dispersion relation, we need a time scale to represent the solidification time for a more comprehensive understanding towards the amplitude of the undulations.
Figure 6 plots the fastest growth rate for perturbations versus normalized enthalpy. Only tracks deemed unstable are plotted as stable tracks do not have  . We calculate the fastest growth rate
  from equations (5) and (13). Generally speaking,
  decreases with increasing normalized enthalpy. In particular, the growth rate drops rapidly for
  , a domain inhabited primarily by data points from the 100 W laser power experiments. Such domain corresponds to the small oscillations which generates small undulations in figure 3. As we discussed earlier, these molten tracks receive high energy input so their molten pools can extend deeply into the substrate, resulting in large contact length, small contact angle, and slower perturbation growth. Conversely, decreased normalized enthalpy leads to shortened contact length, enlarged contact angle, and accelerated perturbation growth.
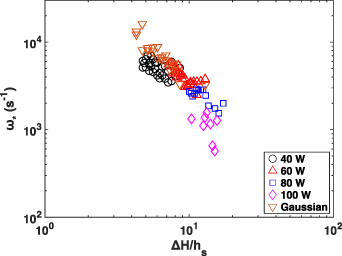
Figure 6. Fastest growth rate  vs the normalized enthalpy. Only unstable data are plotted as
  for stable tracks does not exist.
Download figure:
Standard image High-resolution imageFigure 7 plots the ratio between amplitude  and wavelength
  versus the perturbation growth, a dimensionless number obtained by multiplying growth rate
  and a time scale, chosen to be the dwell time
  from equation (16). Figure 7 shows that there exists a clear threshold value for
  near unity, below which the amplitude of the undulation remains low at around 0.015 of the wavelength
  . Once
  exceeds the threshold, the ratio between amplitude and wavelength grows rapidly with increasing
  . The greatest
  ratios are seen at lower laser powers, where the growth rate
  is very large compared to those at higher laser powers, allowing the undulation to grow to a greater amplitude before solidification. As
  and
and  at small
  , a faster growth rate together with a longer melting duration from a longer dwell time can lead to rapid growth of amplitude.

Figure 7. The ratio between amplitude  and wavelength
  vs the fastest growth rate
  times dwell time
  . Only unstable data are plotted as
  for stable tracks does not exist. Dash line represents the empirical
  threshold.
Download figure:
Standard image High-resolution image
Here, we recognize that dwell time cannot precisely represent the time scale, as dwell time is only affected by the spatial offset  , with speed
  being constant in our experiment. In reality, higher laser powers should create longer molten pools (the length of a liquid bead along the x-axis) for constant
  and
and  . A solidification time, calculated from observed molten pool length divided by laser scan speed, can be a more accurate time scale, but it is more difficult to measure. Nonetheless, scaling with
  still does well to collapse datasets from various laser powers and different beam shapes into a single pattern in figure 7.
4. Conclusions
In this work, molten tracks with various wavelengths and amplitudes were produced using PBF-LB/M with laser beams at different powers and shapes. While wavelengths remain relatively unaffected by different beam shapes, i.e. at different spatial offsets, the amplitudes vary significantly with the beam shape and laser power. Using a geometric idealization and the Rayleigh–Plateau instability model, we provided a simple explanation and scaling approach for the undulations observed in PBF-LB/M. Even with strong fluid motion associated with this process, especially in the molten pool, the stability of the molten track and the resulting amplitude can be explained and estimated with the fluid model.
Specifically, we found that the contact angle alone between the molten track and the substrate determines the stability of the track, and if unstable, the wavelength and amplitude growth rate is predicted by the dispersion correlation. The contact angle itself is determined by the contact length and liquid accrued, both correlated with the normalized enthalpy. The amplitude is shown to correlate with both the growth rate  and dwell time
  :
:  has to reach a certain threshold, unity in our case, for the amplitude to become significant, after which the amplitude grows with increasing
  . In short, normalized enthalpy (driven primarily by laser power density) determines, via contact angle, whether the molten track is initially unstable, and if so, the perturbation growth rate. Whether the growth rate yields significant undulation depends additionally on the melt duration, which in our case the dwell time
  (driven by spatial offset between laser spot positions) serves as a good estimate. Therefore, a thick powder layer resulting in a short contact length is more likely to create undulations. At the same time, a longer molten pool, for instance, due to fast laser scan speed or an elliptical beam moving along its major axis can lead to undulations as well.
Acknowledgments
We would like to acknowledge the Princeton University Eric and Wendy Schmidt Fund for the financial support of this project.