

Abstract
Due to the rapid development of precision manufacturing technology, much research has been conducted in the field of multisensor measurement and data fusion technology with a goal of enhancing monitoring capabilities in terms of measurement accuracy and information richness, thereby improving the efficiency and precision of manufacturing. In a multisensor system, each sensor independently measures certain parameters. Then, the system uses a relevant signal-processing algorithm to combine all of the independent measurements into a comprehensive set of measurement results. The purpose of this paper is to describe multisensor measurement and data fusion technology and its applications in precision monitoring systems. The architecture of multisensor measurement systems is reviewed, and some implementations in manufacturing systems are presented. In addition to the multisensor measurement system, related data fusion methods and algorithms are summarized. Further perspectives on multisensor monitoring and data fusion technology are included at the end of this paper.
Export citation and abstract BibTeX RIS

Original content from this work may be used under the terms of the Creative Commons Attribution 3.0 licence. Any further distribution of this work must maintain attribution to the author(s) and the title of the work, journal citation and DOI.
1. Introduction
Automated workplaces are widely regarded as important factories of the future because of their flexibility and efficiency. The demand for machined parts with tighter surface finishes and higher machining precision has led to the need for better, more precise control of automated machining processes [1], mainly due to intensified global competition, shortened product life cycles, and diversified product demand [2–4]. To meet the growing demand, manufacturers are increasingly turning to automated processing systems, which can reduce dependence on operators during production. The realization of automated processing systems depends mainly on reliable and robust monitoring systems, which are used in the online and offline monitoring of critical machining processes.
The sensors are widely used physical devices that respond to a physical stimulus by giving an electrical output. As shown in figure 1, modern instrumentation systems are equipped with many different sensors, each with its own separate function. Each sensor in the monitoring system can measure a certain parameter independently and use a special signal-processing algorithm to combine all of the independent measurements into a complete measurement value. This kind of system is referred to as a multisensor system [6–9]. For instance, by implementing a multisensor system for monitoring and controlling metal cutting operations and machine tools, a significant reduction in machining errors and better surface finishes can be achieved. This method is increasingly used for lower cost, powerful microprocessors. Meanwhile, sensing instruments make the use of signal-processing systems and digital closed-loop control quite economical [10–12]. Therefore, a multisensor system is an important component for achieving higher machining accuracy.
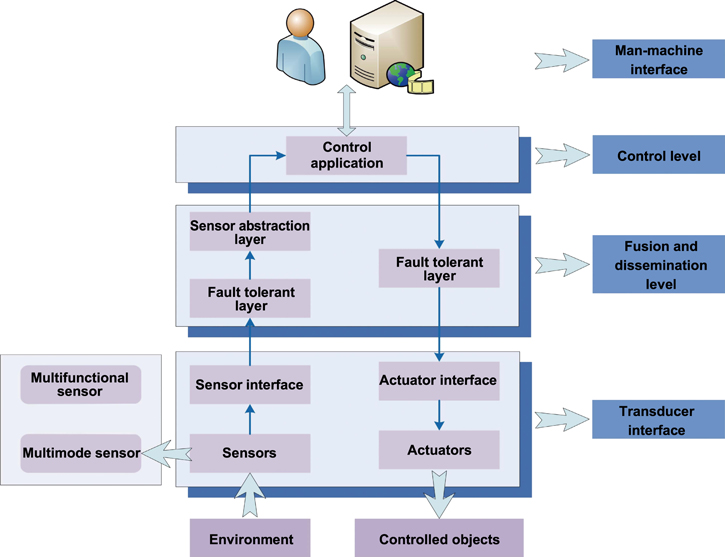
Figure 1. Framework for intelligent multisensor system. Reproduced with permission from [5].
Download figure:
Standard image High-resolution imageIn a multisensor system, the key to achieving the system's function is the coordination of all sensors. Figure 1 illustrates the general framework of an intelligent system with multisensor capabilities. In a multisensor system, the sensors provide measurement data to the data fusion layer, which uses advanced signal processing algorithms to combine the information into a whole. Meanwhile, the control application provides sufficient control signals to the actuator [5]. The process of combining the measurement data of all sensors and utilizing special algorithms to provide a complete overview of the measurement is called multisensor data fusion [13–20]. At present, data fusion technology has become one of the research hot topics worldwide. Data fusion refers to taking full advantage of multiple information sources and combining complementary or redundant information in space or time. Using specific standards, data fusion can obtain consistent interpretation of a tested object, so that the information system performs better compared to a system composed of subsets. Data fusion uses mathematical methods and technical tools to synthesize different sources of information, obtaining high-quality, useful measurement data. Compared with the independent processing of a single source, the advantages of data fusion include improving detectability and reliability, expanding the range of spatial-temporal perception, reducing the degree of ambiguity of inference, improving detection accuracy, increasing the dimension of target features, improving the resolution of spatial questions, and enhancing the fault-tolerant ability of the system [21–34].
This paper describes multisensor measuring and data fusion technology by introducing the architecture of different multisensor process monitoring systems and different, widely applied data fusion algorithms. Some applications of multisensor systems are also described. Section 2 presents a detailed review of multisensor monitoring technology. Section 3 summarizes different sensor fusion algorithms. Section 4 discusses future perspectives of multisensor process monitoring systems and data fusion technology. Finally, section 5 presents conclusions.
2. Multisensor monitoring technology
2.1. Additive manufacturing (AM) monitoring system
Compared with the subtractive manufacturing process, AM is a very competitive, low-cost, high manufacturing freedom technology [35–37]. AM technology has many advantages, including the ability to reduce production time, produce complex customizable components, repair various mechanical parts, and fabricate free-form components [38, 39]. Despite the benefits described above, AM technology is still considered an exception for two reasons: quality and repeatability. Compared to traditional manufacturing systems, AM's defect rate is still high. To address this issue, many recent thematic studies, projects, and roadmaps have prioritized the development of process monitoring methods [40–45]. Under ASTM standard F2792-12a, AM processes can be divided into seven categories: binder jetting, material extrusion, vat photopolymerization, material jetting, sheet lamination, directed energy deposition (DED), and powder bed fusion (PBF) [46].
As shown in figure 2, the PBF system uses a powder deposition method, where a powder layer is spread on the substrate and the powder reservoir. After the powder is evenly distributed, the PBF system uses the heat from a laser or electron beam to track the geometry of the various layers of the slice according to a three-dimensional (3D) model. Once the processing of one layer is finished, the height of the building platform is lowered; and the manufacturing process is executed continuously.
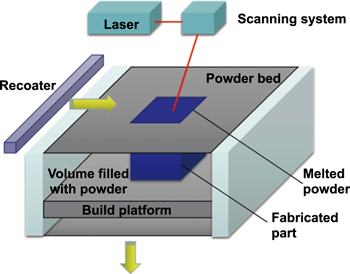
Figure 2. Schematic of PBF system (building chamber). Reproduced from [43]. © IOP Publishing Ltd. All rights reserved.
Download figure:
Standard image High-resolution imageIn AM process monitoring systems, the mainstream sensors and in situ data measuring equipment can be divided into the following main categories: noncontact temperature measurements, visible imaging, and low-coherence interferometric imaging. In addition, the sensor installation methods can be grouped into 'off-axial' and 'coaxial.' In off-axial configurations, the sensors are installed outside the optical path with a deflection angle relative to the monitored region. However, in coaxial configurations, the sensors can conveniently monitor the optical path of the power source. Figure 3 shows the experimental setup of the AM process monitoring system. The optical monitoring setup consists of a near-infrared complementary metal-oxide-semiconductor (NIR CMOS) camera and photodiode [47–50]. In the process of manufacturing, the laser beam is reflected toward the scanner by a partially semipermeable mirror. Meanwhile, Sensors 1 and 2, which are sensitive to a wavelength between 400 and 1000 nm, capture the radiation emitted by the melting pool with the beam splitter. Then the radiation intensity of the melting pool is integrated into one measurement value. The NIR CMOS camera has a 1280 × 1024 pixel sensor whose rate is 10 kHz, and it is used to determine the shape and temperature distribution of the melting pool during the manufacturing process. However, in order to achieve the 10 kHz sampling rate, the field of view has to be reduced to a limited region.
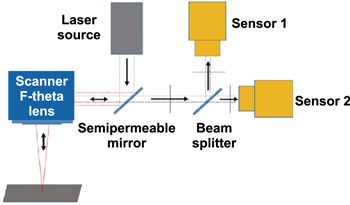
Figure 3. Schematic of the multisensor monitoring system. Reprinted from [44], Copyright (2010), with permission from Elsevier.
Download figure:
Standard image High-resolution imageThe DED process is a metal-based AM process that creates 3D components by melting materials during deposition. The DED processes can be divided into two categories based on the material delivery mechanism: wire feeding and powder feeding. As shown in figure 4, unlike the PBF system shown in figure 2, the DED system does not melt the material previously placed on the powder bed but is used to melt the powder material deposited. In the process of manufacturing, the DED AM system uses a high-powered laser to melt the powder delivered by the cladding nozzle with the inert shield gas [51–54].
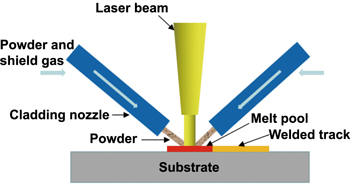
Figure 4. Schematic of the DED process with powder feeding mechanism. Reprinted from [51] Copyright 2017. With permission of Springer.
Download figure:
Standard image High-resolution imageThe DED process is dedicated to the manufacturing of functional metal parts. The energy input of the DED AM system can be provided by electric arc and high-powered laser, and its deposition material can be in the form of powder and wire. As the DED process is operated in an open-loop environment, it has some drawbacks due to production losses and lack of reproducibility. Therefore, in order to improve the performance of the DED system, the process optical monitoring system is investigated and utilized to control the manufacturing in a timely manner, ensuring high-quality final components. At present, there is some research being conducted that is devoted to designing a single closed-loop control system for the DED process, which can control the material delivery, laser energy, thermal distribution, and so on. As some monitoring systems are limited to controlling only one criterion, multisensor monitoring system methods are proposed; however, the multisensor monitoring systems designed still focus on one phenomenon, mainly the geometric phenomenon in the DED process. In [54], a new multisensor methodology is proposed for monitoring at least two DED processes. As presented in figures 5 and 6, the investigation mainly focused on the closed loop of thermal and geometrical control, respectively. An infrared camera was set up in the wire arc additive manufacturing (WAAM) and laser metal deposition (LMD) manufacturing units for global thermal imaging during the manufacturing process. Obviously, the infrared camera was installed far from the melting area to obtain a large enough imaging field of the manufactured parts and to protect the camera from potential damage in the complex processing environment.
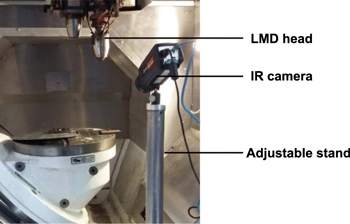
Figure 5. The experimental thermal monitoring setup utilized in LMD. Reprinted from [54] Copyright 2019. With permission of Springer.
Download figure:
Standard image High-resolution image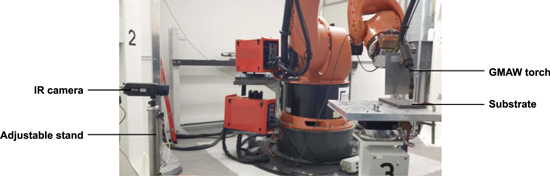
Figure 6. The experimental thermal monitoring setup utilized in WAAM. Reprinted from [54] Copyright 2019. With permission of Springer.
Download figure:
Standard image High-resolution imageTo calibrate the thermal imaging camera used for thermography measurements, preliminary tests were performed. The stainless steel material's emissivity was set to 0.7. Regarding the conversion from red, green, blue (RGB) to temperature, the camera directly provided a value proportional to the temperature of the objects based on the emissivity value. Meanwhile, the image resolution for the WAAM and LMD applications was approximately 0.5 mm/pixel and 0.2 mm/pixel, respectively.
As presented in figure 7(a), an infrared camera was used to acquire in situ thermal data. As shown in figure 7(b), the high temperature zone (HTZ) is highlighted in black. As the liquid phase transition resulted in a local drop of the emissivity properties, the temperature measured at the melt pool location was significantly lower than expected. In figure 7(b), it can be noted that the HTZ is following the torch path.
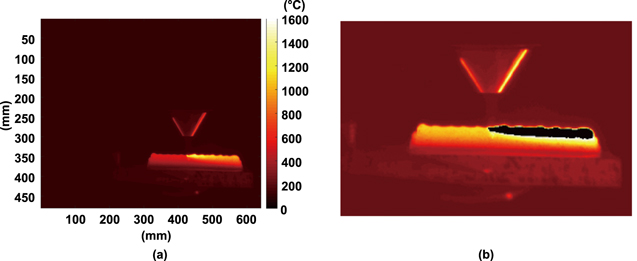
Figure 7. The in situ thermal monitoring in the LMD manufacturing of wall B: (a) thermal field and (b) presentation of the high temperature zone (HTZ). Reprinted from [54] Copyright 2019. With permission of Springer.
Download figure:
Standard image High-resolution imageAs a promising technology, WAAM has attracted much more attention due to the ability to build fully dense components by continuously depositing layers in the form of wires. Meanwhile, the deposition height is considered to be a key factor for metallic deposition components, which can be detected by the automatic methodology in the robotic gas-tungsten-arc (GTA) based AM processes. For instance, as described in [55], the optical filters and camera installed monitored the deposition height, defined as the distance from tungsten tip to the top layer. Furthermore, specially designed imaging processing algorithms were used to extract the characteristic parameters of the melting pool. By designing a new tracking algorithm and analyzing continuous images, the location of the solid–liquid separation in the melting pool was determined. Finally, the tracking algorithm was demonstrated to have outstanding effectiveness and anti-interference ability in the GTA-based AM processes. As presented in figure 8(a), the robotic GTA-based system mainly includes the MagicWave 3000 Job G/F powder equipment, a Motoman MH24 six-axis robot, KD4010 wire feed equipment, and so on. Figure 8(b) shows the locations of the GTA torch and the optical sensor, respectively.
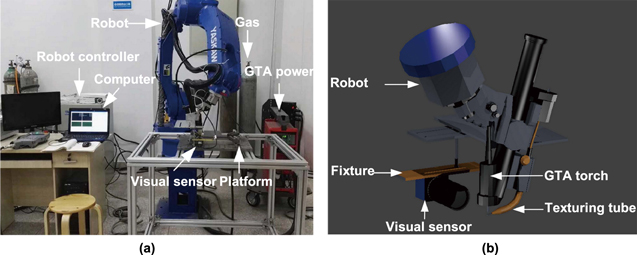
Figure 8. The robotic GTA-based AM systems: (a) experimental system and (b) position relationship between the GTA torch and visual sensor. Reprinted from [55], Copyright (2019), with permission from Elsevier.
Download figure:
Standard image High-resolution imageAs presented in figure 9, the visual sensor consists of two filters and a camera; and the sensor is used to observe the current layer and tungsten tip. As a result, the image captured by the sensor in the process of manufacturing is shown in figure 10. The image is divided into five areas: background, solidified layers, tungsten, arc, and molten pool. The gray values in the area of the arc equaled 255, while the gray value in the area of the background equaled from 0 to 15. As the gray values sharply change along the interface, the molten pool can be conveniently distinguished in the current manufacturing layer.
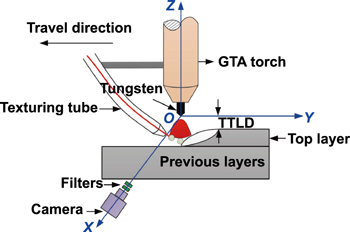
Figure 9. The definition of tungsten to top layer distance (TTLD) and schematic of visual sensing system. Reprinted from [55], Copyright (2019), with permission from Elsevier.
Download figure:
Standard image High-resolution image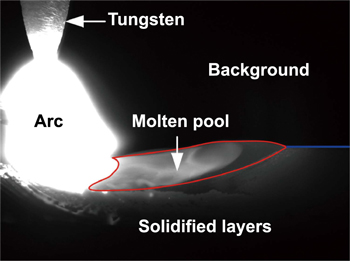
Figure 10. Captured image in the robotic GTA-based AM system. Reprinted from [55], Copyright (2019), with permission from Elsevier.
Download figure:
Standard image High-resolution imageIn [56], the MER-125-30UM-L camera sensor used has a sampling rate of 30 fps; and it can capture 1292 × 964 pixel images. Meanwhile, the distance from the tungsten to the lens is 130 mm, and the lens' focal length is 35 mm. In order to protect the camera from strong radiation in the complex manufacturing environment, the dimmer glass was installed in front of the camera, enabling a high-quality image of the molten pool to be obtained with a suitable aperture of the camera. As the deposited region mainly radiates red lights under high-temperature conditions, a filter with a center wavelength of 685 nm was installed in front of the camera, guaranteeing high contrast images of the molten pool and manufactured layers. By utilizing the narrow-band filter, only 685 nm spectra can pass through it; and the images captured by the sensor were composed of an intensity of 685 nm and near this wavelength.
In the images monitored, the position of the tungsten tip is fixed as the camera sensor is installed on the GTA torch. The main challenge is determining the edge of the layer for measuring the tungsten to top layer distance (TTLD). The characteristics of the layer's surface can be extracted from the captured images by the image processing algorithms designed. As shown in figure 11, image processing in the GTA AM processes consists of several procedures, e.g. gaussian filter process, edge detection, threshold segmentation, Hough transform, and image fusion. As seen in [56], the original image is handled by some designed algorithms, the gaussian filter is used to remove noises, and the Hough transformation is used for top edge fitting. Once the row coordinate of the surface is obtained, the TTLD value can be calculated by the row deviations.
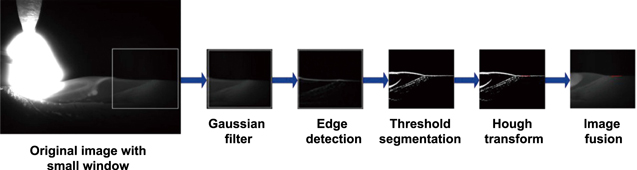
Figure 11. The captured image processing for determining TTLD in GTA-based AM systems. Reprinted from [56] Copyright 2019. With permission of Springer.
Download figure:
Standard image High-resolution imageUsually, AM processes involve a variety of complex physical phenomena; and complex process control strategies are required to achieve the advanced mechanical properties of metal parts. Moreover, the complexity of DED technology is even higher when compared with other metal AM technologies. The DED technology has a greater potential for high flexibility and efficiency, but its process control is much more difficult. In [57], a multisensor method is presented that combines the online signals with data from offline inspection equipment when inspecting the quality of the parts. Furthermore, this data fusion method for process monitoring forms the basis of the process modeling phase; therefore, this method lays the foundation for the realization of intelligent control strategies which would work by adjusting machine process parameters by tracking part size and mechanical quality. The advantages of the proposed method have been evaluated through special experiments on the DED machine.
The major content of this research is represented by the fusion of different kinds of data collected by various sensors during and after deposition. There are some data that can be exploited, such as online machine tracing, which consists of laser location, laser power, and the moving velocity. Meanwhile, the thermal measurements and features of the molten pool are included as the online monitoring categories. Furthermore, there are some points about offline inspection, for instance, porosity from microscopy, 3D reconstruction, and so on.
In the process of manufacturing, the monitored data may be space referenced and time referenced and in both situations using different resolutions. Meanwhile, a comprehensive data fusion method must be used to take full advantage of the information due to its heterogeneity. As presented in figure 12, the flow of data fusion is quite clear, and this data fusion method takes full consideration of the data acquired through the experimental equipment. The camera captures molten pool images in high velocity, and the machine programmable logic controller records the laser spot location and laser power simultaneously. In addition, the geometry of the resulting samples is 3D scanned after each deposition. Moreover, these data are then recorded and integrated in space or time.
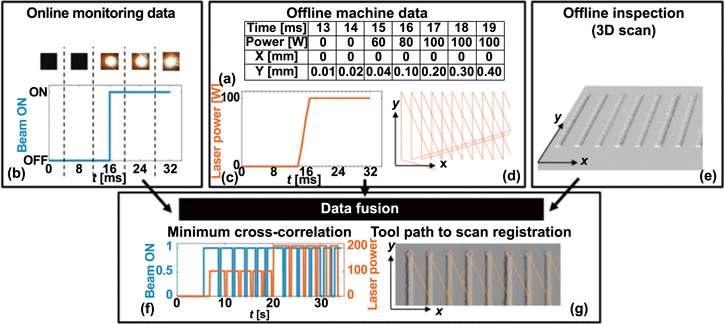
Figure 12. The data fusion methodology. In the machine log file (a), the tool position and laser power are recorded in every stamp. This information for the time-alignment (f) of the molten pool images for the computation of the cross-correlation between the image retrieved beam-ON signal (b) and the laser power signal (c), and for the spatial registration (g) of the tool trace (d) to the 3D deposited geometry (e). Reproduced with permission from [57].
Download figure:
Standard image High-resolution imageAs presented in figure 13, the experimental equipment used for the current research is the Prima Power LASERDYNE® 430 3-axis computer numerically controlled (CNC) machine. The 3-axis CNC machine was originally designed for laser cutting operations, and it has been converted to an AM machine by integrating the four-nozzle Optomec DED head with a forward-looking infrared (FLIR) camera. The FLIR camera is installed onto the deposition head, and it is able to monitor the melting pool by means of the dichroic mirror in the optical channel. For offline measurements, the GOM ATOS Core 200 fringe projection scanner can provide a 3D mesh representing the surface of the part being constructed.

Figure 13. The presentation of equipment: the DED machine (top left), 3D scanner (top right), high-speed camera for monitoring the melting pool (bottom left), and the deposition head (bottom right). Reproduced with permission from [57].
Download figure:
Standard image High-resolution imageWith the development of multimaterial techniques and component embedding, an AM technique for creating enhanced or multifunctional parts is emerging. In the current state of technology, parts fabrication processes usually require interruption and part removal, which is referred to as stop-and-go fabrication. Position error of the parts can occur during the process of repositioning the parts prior to resumption of manufacturing. In the electron beam melting (EBM) system, the manufacturing environment is an important challenge for stop-and-go fabrication. The ultrahigh vacuum is up to 10−4 Torr; and the processing temperature is up to 800 °C, which limits access to the EBM chamber. In [58], part-positioning technology based on infrared images was successfully developed for the EBM manufacturing system to reduce position error for stop-and-go fabrication. In [58], the infrared imaging technology developed was applied to the stop-and-go fabrication of rectangular prisms and cylindrical components. After manufacturing, the angular and linear displacements of the rectangular prisms and cylindrical components were measured; and as a result, the absolute maximum values were 0.87 mm and 0.17 mm, respectively. Therefore, the infrared image analysis technique of parts positioning errors can be effectively used in multimaterial fabrication, AM fabrication, and so on.
In this system, the expected beam position (x–y point) relative to the parts in the powder bed has to be considered and determined to accurately build on top of the previous layer. As presented in figure 14, the infrared (IR) camera was installed outside the manufacturing chamber; and the infrared image analysis algorithms were designed using MATLAB® software, extracting the rotation and centroid position of a part. Thus, the angular and linear offsets of the parts can be calculated effectively. As shown in figure 15, the flowchart of the infrared image analysis method is divided into five steps. First, the infrared images are acquired by the IR camera. Then the infrared images are converted into binary images that are used to calculate the centroid location and displacement. Finally, the analysis algorithms are used to detect the part edge and calculate the angular displacement, and the computer-aided design file is updated.
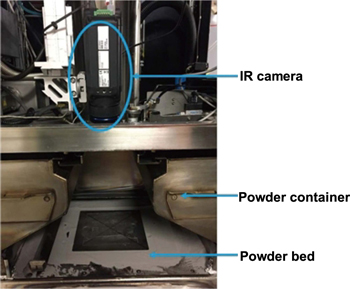
Figure 14. Infrared (IR) camera setup. Reprinted from [58] Copyright 2018. With permission of Springer.
Download figure:
Standard image High-resolution image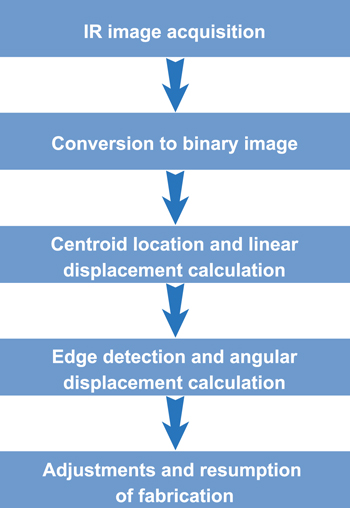
Figure 15. Schematic of the part-positioning technology. Reprinted from [58] Copyright 2018. With permission of Springer.
Download figure:
Standard image High-resolution imageAn example of an infrared image converted to a binary image is presented in figure 16. Usually, the two-dimensional image can be considered as a matrix with c columns and r rows; and each position (r, c) in the matrix correlates with a pixel in the image. In every pixel, the binary image can be described in black and white, whereas color images can be represented by three 16 bit values, including RGB. In this research, the use of white pixels (pixel value = 1) specifies the area of the part image captured in the process of manufacturing, while the use of the black pixels (pixel value = 0) represents the background. Furthermore, the boundary of the part can be found from the binary image so that the changes in the rotation and centroid position of the part can be measured effectively. As a result, the binary images in this paper were used to detect the part edge with the characteristics of low cost and convenience, whereas more methods were explored by utilizing RGB color images.
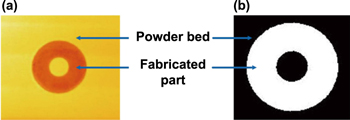
Figure 16. The image captured of the fabricated part. (a) Infrared image and (b) converted binary image. Reprinted from [58] Copyright 2018. With permission of Springer.
Download figure:
Standard image High-resolution image2.2. Laser welding system
During laser welding, the material interacts with the laser beam and gives rise to a range of different process characteristic signals. These can include airborne and structure-borne acoustic emissions, back reflection of the laser beam itself from the interaction zone, and process emissions emitted by the metal vapor in and above the keyhole (present either as a plasma or plume), the molten pool, and the base metal [59].
The first monitoring approach in the work of [59] investigated optical-based signals associated with these process emissions. Photodiodes, sensing visible and near-infrared (NIR) emissions, were used to monitor laser-induced, radiative emissions from the laser interaction zone. Correlations of these signals with different types of weld discontinuities were investigated, such as incomplete penetration and porosity. Photodiodes have the advantage of being low cost, capable of detecting process emissions over a wide wavelength range (from ultraviolet (UV) to IR), and are suitable for use in industrial manufacturing environments. In general, a spectral range of photodiodes of 200–850 nm suitable for analyzing emissions from the laser interaction zone has been identified by the research community [60–63]. Bono et al [64] investigated an established optical-based monitoring method, using photodiodes responsive to either visible or NIR emissions, to correlate the photodiode signals with different types of weld features, imperfections, and/or process anomalies. These included occurrences of internal porosity, changes in penetration depth and beam-to-joint alignment, deliberate changes in laser power, and intentionally poor joint preparation, cleanliness, or fit-up. Also, a new type of commercially available process monitoring approach, based on laser interferometry, was investigated to measure keyhole depth. The results of both approaches confirmed the types of weld features, imperfections, and/or process anomalies most sensitive to these monitoring techniques, with the potential of implementing these findings in a future multisensor solution for real-time process control.
As shown in figure 17, a continuous wave 5 kW Yb fiber laser beam source (1070 ± 10 nm) was used in the welding trials. The laser beam was delivered through a 0.15 mm core diameter optical fiber to a Precitec welding head comprised of a 100 mm focal length collimating optic and 200 mm focal length focusing optic, providing a 0.3 mm nominal diameter spot at focus. The laser power at the workpiece was measured prior to welding using a water-cooled Ophir power meter. The in-process depth meter (IDM) system was integrated into the welding head. The head itself was fixed onto a mounting plate attached to a z-axis, and an Aerotech ATS50045 linear stage was used to move the workpieces beneath the head in the x–y plane. The head was set up so that the beam impinged vertically on the workpiece surface. Argon shielding gas was used for top bead and under bead shielding. The IDM sensor was able to acquire keyhole depth data at a sampling rate of up to 70 kHz, measuring depths up to 10 mm. A collimation unit on the welding head allowed z-adjustment of the focal position of the measurement beam and an integrated x–y displacement of its alignment to the welding keyhole. An RS422 interface was used for real-time data transmission in combination with a Windows®-based PC, running the IDM CHRocodile Explorer software.
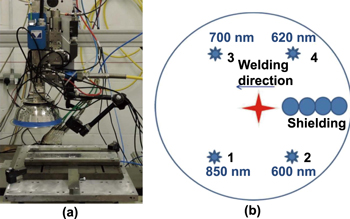
Figure 17. (a) Image of the equipment setup, comprised of the welding head, the in-process depth meter (IDM), and the four photodiodes. (b) Sketch showing the radial positioning of the photodiodes in relation to the welding direction and shielding gas pipes. Reproduced from [64]. CC BY 4.0.
Download figure:
Standard image High-resolution imageA total of four photodiodes were also used. Different narrow bandpass filters were selected, one for each sensor, centered on wavelengths of 600, 620, 700, and 850 nm. A data processing software was used to analyze the photodiode signals. The software included a data processing unit to which a monitor, keyboard, and mouse were connected. A second unit was comprised of digital channels to which the photodiodes could be connected (one per channel) via a Bayonet Neill-Concelman connection. During the trials, data acquisition was performed at 32 768 Hz (2N, N = 15). The four photodiodes and their related filters were held in position around the laser keyhole in a hemispherical metallic support fixed onto the welding head. Figure 17(a) shows an image of the laboratory setup, comprised of the welding head, the IDM, and the four photodiodes. Figure 17(b) shows a sketch of the radial positioning of the photodiodes in relation to the welding direction and the trailing shielding gas pipes used when welding. The photodiodes were aimed at the top of the keyhole at an angle of approximately 45° from the workpiece surface.
Figure 18 shows 700 nm photodiode results from a grease-contaminated butt weld in the same alloy. No background signal correction was applied during the welding trial. In this experiment, the laser power was stepped up halfway along the length of the weld from 1 to 2 kW. Similar results were achieved from the 600, 620, and 850 nm photodiodes. In the case of joint contamination, it was possible to observe an increase in local signal noise corresponding to that length of joint which had been contaminated. Signal noise might, therefore, be used to infer the presence of contaminated joint lengths.
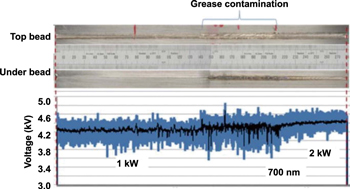
Figure 18. Top bead, under bead, and 700 nm photodiode signal data for a butt weld in nickel (Ni) alloy 718 whose central third length was contaminated with grease. Reproduced from [64]. CC BY 4.0.
Download figure:
Standard image High-resolution imageFigure 19 shows an example of the 850 nm photodiode data from a butt weld in the same alloy, welding over a gap whose width gradually opened from 0 mm (at the weld start) to 1 mm (at the weld end). In this case, a constant beam power of 2 kW was used. Similar results were achieved from the 600, 620, and 700 nm photodiodes. When a joint gap between two abutting workpieces was present, a decrease in the average photodiode signal value was observed, combined with an increase in its noise from the interaction of the beam with the welding jig underneath the joint. Again, this type of change in the signal could be used to infer unacceptably wide joint gaps.

Figure 19. Top bead, under bead, and 850 nm photodiode signal data for a butt weld in Ni alloy 718, when welding over a gradually opening joint gap. Reproduced from [64]. CC BY 4.0.
Download figure:
Standard image High-resolution imageIt is essential to install process monitoring equipment in the laser welding system, thereby improving the productivity and ensuring stability. There are some phenomena, such as light emission, stress wave, and optical imaging, that can be observed in the process of welding [65]. In the process monitoring system, some sensors are integrated as a whole system in order to measure more processing features. For example, in [66], Zhang et al used the contact probe to measure the voltage of plasma, measuring the charge intensity and analyzing the behavior of the plasma. In [67], according to the welding conditions, the IR and UV signals were measured and analyzed at the same time. In [68, 69], two infrared photodiodes with a wavelength of 950 nm were installed at different angles to measure the plasma phenomenon. In [70], the P, T, and R sensors were utilized to measure the backscattered laser, the weld pool, and the light of the plasma. In [71, 72], Park et al used the photodiodes to measure the experimental parameters, examining the relations between the plasma signals and the welding quality. Furthermore, in [73], Sibillano et al analyzed the plasma's spectra under aluminum laser welding, while Palanco et al [74] analyzed the spectra of plasma under aluminum welding. Finally, in order to control the weld penetration, Jauregui [75] utilized four photodiodes for detection during the laser welding processes.
As described in [76], a monitoring system was developed for measuring the plasma signals to monitor laser welding processes. The plasma emission characteristics between the aluminum alloy and the laser were analyzed by using the spectral information. Furthermore, by means of experiments, the relationship between the monitoring signals and the process parameters was established; and the prediction algorithms were developed by using the monitoring signals to predict the welding quality. The estimation algorithms predicted the tensile strength by using a neural network model with the pattern recognition algorithm, and the user interface was designed to use this algorithm conveniently.
Figure 20 presents the experimental devices for laser welding which utilize the filler wire provided in front of the laser's moving direction of travel, and the Nd:YAG laser has a maximum output of 4.4 kW. As shown in figure 20, the laser is tilted approximately 18º from the vertical direction to protect the optical components from damage by the reflected laser. Usually, in order to improve the quality of welded components, it is essential to monitor and control the weld penetration during the welding processes. As the penetration cannot be observed directly from the connectable, movable frontside sensors, monitoring of the weld penetration is a large challenge. Therefore, as frontside sensors can presently measure the signals that inherently correspond to the weld penetration, it has become an attractive project for many researchers.
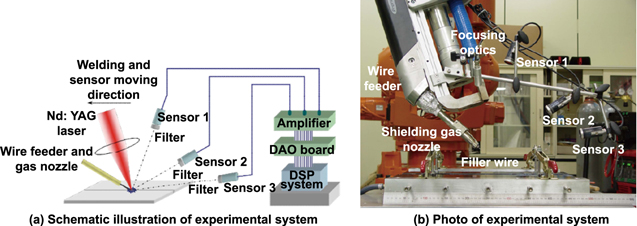
Figure 20. The experimental setup for the laser welding and monitoring system. Reprinted from [76] Copyright 2016. With permission of Springer.
Download figure:
Standard image High-resolution imageIn [77], the infrared images were captured and analyzed, illustrating the relationships between the torch position, the weld bead width, and the weld penetration depth. In [78], Carlson et al estimated the sidewall penetration by using ultrasonic signals. In [79], the 3D weld pool measurements were reviewed by Wang et al Furthermore, in [80], the 3D vision sensing system was designed and demonstrated in the gas tungsten arc welding (GTAW) system, which can measure the welding pool surface with weld penetration, to measure the 3D specular welding pool spectrally. This method is considered promising as skilled welders can estimate successfully and control the weld penetration based on observations of the welding pool (mainly 3D surfaces). The authors of [80] considered some frontside signals as features, such as the welding pool's length, width, etc, aiming to improve the prediction of the bead width. As a result, it demonstrates that the key issue is how to build an accurate model from a bit of training data, as the cost of generating training data is quite high.
In the Welding Lab at the University of Kentucky, an experimental system was designed for the GTAW processes, as shown in figure 21. In the GTAW processes, the material for welding was stainless steel 304, the wall thickness of the stainless steel pipe was 2.03 mm, and the outer diameter was 113.5 mm. Meanwhile, the 19 by 19 dot matrix laser pattern was generated by the 20 mW illumination laser with a wavelength of 684 nm, which was easily reflected by the melting pool. Under the influence of the plasma generated by the arc, the surface of the welding pool was deformed and depressed, which caused the reflection point matrix to be deformed. As presented in figure 22(a) [81], the 3D molten pool was reconstructed by utilizing the image processing effectively. However, in order to improve the ability to predict the bead width more accurately, more nonlinear modeling methodologies were needed which would overcome the limitation of the large amounts of training data needed for experiments. Therefore, a support vector model was proposed in [81], utilizing kernel functions and reducing the experimental data effectively.
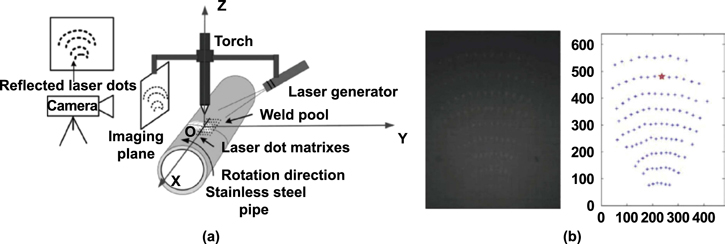
Figure 21. The 3D vision-based monitoring system. (a) The sensing system and (b) the captured image. Reproduced with permission from [80].
Download figure:
Standard image High-resolution image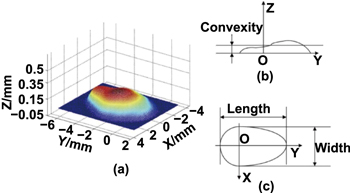
Figure 22. The 3D weld pool surface and its characteristic parameters. (a) The presentation of the 3D reconstruction of the molten pool, (b) weld pool surface convexity, and (c) weld pool width and length. Reprinted from [81], Copyright (2019), with permission from Elsevier.
Download figure:
Standard image High-resolution imageToday, multisensor technology is widely used in the field of laser welding. In [82], x-ray transmission imaging equipment and high-speed camera sensors were used to observe the welding processes, analyzing the welding velocity and laser power density's influence on the welding formation. The welding width and molten pool size can be directly monitored by the radiation intensity received [82, 83]. In [84], the effects of welding velocity on high frequency signals and the relationship with the high frequency were studied using an optical filter and photodiode, acquiring laser reflection and visible light radiation in the process of welding. In [85], a spectrometer was used to acquire the spectral distribution; and the high-speed camera was utilized to capture the keyhole image. Meanwhile, the weld penetration and weld width were detected by extracting the parameters. You et al used a variety of sensing technologies in the laser welding processes, quantifying various physical and optical characteristics to fully analyze the defects of laser welding. In [86], as shown in figure 23, the recognition model was built and the welding state predicted by extracting and analyzing the features from six imaging sensors, resulting in the timely monitoring of the high-power laser welding. In this system, the high-speed camera sensor in the visible wavelength band and ultraviolet band was installed to capture the plume images during the laser welding of stainless steel 304. In addition, the molten images were captured by an x-ray imaging system and NIR wavelength band. The laser-reflected intensity and the visible light intensity were acquired by using a laser sensing photodiode and visible light photodiodes. Furthermore, the correlations between welding conditions and welding features were analyzed by extracting the optical signals from different laser welding conditions.
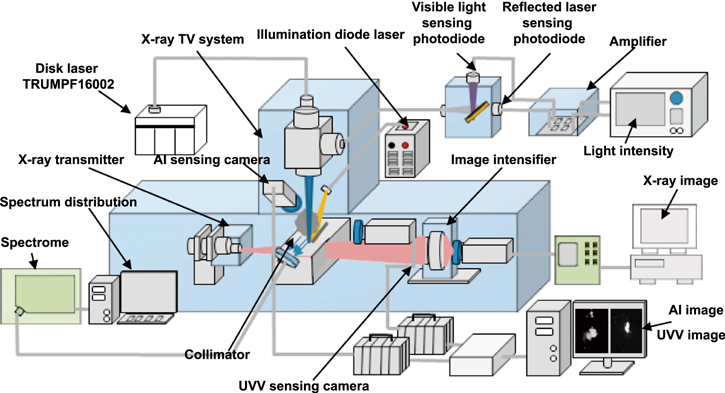
Figure 23. The schematic of a six-sensor monitoring system for laser welding. Reprinted from [86], Copyright (2015), with permission from Elsevier.
Download figure:
Standard image High-resolution imageAs presented in figure 23, the multisensor system includes an ultraviolet/visible (UVV) visual sensor, an x-ray visual imaging sensor, a spectral graph, a visible light photoelectric sensor, a laser reflective photoelectric sensor, and an auxiliary illumination visual sensor, which are utilized to achieve timely detection and analysis during laser welding. Meanwhile, the multisensing system and welding system can be synchronized by the trigger sensor, which is installed under the table and connected with the signal box, providing a trigger signal for the sensing system and laser machining system.
Moreover, the metal spatters and plume images can be obtained by means of the high-speed camera sensor with the visual induction filter, analyzing the characteristics of metal spatters and plume. Meanwhile, for analyzing the characteristics, the molten pool images can be obtained by the 40 W diode laser of 976 nm wavelength and the high-speed camera equipped with a narrow band filter. By connecting two fibers to the laser head, the welding areas' light intensity can be transmitted to the optical splitter; and the laser reflection intensity and light intensity can be obtained by the two photoelectric sensors, respectively. The x-rays are emitted from the left side of the weldment and penetrate the entire welding area. Differences in material density cause the different degrees of attenuation of x-rays. In addition, the spectrometer collimator is arranged at the front of the welding direction and focuses on the plasma area. The spectrometer receives spectral information through the optical fiber.
The binarization processing of images is illustrated in figure 24(a). The median filter is utilized to remove the noise, and thus the color images can be successfully converted to binary images. As presented in figure 24(b), in the binary images, the ordinate value of keyhole forefront and the top area of keyhole (KS) have been extracted for describing the characteristics more fully. Furthermore, in [87], the six sensors produced 42 features, and the penetration with weld width were acquired as welding parameters. An association analysis was performed to select the 16 pivotal features most close to the welding situation parameters, and a quantitative analysis was performed on the association rules between the welding parameters and the pivotal features. Under different laser welding conditions, the relationship between the welding features, welding condition, and welding state was revealed by means of a series of experiments. The welds formed were produced in different states, such as blowout, hump, dimple, and stabilization. In order to identify the welding state, the Bayesian network defects detection model was established based on the key features. The tree-augmented naïve (TAN) Bayesian network model is superior to the Markov Bayesian network model, and the prediction accuracy of the TAN Bayesian network model can reach 86.04%, which is 10.92% higher than that of the Markov model.
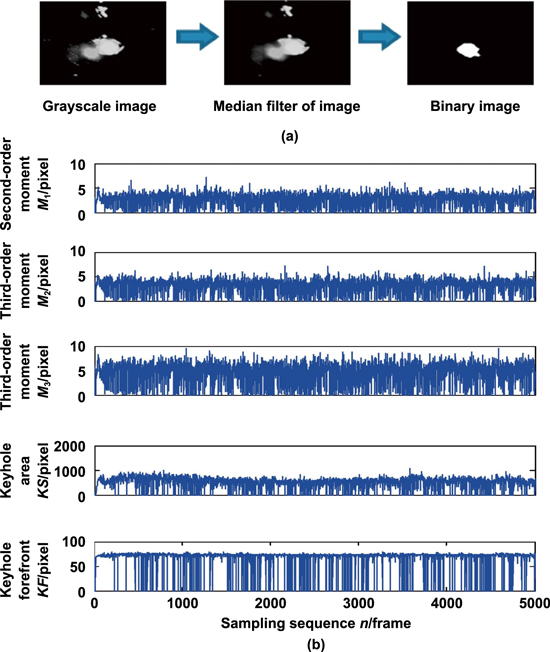
Figure 24. The AI visual sensing signal processing. (a) The keyhole imaging processes and (b) configuration parameters of the keyhole. Reprinted from [87], Copyright (2019), with permission from Elsevier.
Download figure:
Standard image High-resolution image2.3. Milling system
Milling is a common and effective cutting operation, which can intermittently cut components into threads, flat surfaces, and many complex components by using a rotary cutter with one or more teeth. Milling processes are widely used in industrial manufacturing because they are suitable for mass production. Tools are the backbone of the milling process [88], and tool breakage is the main cause of unplanned downtime in the machining environment. Tool breakage has a negative influence, including indirect and direct effects. Milling machine downtime because tool failure accounts for 7%–20% of total downtime [89, 90], while the cost of tools and tool replacement accounts for 3%–12% of the total machining cost [91]. The timeliness of detecting tool damage is quite important as the condition of tools changes over time, and a suitable tool replacement strategy is needed. In general, tool change strategies are subjective and periodic, and the time period depends on the operator's experience. Early replacement of usable tools wastes tools and increases downtime, while obsolete replacement of worn tools leads to reduced workpiece quality and increased production costs. Therefore, in the milling processes, tool condition monitoring (TCM) has become a critical issue.
In the TCM system, a single sensor cannot achieve good robustness because of the uncertainty and limitations. Processing signals can be obtained by different kinds of measuring sensors, such as current, cutting force, vibration, etc. Therefore, research on multisensors in TCMs has become a trend as the multisensor method can effectively reduce the uncertainty of measurements, enhance the richness of the measuring data, and improve accuracy. Zhou et al [92] illustrated that in the milling processing system, multisensor methods have been used more frequently. At present, some studies have found that the number of measuring sensors and feature parameters is not directly related to prediction accuracy. The main purpose of feature extraction is to extract feature parameters from the signals and significantly reduce the size of the original information. The monitoring model is greatly affected by the feature extraction, and the model computation would be greatly increased by some characteristic parameters. Zhang et al and Grasso et al [93, 94] showed that the performance of the monitoring system can be affected negatively by redundant and irrelevant characteristics' parameters. Presently, feature selection and feature fusion are the two major kinds of multidomain feature extraction methods. Through linear or nonlinear mapping, the new parameters from preset sensor feature parameter sets can be obtained by feature fusion methods, and the new characteristics' features are utilized as the monitoring model's input parameters [43, 44]. For example, in [95], the feature parameter dimension was reduced; and the new fusion parameters were established by using the local preserving projection algorithm. Furthermore, Wang et al [96] utilized the kernel principal component analysis algorithm to fuse the 54 feature parameters in the frequency domain and time domain. However, although the feature fusion methods have the advantage of providing more comprehensive information and reducing feature dimensionality, all of the sensors must be calculated; and the maintenance cost for the online monitoring may be increased. For instance, Wang et al [97] selected 13 parameters that significantly correspond to the tool wear values by using Pearson's correlation coefficient from 144 feature parameters. In [91], the smallest redundant feature, which includes 19 feature parameters, was established by means of the fast correlation filter algorithm, and the total of the frequency domain, wavelet energy, and time domain parameters was 138. Not only did the feature selection methods reduce the number of input parameters, but they also reduced the computation. Nevertheless, the main consideration of these methods is the relationship between the tool situation and the parameters and not the effects on prediction accuracy. Therefore, it is essential to acquire the optimal sensor feature parameter combinations to improve the prediction accuracy effectively.
Introduced in [98], as presented in figure 25, is a multisensor fusion method; and the operation of this method consists of three steps. First, the dynamic signals are collected to characterize the milling process. Then the method extracts the parameters from multisensors in the frequency, time, and time-frequency domains. Finally, the tool situation is monitored, and the tool wear values are judged by using the kernel extreme learning machine (KELM), in which the optimal sensor parameter combinations are the inputs.
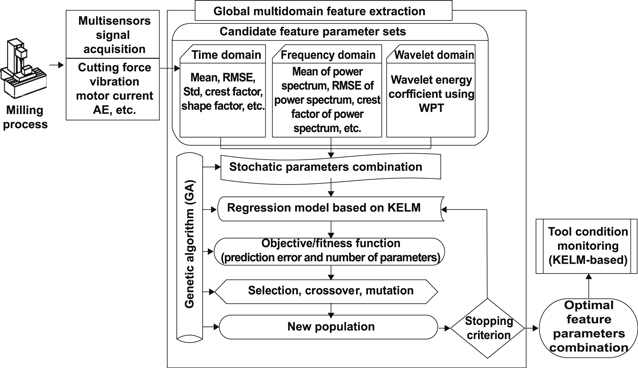
Figure 25. Schematic of the proposed tool condition monitoring methodology. AE: acoustic emission; WPT: wavelet packet transform; KELM: kernel extreme learning machine; RMSE: root mean square error. Reproduced from [98]. CC BY 4.0.
Download figure:
Standard image High-resolution imageIn [99], the research focuses on developing a multisensor measuring system on a rotating tool, which can measure the vibration, temperature, torque, and three components of cutting force simultaneously in a wireless environment. Meanwhile, the cutting force signal is produced by utilizing a beam leg transducer embedded in a standard milling cutter holder. A miniature accelerometer is placed under the force sensor, while a thermocouple is placed near the cutting edge, as shown in figure 26. Furthermore, by incorporating the inductive wireless transmitter into the standard rotating tool holder, all of the signals are obtained and transferred to the data logger system. As a result, it is suitable and reliable for measuring the machine signals by the multisensor system according to the verification and experimental tests described in this article.
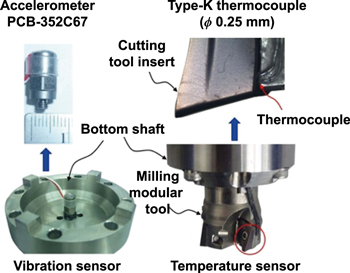
Figure 26. Setup of vibration and temperature sensor. Reprinted from [99] Copyright 2018. With permission of Springer.
Download figure:
Standard image High-resolution image2.4. Condition monitoring and fault detection system
In the process of manufacturing, fault detection and condition monitoring are required to prevent machine failure, extend the life of a machine, reduce operating costs, and increase operating time, which can be achieved by different types of monitoring sensors. Recently, as presented in [100], infrared thermal imaging methods are beginning to be proposed. Furthermore, infrared thermal imaging can achieve nonintrusive, noncontact, and fine-grained temperature measurements, which is critical for machine condition monitoring and automatic fault detection. Infrared thermal imaging is mainly used with machine learning and image processing to enable the system to detect conditions and faults autonomously [101–104].
It has been proven that the utilization of infrared thermal imaging technology can detect several faults and conditions in rotating machinery, such as loose couplings, misalignments, unbalanced rotors, insufficient lubricants, and damage to the rolling bearings [104–107]. Under certain conditions, it is easy to distinguish why infrared thermography is a benefit in detecting faults/conditions, such as a lack of lubricant. Friction control is one of the main purposes of lubricants. Too little lubricant in the bearing housing can cause excessive friction, which can generate heat that the infrared camera can detect. In addition, if there is too much lubrication in the bearing, agitation can occur; and additional heat can be generated.
Features extracted from established vibration analysis techniques can be used to make up for shortcomings of the infrared thermal-imaging-based methods. Therefore, combining these two methods in a multisensor system can improve accuracy. In [108], the vibration data and infrared thermal imaging data are used to extract features and fuse features, with the fused features subsequently provided to the classification algorithm.
As shown in figure 27, during testing, the settings for the rolling element bearings in the right housing were changed, thus this is the housing monitored by the thermal imager. In addition to the infrared camera, a thermocouple was placed indoors to measure the ambient temperature. In addition, two accelerometers were mounted on the bearing block to measure accelerations in the x and y directions. The results showed that several conditions/faults and combinations were detected more accurately by combining these two types of sensor data than when considering sensor flow alone.
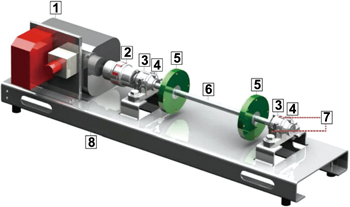
Figure 27. The 3D presentation of the experimental setup. The IR thermal camera is utilized to monitor the red square. (1) Servo-motor with a speed controller, (2) coupling, (3) bearing housing, (4) bearing, (5) disk, (6) shaft, (7) accelerometers, and (8) metal plate. Reproduced with permission from [108].
Download figure:
Standard image High-resolution imageTransformers are critical electrical equipment in power systems. Thus, it is essential to find potential transformer faults, study the fault diagnosis methods of transformers, and improve the safety of power systems. Due to the complex structure of transformers, the causes and phenomena of transformer failures are diversity and randomness. Therefore, effective methods must be adopted to comprehensively diagnose transformer failures. Presently, transformer fault diagnosis methods include the improved three ratio, characteristic gas, Rodgers ratio, fuzzy mathematics, neural network, etc [109]. However, these methods still have a lot of disadvantages in algorithms. For instance, the accuracy is not high enough and they require a large sample. Therefore, it is necessary to find an effective method for diagnosing the fault of the transformer. On the basis of this [110], uses the photoelectric sensors and discharge circuit acquisition modules to comprehensively diagnose the fault of the transformer, in other words, to diagnose the fault and determine the location of the fault by means of high-precision data fusion, achieving the purpose of unattended operation. The photoelectric multisensor information fusion technique can combine, coordinate, and supplement the information obtained by multiple sensors, thereby overcoming the uncertainty and limitations of a single sensor.
As shown in figure 28, the platform monitors the transformer failure by using the photoelectric infrared thermal imaging sensor to measure the transformer's internal temperature. A thermal infrared imaging sensor is a photoelectric conversion device, usually made of indium antimony or mercury compounds. It is used to receive infrared radiation energy, further convert it into electrical signals, and, after amplification, plasticity, and modulus conversion into digital signals, the image is finally displayed on a monitor. The grayscale value of each point in the image correlates to the radiation energy of the detected object at that point. The temperature of the infrared thermal sensor can be conveniently determined by receiving the radiation emitted from the surface of the measured object [111, 112].
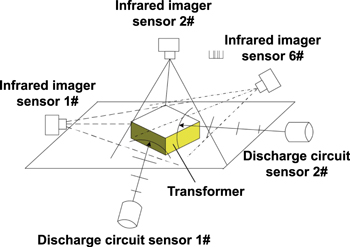
Figure 28. The schematic of the diagnosis setup with multisensor data fusion methods. Reprinted from [110], Copyright (2019), with permission from Elsevier.
Download figure:
Standard image High-resolution image3. Data fusion technology
Data fusion technology has become one of the hot research topics in the world. Data fusion refers to making full use of multiple information sources by combining redundant or complementary information from multiple information sources in space or time according to specific standards to obtain a consistent interpretation or description of the tested object so that the information system performs better compared to the system composed of each subset it contains [113]. The data fusion process synthesizes different sources of information with mathematical methods and technical tools in order to obtain high quality, useful information. Compared with the independent processing of a single source, the advantages of data fusion include improving detectability and reliability, expanding the range of spatiotemporal perception, reducing the degree of ambiguity of inference, improving detection accuracy, increasing the dimension of target features, improving the resolution of spatial questions, and enhancing the fault-tolerant ability of the system [114].
In recent years, multisensor data fusion technology has been widely used in both military and civilian fields. It has become a problem of concern to the military, industry, and high-tech developers [115]. This technology is widely used in command, control, communications, and intelligence (C3I) systems; complex industrial process control; robotics; automatic target recognition; traffic control; inertial navigation; ocean surveillance and management; agriculture; remote sensing; medical diagnosis; image processing; pattern recognition; and other fields [116]. Practice shows that compared to the single sensor system, using multisensor data fusion technology solves the problem of detection, targets recognition and tracking, enhances the system survival ability, improves the reliability and robustness of the whole system, improves the credibility of the data, improves accuracy, extends the time of the whole system, increases space coverage, increases real-time and information utilization, etc [117].
Complex industrial process control is an important field in which to apply data fusion. At present, data fusion technology has been applied in the measurement and fault analysis of ultraprecision industrial systems. The purpose of fusion is to identify the defects that cause an abnormal state of the system and trigger an alarm accordingly [118]. Generally, characteristic data is used for data fusion, and there are different analysis methods to extract characteristic data, such as time series analysis, frequency analysis and wavelet analysis. And then, the characteristic data is input into the neural network pattern recognizer for feature level data fusion. Furthermore, in order to identify the characteristics of the system data, the characteristic data is input into the fuzzy expert system for decision level fusion [114]. In the fuzzy expert system, domain knowledge rules and parameters are taken from the knowledge base and database to match and fuse with characteristic data. Finally, the operating state, equipment working condition, and fault of the tested system are determined [119].
3.1. Data fusion hierarchy
Based on the processing information source level, information fusion can be divided into data layer fusion, feature layer fusion, and decision layer fusion [120]. Data refers to the measurement data collected by sensors in each section. Characteristics are the data results and knowledge after analysis and transformation. Decision making refers to the conclusion of observing the target. The details are as follows.
3.1.1. Data layer fusion
Data layer fusion is the direct fusion of original data. Its input consists of various types of raw data provided by multiple sensors, and its output is the result of feature extraction or local decision-making. The advantages of data layer fusion are that more details can be extracted from the original data that is not found in other fusion layers [121]. The disadvantages include heavy computing burden, poor real-time performance, and the need for a good fault-tolerant ability to deal with the instability and uncertainty of sensor data itself, which is only applicable to the original data fusion of similar sensors. The methods mainly include the weighted average method, election decision method, Kalman filter method, mathematical statistics method, etc [122].
3.1.2. Feature layer fusion
Feature layer fusion extracts feature information of data sources for analysis and processing and retains enough important information to provide support for later decision analysis [123]. The advantages of feature layer fusion are that after extracting the original data information features, the amount of data to be processed is reduced and the real-time performance is improved. The methods mainly include Kalman filter, fuzzy inference, neural network, and production rule.
3.1.3. Decision level integration
As a kind of high-level fusion, decision-level fusion has high flexibility, strong anti-interference, good fault tolerance, and small communication bandwidth requirements [124]. First, the measurement data of the sensor are preprocessed to obtain a preliminary decision on the research object. Then, all local decision results are combined under certain rules to obtain the final joint decision results. Therefore, decision layer fusion requires compressing sensor measurements, which results not only in high processing costs but also the loss of a lot of detail. Decision-level fusion methods mainly include the Bayesian probabilistic inference method and Dempster–Shafer (DS) evidence inference method.
According to the above analysis, the three different levels of information fusion have their own advantages, disadvantages, and application scope. Typically, features are obtained by fusing the original data; and decisions are made using different fusions. Whatever the fusion strategy, the relevant information needs to be correlated and registered [125]. The difference is that the data is correlated and matched in a different order. Theoretically, the advantage of data layer fusion is that a large amount of original data can be retained to provide as detailed information as possible for the target and obtain as accurate a fusion effect as possible. Decision layer fusion does not rely on sensors. For a specific purpose, it is a system engineering problem to determine which level of integration to adopt. The comprehensive influence of the environment, computing resources, information source characteristics, and other factors should be considered comprehensively [126].
3.2. Classification of data fusion algorithms
Data fusion involves various theories and technologies, and there is no completely uniform algorithm that can adapt to all scenarios. Therefore, in application, corresponding algorithms should be selected according to different application backgrounds. The classification of algorithm concept is mainly divided into three categories: physical model algorithm, parameter-based algorithm, and cognition-model-based algorithm [127].
3.2.1. Physical model algorithm
This kind of algorithm directly calculates the entity characteristics according to the physical model [128]. The physical model predicting the physical features of an entity must be based on the physical features of the object to be recognized. Although this method is rarely used in practice, it is needed in basic research. The syntactic analysis method and the method of estimation theory belong to a typical physical model algorithm. The syntactic analysis method develops the grammar and syntax of physical objects, the physical objects that are obtained from the sensor data component (or the original information). It is, therefore, possible to aggregate object representations from this assumed structural relationship. Estimation theory includes the Kalman filter, maximum likelihood estimation, and least square method.
3.2.2. Parameter-based algorithm
The parameter classification algorithm is the most widely used and deeply studied algorithm. This algorithm seeks an identification specification and makes it dependent on parameter data, creating a direct image between the parameter data and an identification specification. This kind of algorithm can be further divided into algorithms based on statistics and information theory [129].
3.2.3. Statistical algorithm
Statistical algorithms mainly include the classical inference algorithm, Bayes inference algorithm, and DS evidence theory algorithm. The classical inference method [130] describes the probability of the observed data relating to the identification given the assumption that the object exists. For example, it is assumed that each recognized target type is Ai and the sensor is j. If n sensors measure m target types, the measurement model can be expressed as normal distribution in formula (1)

where xj is the actual measured observed value, and uij is the mean value of the target Ai to the sensor j, which can be obtained through historical data experience. Its limitation is that it can only estimate two hypotheses: a hypothesis and its alternative hypothesis. When multivariable data is encountered, the complexity of the algorithm increases. The validity of a prior density function is required, otherwise prior estimation cannot be directly used. The Bayes inference algorithm [131] solves some difficulties of classical inference methods. With the minimum risk cost as the basic model, it can update a hypothetical likelihood function given a prelikelihood estimate and additional evidence (observation).
First, suppose there are n sensors to obtain parameter data of an unknown target. Each sensor provides a description of the target's identity based on sensor observations and a specific sensor classification algorithm. All possible m targets are represented by O1, O2, O3...Om, Di represents the ith sensor's description of the target's identity, and O1, O2, O3...Om actually constitutes the incompatible hypothesis of the observation space. It has formula (2):

where P(Oi) is the prior probability that Oi is true and
where P(Oi∣Di) is the probability of Oi is true and that Di is known; P(Di∣Oi) is the probability of Di if Oi is true.
The disadvantage of Bayes inference is that it is difficult to define a priori likelihood. It is complicated when there are multiple possible hypotheses and multiple conditions. The assumptions that require opposition are incompatible with each other. DS evidence theory [132] is a generalized extension of Bayes theory, which takes into account the degree of total uncertainty. The DS method uses probability interval and uncertainty interval to determine the likelihood function of a hypothesis under multiple evidence. When all hypotheses are incompatible and complete, the Bayes inference technique and DS method produce the same results.
Assuming that m1, m2, m3...mn are trust allocation functions and focal elements are Ai(i = 1, 2, 3...N), then the DS synthesis rules are as follows in formula (4):

where K is the conflict coefficient.
Figures 29(a) and (b) are images of solar cell surface defects taken by 450 and 500 nm multispectral cameras. Image fusion is carried out with the above algorithm. The results are shown in figure 29(c). The algorithm suppresses the influence of the complex background of polysilicon solar cells on the reliable extraction of surface defects and enhances the defect characteristics. Through the fusion of multispectral images, the contrast of the defect part was improved, and the defect information on a fingerprint and a scratch on the solar cell was enhanced.
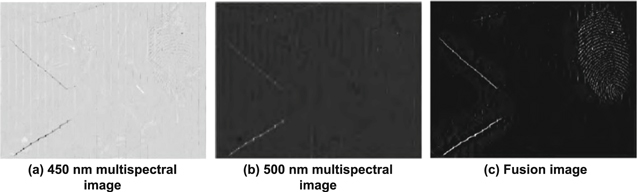
Figure 29. Defect image fusion of solar cells. Reproduced with permission from [133].
Download figure:
Standard image High-resolution imageThe problem with the DS method is that it cannot deal with contradictory evidence effectively. The amount of computation is increasing exponentially. When the chain of reasoning is long, it is inconvenient to use evidence theory. The DS combination rule has combination sensitivity, but sometimes even a small change in the basic probability assignment may lead to a big change in the result.
3.3. Fusion algorithm based on information theory
In some cases, multisensor data fusion target recognition does not need to directly simulate the random form of observation data by statistical method but relies on the mapping relationship between observation parameters and target identity to identify the target. This kind of method is called fusion recognition algorithm based on information theory, which includes the neural network method [133, 134], entropy theory method [135], and clustering algorithm [136] and voting method [137].
An artificial neural network is proposed on the basis of research results of modern neuroscience. The neural network target recognition method is a nonlinear network system composed of interconnection of very simple computational processing units (neurons), with learning, memory, computing power, and various intelligent identification and processing capabilities. All neurons can perform large-scale parallel computation without an external synchronization signal. The most famous neural network target recognition algorithm is the forward multilayer neural network based on adaptive signal processing theory and its back learning algorithm. With the continuous development, Kaiming He et al [138] proposed a residual neural network (ResNet), which is mainly manifested by taking the characteristic graph obtained by adding the input and output of the network as the final output of the structure on the basis of a shallow network. Adding such a structure into the network cannot only increase the depth of the network but also keep the network performance from degrading. Theoretically, the appearance of ResNet greatly improves the depth of the neural network that can be trained; and optimization of network performance is more free. ResNet is shown in figure 30.
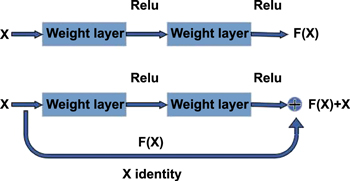
Figure 30. The traditional structure and residual structure of a neural network. Reproduced with permission from [138].
Download figure:
Standard image High-resolution imageAs can be seen from figure 30, which compares traditional training methods with a network trained by the residual model, small defect areas on the surface of the magnetic tile can be better identified by the residual model, as shown in the blue circle in figure 31. In addition, the improved network can also improve the mismarking of the texture of the magnetic tile itself, as shown in the yellow circle in figure 31.
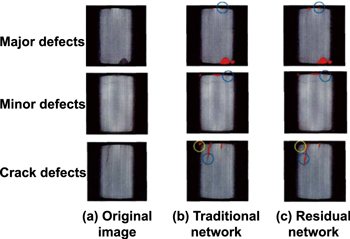
Figure 31. Two kinds of neural network methods of detecting the surface defect segmentation effect in magnetic tile. Reproduced with permission from [138].
Download figure:
Standard image High-resolution imageThe entropy method is a new technique for fusion systems. The probability of event occurrence is used to reflect the idea of information. Its principle is that the things that often happen have the lowest entropy, while the things that do not often happen have the highest entropy. When applied to the sensor data fusion process, it is necessary to draw the conclusion that the entropy is extremely high. It is assumed that the probability  of all measured values and the probability
  of eigenvalues are known, and the conditional probability distribution
  can be obtained by the calculation method. Formula (5) provides the fusion method based on the input value of minimum conditional entropy:

In the formula,  represents the set of basic hypothesis target,
  represents the set of measured values meeting the minimum conditional entropy standard, and
  is the joint probability distribution between the measured value and the feature. The fusion system under this criterion can obtain the best fusion information [139]. The entropy method has great application value, especially for systems with high real-time requirements. The entropy method is attractive when accurate prior statistics are not available, or when overall cost-effectiveness is considered. Foreign countries have started to use the entropy method to calculate the measurement value of information content associated with a hypothesis.
A clustering algorithm is used to gather a large number of multidimensional data samples into categories so that the similarity of samples within a category is the largest, but the similarity of samples in different categories is the smallest. Cluster analysis is a heuristic algorithm that is effective in iconic applications where the number of pattern classes is not precisely known. Clustering analysis can be used as a separate tool to discover some deep, implicit, and useful information about the distribution of data in the database and to summarize the characteristics of each category or to focus on a particular class for further analysis. For instance, k-means clustering aims to partition n objects into k clusters in which each object belongs to the cluster with the nearest mean. This method produces exactly k different clusters of the greatest possible distinction. The best number of clusters k leading to the greatest separation (distance) is not known a priori and must be computed from the data. The objective of k-means clustering is to minimize total intracluster variance or the squared error function, as shown in formula (6).

where, J is the objective function, k is the number of clusters, n is the number of cases,  is the case i, cj is the centroid for cluster j, and
  is the distance function [139].
Similar to voting in daily life, the voting method is the simplest technique in multisensor data fusion target recognition algorithms. Each sensor provides a judgment on the state of the object under test, which is then searched by a voting algorithm to find a judgment 'agreed' on by more than half of the sensors and the vote is announced. Weighting methods, threshold techniques, and other judgment methods can also be used, which are very useful when there is no accurate prior statistical data available, especially for real-time fusion.
3.4. Fusion algorithm based on cognition model
The algorithms based on the cognition model mainly include the logical template method, fuzzy set theory algorithm, genetic algorithm, and knowledge system method.
3.4.1. Logical template method
The logical template method is essentially a method of matching recognition, which matches a predetermined pattern of the system with the observed data to determine whether the conditions are satisfied and then makes an inference. A predetermined pattern can contain logical conditions, fuzzy concepts, observed data, and uncertainties in the logical relationships used to define a pattern. Therefore, the template is essentially a comprehensive parameter pattern method that represents and matches logical relations [140]. As a kind of logical template method, the decision template method is a simple and intuitive decision-level fusion target recognition algorithm. The classical decision template method does not make full use of prior information on each sensor's ability to identify different kinds of targets. Zhang et al [141] proposed to modify the decision template method by using the average measurement entropy of sensors to reasonably measure the ability of multiple sensors to classify and identify different kinds of targets. The simulation results showed that the improved decision template method could improve the correct target recognition rate.
The modified decision template method fusion recognition process diagram is shown in figure 32. The part in the dotted box is not available in the classic decision template method. The modified matrix is applied to modify the decision distribution diagram of the target, so as to reflect the ability of the sensor to classify and identify specific kinds of targets to obtain the decision distribution diagram of the modified target. The maximum similarity category is selected as the output, and the decision distribution map of the unknown target is classified to realize the fusion target recognition.
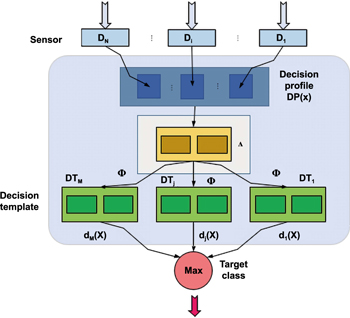
Figure 32. The modified decision template method fuses the identification block diagram. Reproduced with permission from [141].
Download figure:
Standard image High-resolution image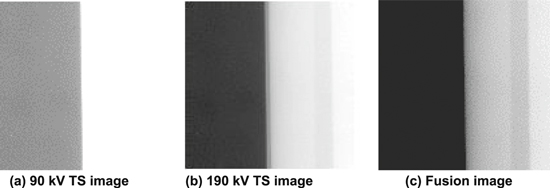
Figure 33. Image fusion results of the titanium alloy edge erosion effect. Reproduced with permission from [142].
Download figure:
Standard image High-resolution imageThe paper aimed at the defects of the classic decision template method that it cannot reflect the sensor for the classification of the same target identification ability, cannot adapt to the feature vectors to identify the target fluctuation change, and cannot retain all the information of training samples at the same time. It put forward the method based on entropy and the K nearest-neighbor correction decision template method. The decision template for the target of category j, formula (7), can be obtained:
and

 is the average measurement entropy of the ith sensor for the jth target. The weight of each local sensor is adjusted, and the optimization objective is to minimize the sum of the squares of
  The minimization problem can be described as follows in formula (9):

Then write the resulting weighted value  in matrix form:

where  is called the correction matrix. For the target identified, the decision distribution map DP(x) of target x is obtained according to the recognition results output by each sensor. Thus, the modified decision profile of the target can be obtained in formula (11)

Figure 33 presents the image fusion results of the titanium alloy edge erosion effects. The multiple sensor fusion target recognition performance is greatly improved.
3.4.2. Fuzzy set theory algorithm
Due to the complexity of the environment, noise interference, the instability of the recognition system, and the influence of different recognition algorithms, the target signal and the extracted characteristic parameter information are inaccurate, incomplete, and unreliable. In addition, there is subjective fuzziness in the judgment method of object recognition. Fuzzy set theory is a powerful mathematical tool to solve such problems. The abundant fusion operators and decision rules in fuzzy set theory provide the necessary means for effective target fusion processing. In recent years, some scholars have begun to apply fuzzy set theory to the problem of object identification. Kewley [143] used fuzzy logic to fuse multisensor data for target identification based on electronic reconnaissance data. Based on the possibility theory of fuzzy set theory, Roux et al [144] conducted multispectral satellite image fusion to solve the image classification problem.
Yang et al [145] established a decision-level fusion model of multisensor target recognition by using the fuzzy synthesis function in fuzzy set theory. According to the probability distribution of accumulated target recognition of each sensor at moment k, the probability distribution of M sensors is fused by the fuzzy synthesis function; and the probability distribution of accumulated target recognition and fusion of the sensor system up to moment k can be obtained as follows:

where ![${S}_{M}:{\left[0,1\right]}^{M}\to \left[0,1\right]$](https://content.cld.iop.org/journals/2631-7990/2/2/022001/revision2/ijemab7ae6ieqn13.gif) represents the fuzzy synthesis function. The result of sensor target recognition is described by probability distribution, and the target recognition and fusion algorithm based on fuzzy synthesis function is realized.
represents the fuzzy synthesis function. The result of sensor target recognition is described by probability distribution, and the target recognition and fusion algorithm based on fuzzy synthesis function is realized.
Liu et al [146] introduced fuzzy measure and fuzzy integral into multisensor data fusion target recognition. It gave the general technical route of fuzzy integral applied to decision-level data fusion target recognition and provided the measurement method of information source importance.
For a finite discrete set 
![$h:X\to \left[0,1\right]$](https://content.cld.iop.org/journals/2631-7990/2/2/022001/revision2/ijemab7ae6ieqn15.gif) satisfies the condition:
satisfies the condition:  The fuzzy integral is as follows in formula (13)
Among them,

Applied to the information fusion target recognition,  represents the target judgment result provided by source
  and
and  represents the important process of the source.
A multiple source, multilevel adaptive variable weight fuzzy algorithm of multisensor target fusion was proposed by [146] and provides a kind of expression and effective method of dealing with uncertain information, makes full use of the sensor information redundancy and complementarity, and is the source of reliability of the information itself to achieve a good recognition effect.
Figures 34(a) and (b) are the microscopic image of the stone surface taken by adjusting the focal plane of the microscope lens, while figure 34(c) is the stone surface image taken by the charge-coupled device camera. Image fusion is carried out with the above algorithm. The results are shown in figure 34(d). The algorithm is used to achieve microimage fusion, and an approximate full focal image is obtained. The limitation of depth of field of the image sensor can be solved effectively. It can solve the limitation of the field depth of the image sensor and could obtain accurate and complete feature information of the measured object surface.
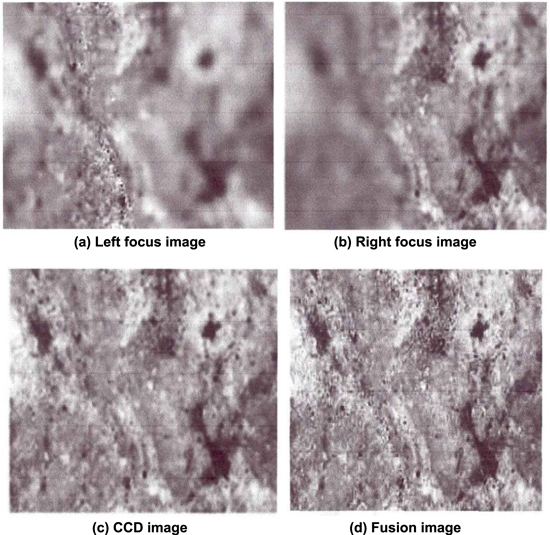
Figure 34. Image fusion results of surface morphology of stone plate. Reproduced with permission from [147].
Download figure:
Standard image High-resolution imageDifferent types of sensors in the same work environment with the ability to identify different algorithms take into account the fuzzy set theory's importance of the information source, reflect objective reality, and result in better fusion recognition than DS evidence theory. Compared with the DS evidence theory, the fuzzy integral domain problem does not involve recognition framework in theory but is beneficial to increasing the recognition framework and improving the practicality of the fusion system.
3.4.3. Genetic algorithm
The genetic algorithm is a population optimization process that starts from a set of initial values for optimization. The optimization process is a process of the population's continuous reproduction, competition, inheritance, and variation [148]. In [149], the genetic algorithm and neural network classifier are combined, as shown in figure 35, by identifying the resulting feedback and control characteristics of the genetic evolution direction of the genetic algorithm to realize optimization and overcome the premature convergence problem of the genetic algorithm and put forward some choice and a combination of adaptive genetic operators to improve the genetic algorithm. The experimental results verify the effectiveness of the method.
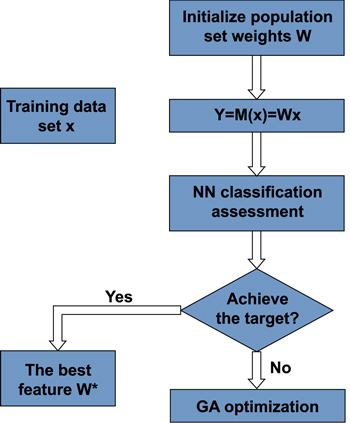
Figure 35. Feature optimization method based on the genetic algorithm. Reproduced with permission from [149].
Download figure:
Standard image High-resolution imageFigures 36(a)–(d) are microscopic images of surface cracks on a steel plate taken by adjusting the focal plane of the microscope lens. The results are shown in figure 36(e). The algorithm is used to achieve microimage fusion, and an approximately full focal image is obtained. It can reflect the sample surface information clearly and eliminate the effect of depth of field. Then the depth information can be obtained through the focal length of the image, and the three-dimensional reconstruction of the two-dimensional image can be realized. Finally, the length, width, and depth information of the workpiece crack can be measured.
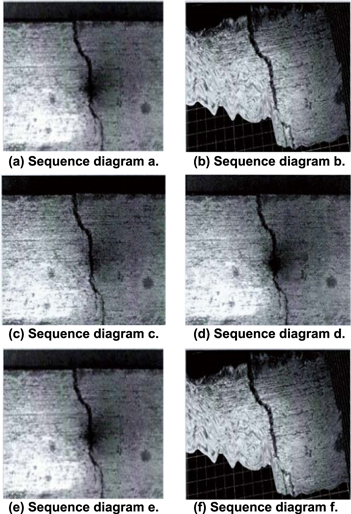
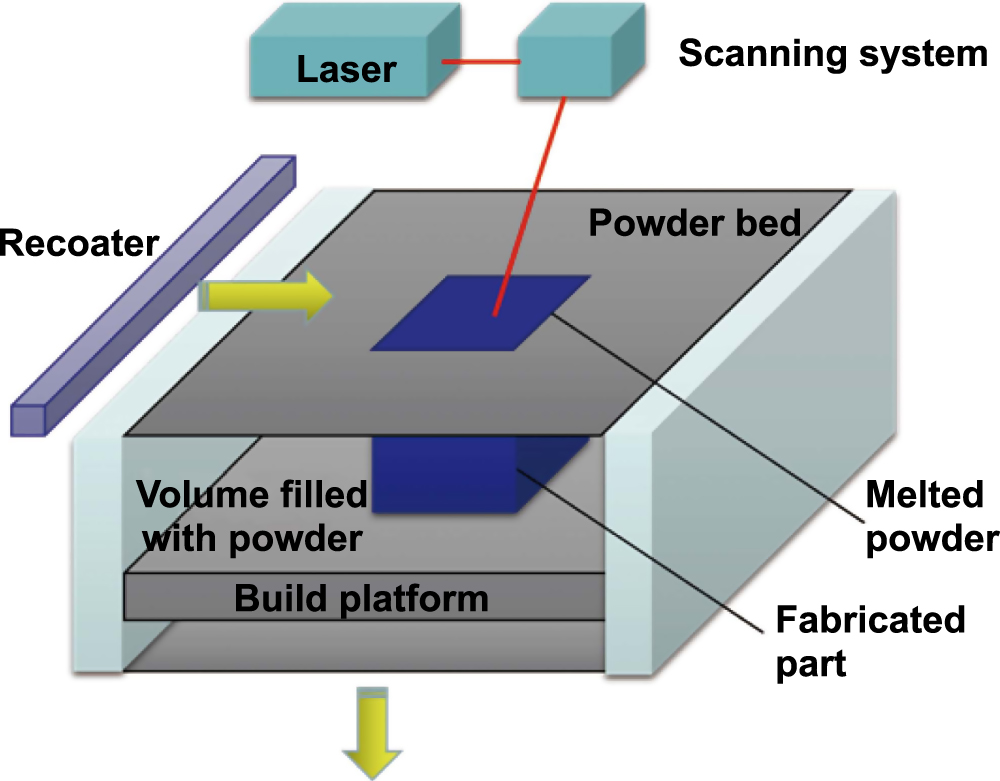
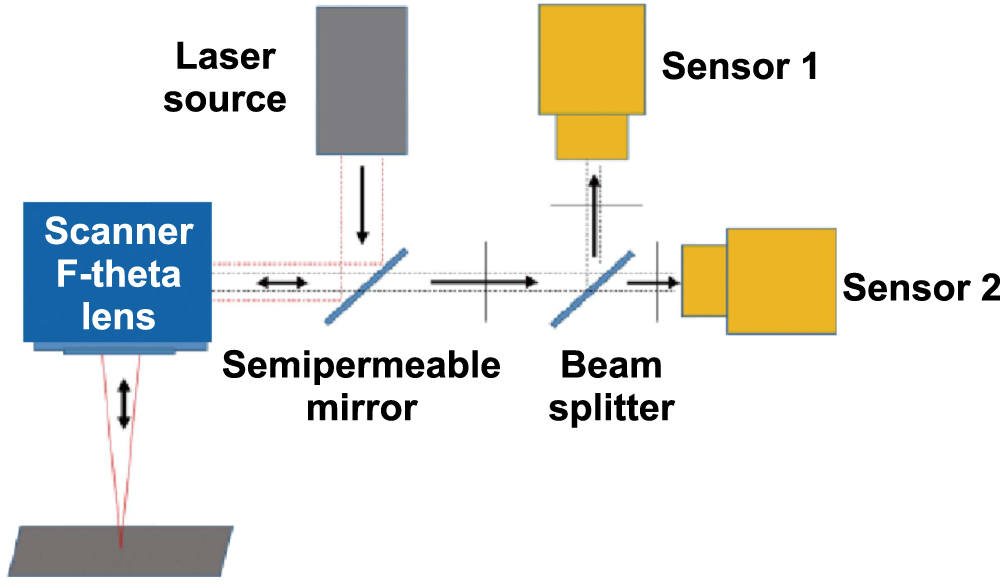
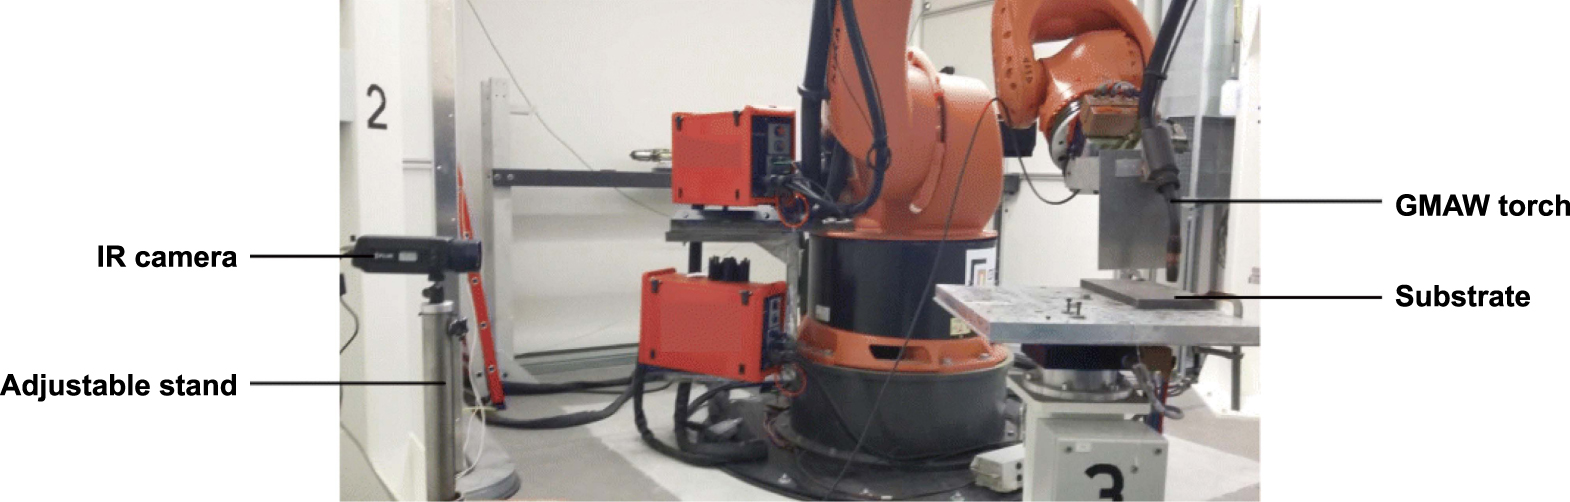
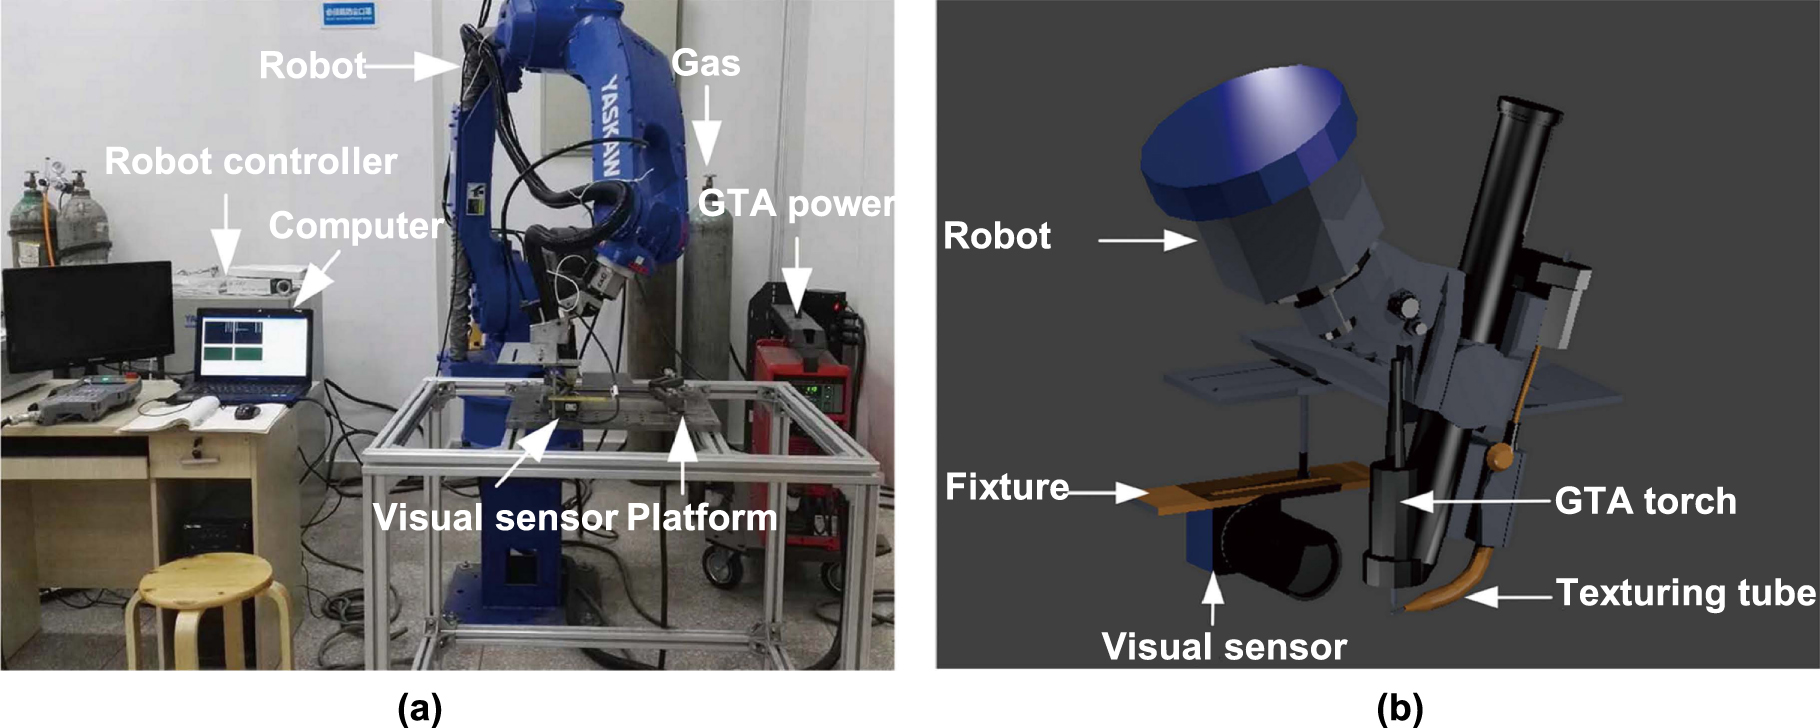
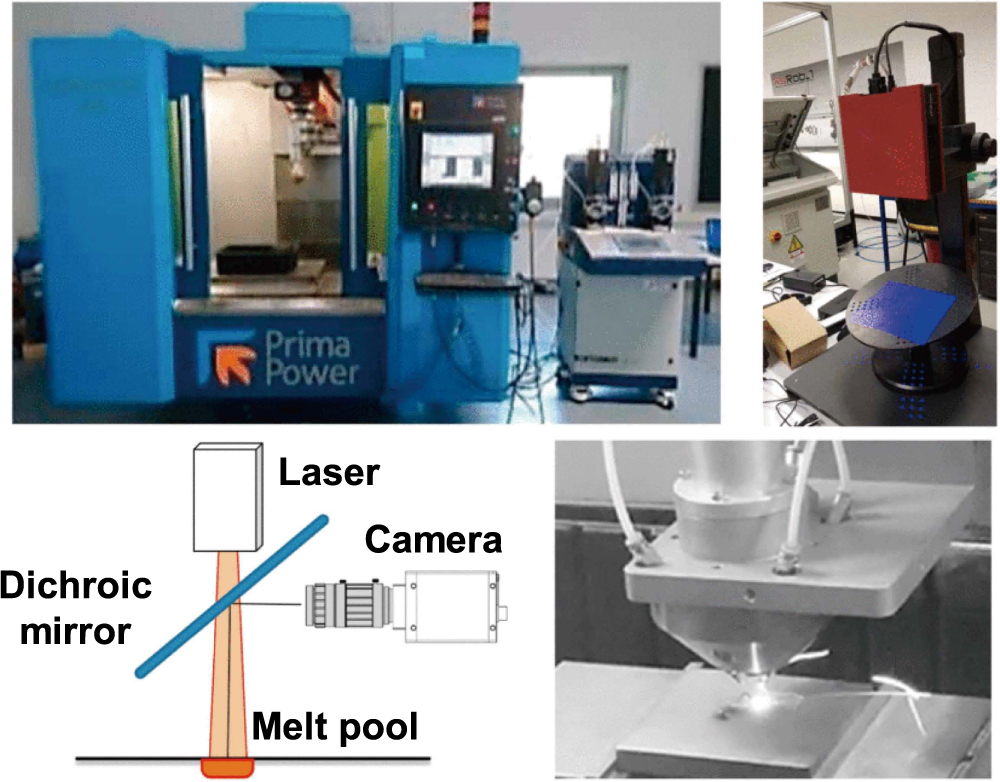
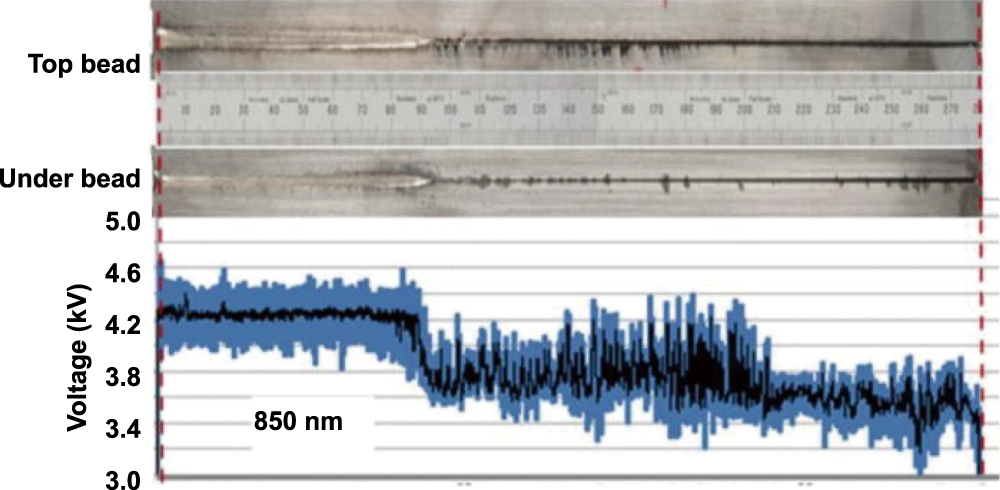
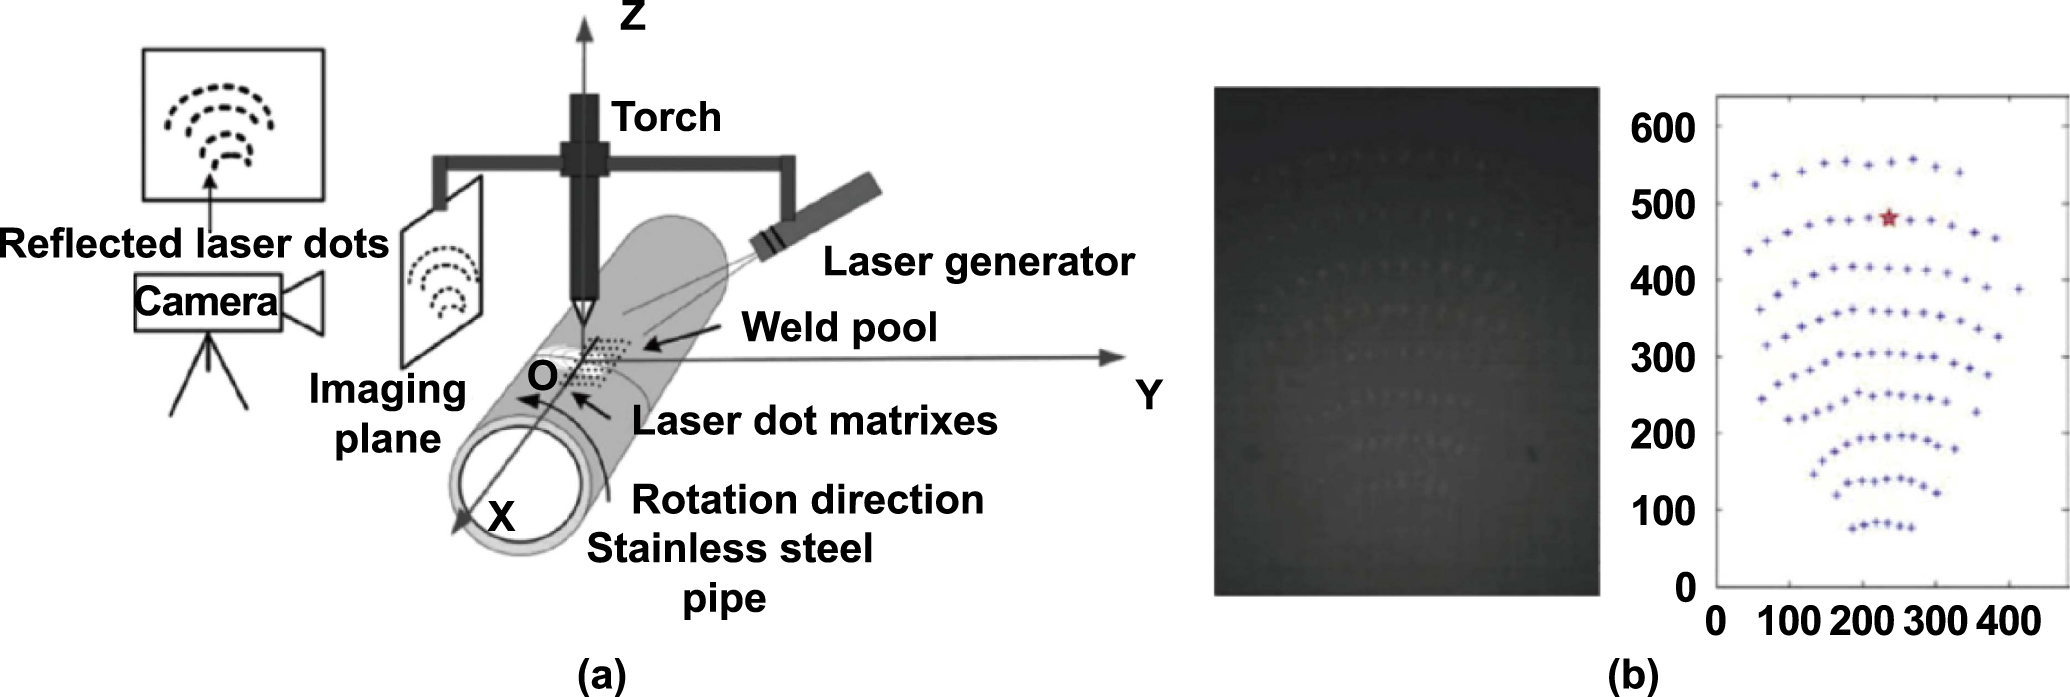
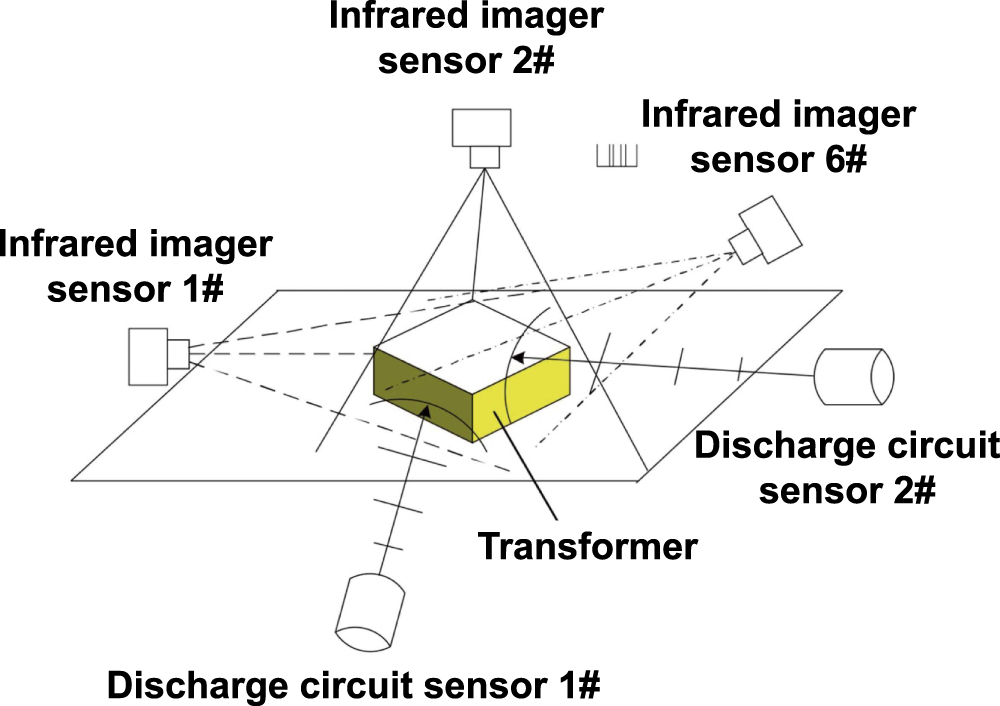
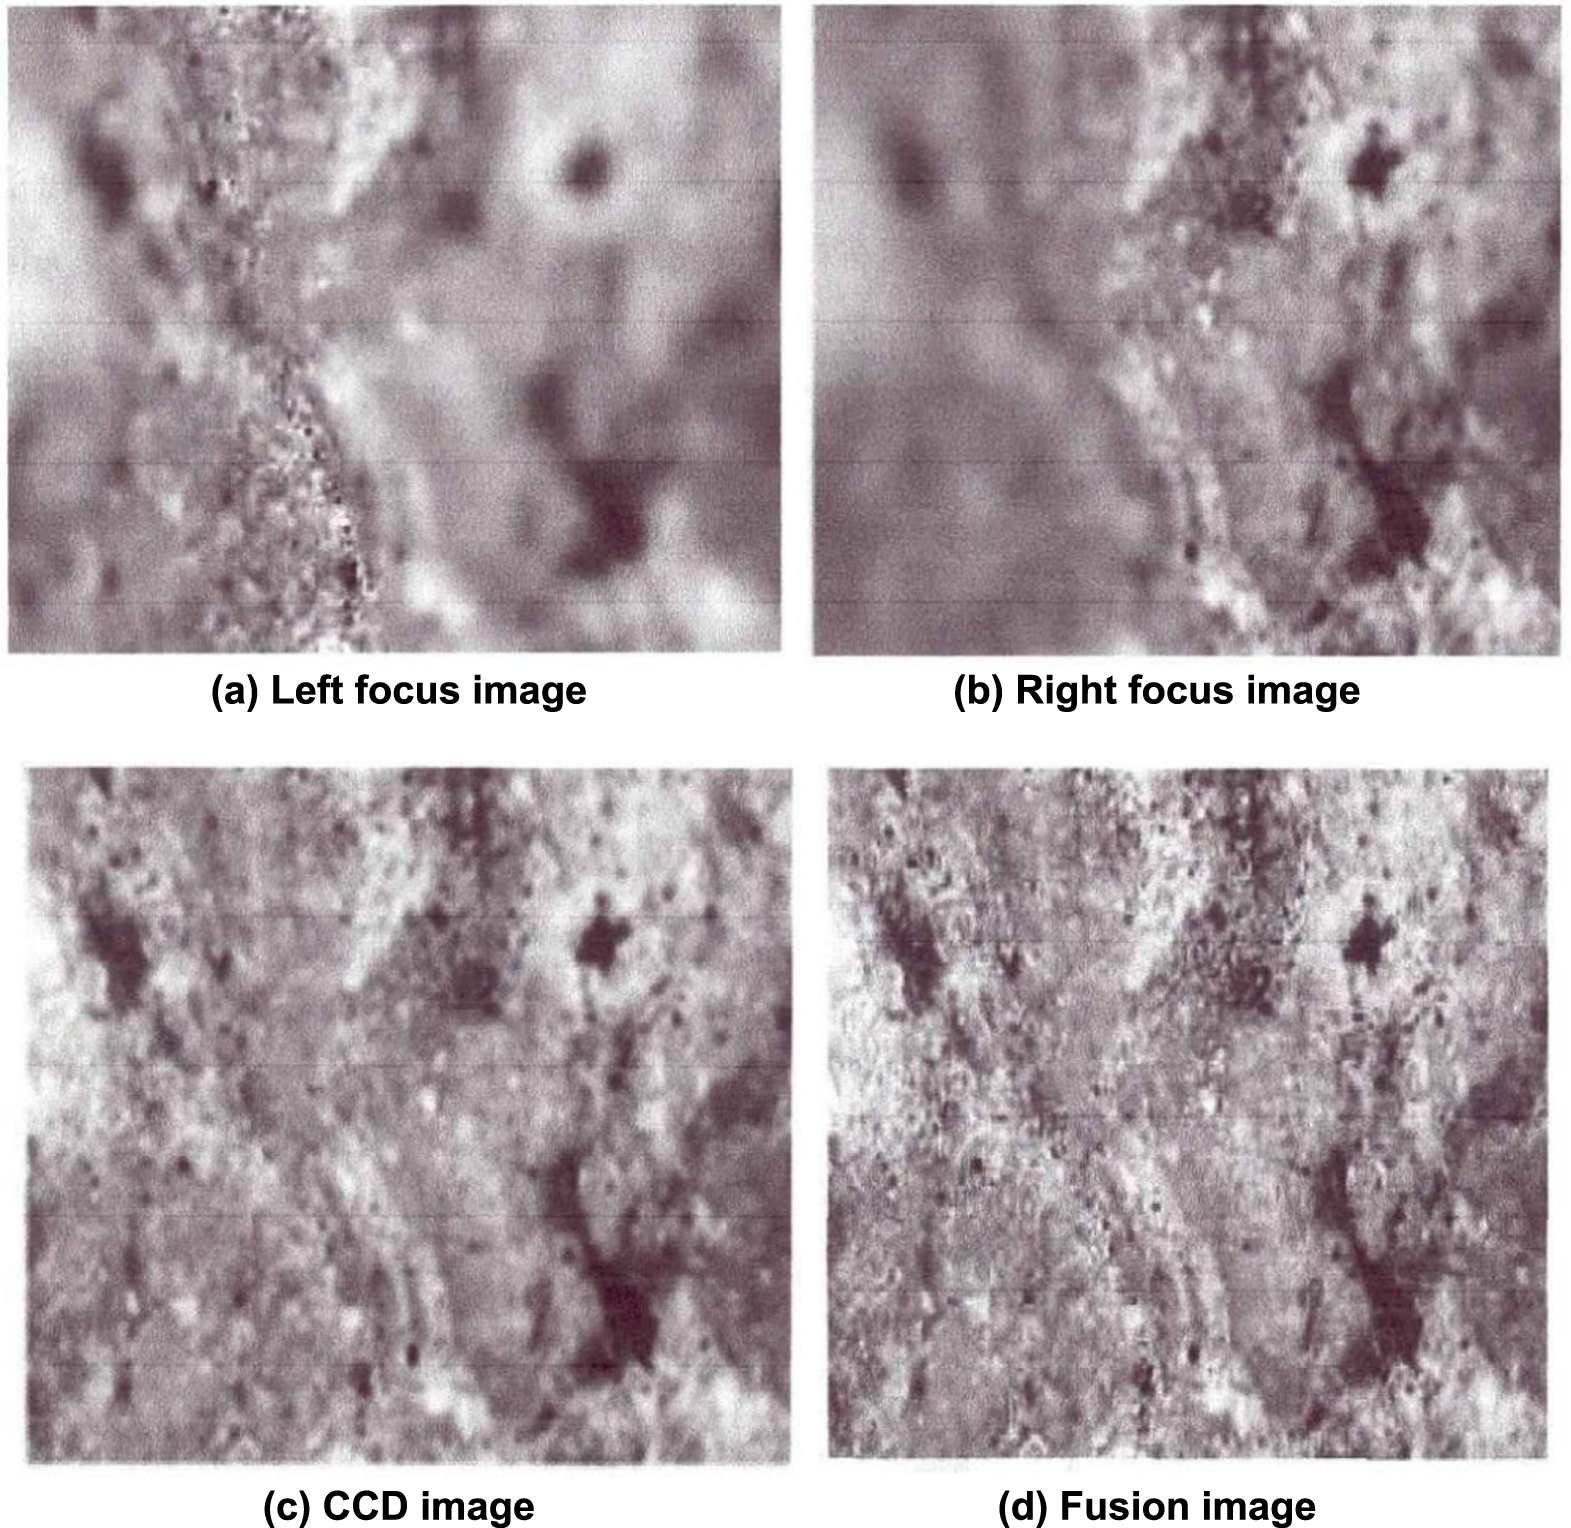
Figure 36. Image fusion result of the surface crack on the steel plate. Reproduced with permission from [150].
Download figure:
Standard image High-resolution image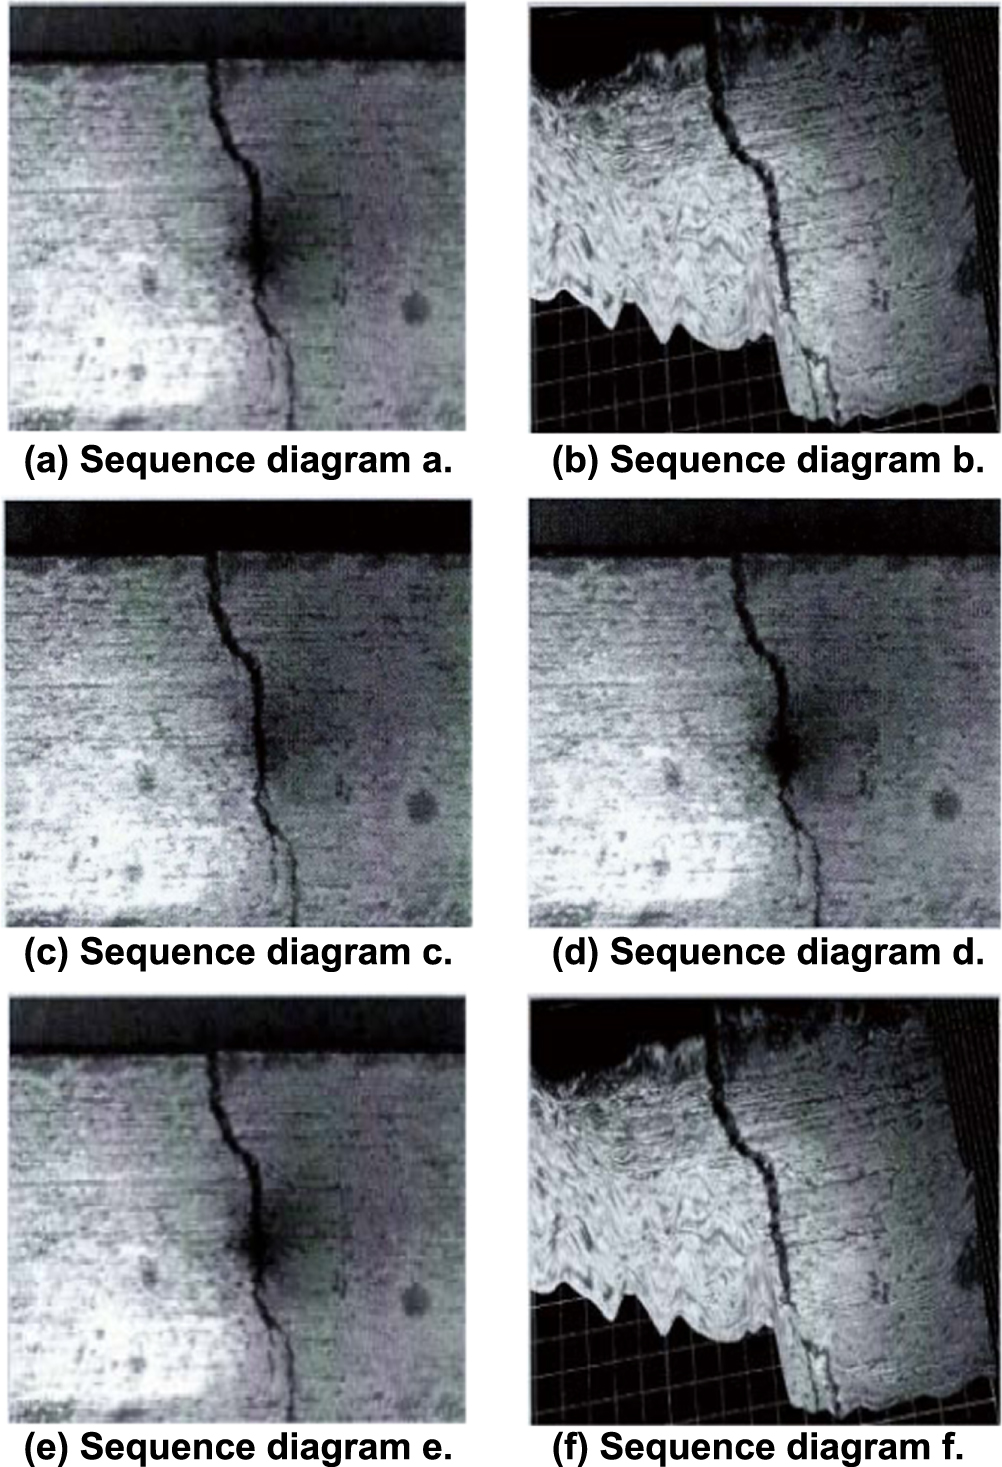
3.4.4. Knowledge system method
The knowledge system method uses the knowledge of some objective objects and characterizes this knowledge through attributes. If the attribute characteristics of a set of objects can be given, the set of objects represents a kind of complete knowledge [151]. Fisch et al [152] took process safety management and ontology as the core to build a modeling framework for a knowledge system and divides the structural elements of the knowledge system in the application domain into demand ontology, concept ontology, method ontology, control knowledge, and interpretation knowledge. The method of [153] also incorporates the concepts of ontology and ontology into multiagent modeling. It discusses the knowledge ontology structure maintenance and management mechanism and system and system modeling for exploring knowledge integration in an effective way. Based on the knowledge system of multisensor data fusion target recognition, algorithm research provides a clear and effective way of thinking.
4. Future trends
At present, the multifunctional sensor has become an emerging research area, and researchers are trying to design a single unit of multifunctional sensor that is able to provide multiple measurements. Furthermore, the utilization of the multifunctional sensor is beneficial as it can occupy less space and reduce the cost, although it has reliability issues. Multifunctional sensors have been increasingly used in a variety of applications ranging from environmental, biomedical, mechanical, electrical fields, etc. Some significant work has been undertaken in multifunctional sensors in material science as well as in electrical engineering.
Data fusion technology, together with multisensory or multifunctional sensor technology, is ascending. Almost all information processing methods can be applied to a data fusion system. With the rapid development of modern technology, such as sensor technology, data processing, computers, network communication, artificial intelligence, parallel computing software and hardware, etc, new data fusion methods will be demanding and emerging and will become the core technology for future industrial complex multisensor data fusion systems for intelligent detection and data processing. The application field will continue to expand. Multisensor data fusion is not a single technology but an interdisciplinary comprehensive theory and method. This is a new research field, still in the process of constant change and development.
However, there is still no unified fusion theory and effective generalized fusion model and algorithm for data fusion. The research on specific methods of data fusion is still in the preliminary stage. The problem of fault tolerance or robustness in a fusion system has not been solved. The ambiguity of association is the main obstacle in data fusion. There are still many practical problems in the design of a data fusion system.
In order to ensure the reliability of a multisensor process monitoring system and the data fusion results, unified fusion theory, data fusion architecture, and a generalized fusion model should be proposed. Related problems should be solved, such as data registration, data preprocessing, database construction, database management, human-machine interface, general software package development, etc, and a data fusion system oriented to specific application requirements with mature auxiliary technology should also be established. Artificial intelligence technologies, such as neural network, genetic algorithm, fuzzy theory, and expert theory, will be introduced into the field of data fusion. Integrated computational intelligence (e.g. fuzzy logic + neural network, genetic algorithm + fuzzy + neural network, etc) will be used to improve the performance of multisensor fusion. The expression and reasoning calculus of uncertain factors will be solved, e.g. introducing the concept of a gray number. Relevant prior data are used to improve the performance of data fusion, and more advanced and complex fusion algorithms (in unknown and dynamic environments, research on multisensor integration and fusion methods with parallel computer structure) should be studied. Under the application background of multiplatform/single platform and heterogeneous/homogeneous multisensors, the data processing model and algorithm with low computational complexity can meet the requirements of the task. A data fusion testing and evaluation platform and multisensor management system need to be established. The existing fusion methods should be standardized, and processing hardware should be developed to provide multiple complex fusion algorithms to complete the fusion in real time while data are acquired.
5. Conclusions
This paper presented an overview of multisensor process monitoring systems and data fusion technology. Generally, single sensors can only obtain part of the information segment of the environment. Integrated and fused multisensor information has the following four characteristics: abundant, complementary, real time, and low cost. Multisensor information fusion technology has prospects for broad application in the fields of industrial robotics, aerospace, military, multitarget tracking, numerical control technology, and intelligent manufacturing. In this investigation on multisensor systems, several applications of multisensor systems in different research fields were identified. Furthermore, with the development of modern technology, such as sensors, big data and cloud processing, computer software and hardware, and artificial intelligence, multisensor data fusion and target recognition will become the focus of future target recognition research. On the premise of introducing the target recognition principle of multisource data fusion and the theoretical basis of its algorithm, the target recognition algorithm of multisensor data fusion was summarized in detail from the perspective of algorithm concept classification, which provides a certain theoretical basis for the next research on target recognition of multisensor data fusion.
Acknowledgments
The authors would like to express their sincere thanks for the financial support from Shanghai Science and Technology Committee Innovation Grand (Grant Nos. 19ZR1404600, 17JC1400601), National Key R&D Program of China (Project Nos. 2017YFA0701200, 2016YFF0102003), and Science Challenging Program of CAEP (Grant No. JCKY2016212A506-0106).