
Abstract
Natural gas is a transport fuel which may help reduce greenhouse gas emissions in shipping and trucks. However, there is some disagreement regarding the potential for natural gas to provide significant improvements relative to current ships and trucks. In 2015, road freight represented ~7% of global energy related CO2 emissions, with international shipping representing ~2.6% of global emissions. These emissions are also expected to grow, with some estimates suggesting road freight emission growing by a third, and shipping emissions growing by between 50% and 250% from 2012 to 2050, making absolute emissions reductions challenging. In addition, reducing emissions in ships and trucks has proved technically difficult given the relatively long distances that ships and trucks travel.
This paper documents a systematic review of literature detailing well-to-wheel/wake greenhouse gas emissions and economic costs in moving from diesel and heavy fuel oil to natural gas as a fuel for trucks and ships. The review found a number of important issues for greenhouse gas reduction. First, moderate greenhouse gas reductions of 10% were found when switching to natural gas from heavy fuel oil in shipping when comparing the lowest estimates. Comparing lowest well-to-wheel greenhouse gas emissions estimates for trucks, the benefit of switching to natural gas fuel is approximately a 16% reduction in greenhouse gas emissions. However, these emissions are highly variable, driven particularly by methane emissions in exhaust gas. Given this, in the worst cases natural gas ships and trucks emit more greenhouse gasses than the diesel trucks and heavy fuel oil ships that they would replace. It appears relatively cost effective to switch to natural gas as a transport fuel in ships and trucks. However, the limited emissions reduction potential raises questions for the ongoing role of natural gas to reduce greenhouse gas emissions in line with the challenging greenhouse gas reduction targets emerging in the transport sector.
Export citation and abstract BibTeX RIS
1. Introduction
Emerging regulations and targets focussed on freight trucks and international shipping require significant reductions in greenhouse gas (GHG) emissions [1, 2]. International shipping is now required to reduce GHG emissions by at least 50% by 2050, and Europe have adopted new truck emissions regulations requiring a 30% emissions reduction in new vehicles by 2030 [1, 2]. Natural gas, which is largely methane (CH4), can be used as a transport fuel and may help reduce these emissions. However, there is some disagreement regarding the potential for natural gas to provide significant improvements relative to current types of ships and trucks. Road freight represents ~7% of global energy related CO2 emissions and international shipping representing ~2.6% of global emissions in 2015 [3, 4]. These emissions are also expected to grow, with some estimates suggesting road freight emission growing by a third, and shipping emissions growing by between 50% and 250% by 2050, largely through increased service demand, making it challenging to deliver absolute emissions reductions [3, 4]. In addition, reducing emissions in ships and trucks has proved technically difficult relative to other forms of transport given the relatively long distances that ships and trucks travel [5].
Natural gas combustion results in ~25% lower CO2 emissions than diesel truck fuel combustion, and ~30% lower CO2 emissions than combustion of heavy fuel oil typically used in international shipping [6]. However, natural gas engines may not be as efficient as diesel or heavy fuel oil engines, and additional GHG emissions may occur throughout end-use and the supply chain, both effecting total GHG emissions and reducing the potential benefit of switching to natural gas as a fuel. In particular, methane can be emitted in the exhaust gas of natural gas engines (methane slip) and through emissions of natural gas from the vehicle/vessel or throughout the supply chain from gas production to end users. Methane is an important GHG, 34 times more impactful on global temperatures than CO2 using a global warming potential over a 100 year timeframe [7]. Consequently, even small quantities of methane emissions may have a significant impact on total GHG emissions.
This paper presents the findings of a systematic review of the existing evidence surrounding natural gas as a fuel for trucks and ships, examining the technical issues, emissions and costs associated. Details of the systematic review process are covered by Sorrell [8]. The systematic review uncovered over 200 items of evidence covering a range of issues. The findings are presented in the context of the alternative options, including the continued improvement of incumbent diesel technologies, along with battery electric and hydrogen systems.
2. Definitions and scope
2.1. Definition of trucks and ships
This paper focuses on the use of natural gas as a transport fuel. Biomethane is a closely related fuel that can be used in methane burning engine s to potentially reduce greenhouse gas emissions further than estimates contained in this paper. However, biomethane is not covered in this report, and more information on this option can be found in [9].
2.1.1. Trucks
The definition of a truck varies significantly across regions. Typically truck classifications are determined by weight, with differing regimes used in different regions, including the United States, Europe, China and Japan [3]. Typically, the smallest truck class starts at 3.5 tonnes. In principle, trucks in this classification and above may use current natural gas engine technologies and are focussed on in this study.
2.1.2. Ships
There are a number of different types of ships operating in the international shipping market, though these classifications are less formalised. Ships may be designed to transport different types of cargo, such as shipping containers, bulk commodities, oil, liquefied natural gas, wheeled vehicles etc. Ships may also be different sizes, designed for specific capacities to match their intended markets, or designed for specific routes, such as routes which navigate specific canals. This study focuses on ships described in the literature as engaging in the international shipping market, as is common in the statistical literature [10, 11].
2.2. GWP
In the analysis below a Global Warming Potential (GWP) 100 year equivalent value of 34 is used to equate methane and CO2 emissions, in line with the Intergovernmental Panel on Climate Change (IPCC) Assessment Report 5 (AR5) [12]. In the analysis below a Global Warming Potential (GWP) 100 year value of 34 is used to equate methane and CO2 emissions, as per the Intergovernmental Panel on Climate Change (IPCC) Assessment Report 5 (AR5). This value includes indirect warming effects but does not allow for the eventual oxidation of methane to CO2. Note that the selection of the time frame (100 years) has a large impact on this value and on the results when comparing fuels with different emission profiles [13], but this sensitivity is not within the scope of this paper.
2.3. Scope
The analysis discussed in this paper focuses on the following questions:
- What technical issues arise when considering a transition to natural gas as a truck or ship fuel;
- What GHG emissions arise from natural gas as a ship or truck fuel;
- What is the contribution of methane emissions;
- What supply chain emissions arise in the fuel life cycle; and
- What are the cost implications of switching to natural gas as a fuel in ships and trucks?
3. Context
3.1. Trucks
Emission in the road freight sector are growing. Road freight fuel is dominated by diesel and energy consumed in this sector growing by 50% between 2000 and 2015 [3, 14]. This growth is expected to continue in the future, with growth in global freight volumes expected to increase by 70% by 2030 [15]. Energy and emissions in the road freight sector are also mostly produced by the largest vehicles. For example, in Europe, ~80% of all freight tonne-kilometres come from trucks over 30 tonnes maximum laden weight. Trucks of this size are amongst the hardest road vehicles to reduce emissions from given the energetic requirements of heavy loads and long distance between refuelling.
The majority of commercial trucks use diesel compression ignition internal combustion engines, which can provide the power and energy density to meet the requirements of heavy goods transportation over long distances. To use natural gas in these trucks requires different types of engine, and the characteristics of these engines impact GHG emissions and costs. These engine types can be summarised as:
3.2. Ships
International shipping is involved in the transport of an estimated 90% of global trade [24]. In 2017, there were over 50 000 merchant vessels globally [25]. The United Nations Conference on Trade and Development estimated that merchant shipping contributed US$380 billion in freight revenue, nearly 5% of total global trade [26]. The value of goods traded represented approximately 10% of GDP at the beginning of the 20th century, growing to approximately 25% in 2014, more than keeping pace with global GDP growth [27].
The international shipping fleet can be described through several characteristics. One important aspect is the age profile of the fleet as this has implications for the pace with which new-build ships, including those using natural gas engines, might be expected to penetrate the global fleet. The majority of existing shipping capacity exists in ships built in the last 14 years. Typical ship decommissioning ages broadly range from 25 to 30 years [11].
The majority of engines in the existing ship fleet burn heavy fuel oil, a crude oil derived fuel. In order to switch to natural gas as a ship fuel, new engines are necessary. As with trucks, there are a number of different ship engine types capable of burning natural gas. The characteristics of these engines have an impact on both emissions and costs. These broad engine types are summarised below:
- Medium Speed 4-Stroke Lean Burn Spark Ignition (LBSI) engines [28]
- Medium Speed 4-Stroke Low Pressure Dual-Fuel (MS-LPDF) engines [28, 29]
- Low Speed 2-Stroke Low-Pressure Dual-Fuel (LS-LPDF) engines [30]
- Low Speed 2-Stroke High Pressure Dual-Fuel (LS-HPDF) engines [31]
More information on both truck and ship engine types and their impact on emissions can be found in [9].
4. Evidence on greenhouse gas emissions
4.1. Supply chain emissions
GHG emissions arise from various sources along the fuel supply life cycle, in addition to the emissions directly from the truck or ship. The life cycle applies to fuel for both trucks and ships, where stages are divided into three categories: well-to-pump (WTP), which captures emissions in fuel production and transportation; pump-to-tank (PTT), which accounts for storage and delivery of fuel to the vehicle/vessel; and tank-to-wheel/wake (TTW), capturing the emissions arising from the vehicle/vessel. The entire life cycle is referred to as well-to-wheel/wake (WTW). CO2 emissions typically arise from fuel combustion or venting separated CO2 from raw gas. Methane emissions arise from process venting, incomplete combustion of natural gas (either for fuel or flare), or unintentional fugitive emissions.
Estimates of emissions associated with natural gas supply chains include a systematic review detailing methane and CO2 emissions from natural gas supply chains [32], characterisation of the distribution of emissions seen across different types of natural gas supply chains [33] and a number of recent studies covering various aspects of GHG emissions in natural gas supply chains [34–37]. The ranges of methane emissions presented in these studies vary significantly and the majority are focused on the supply chains associated with North American natural gas.
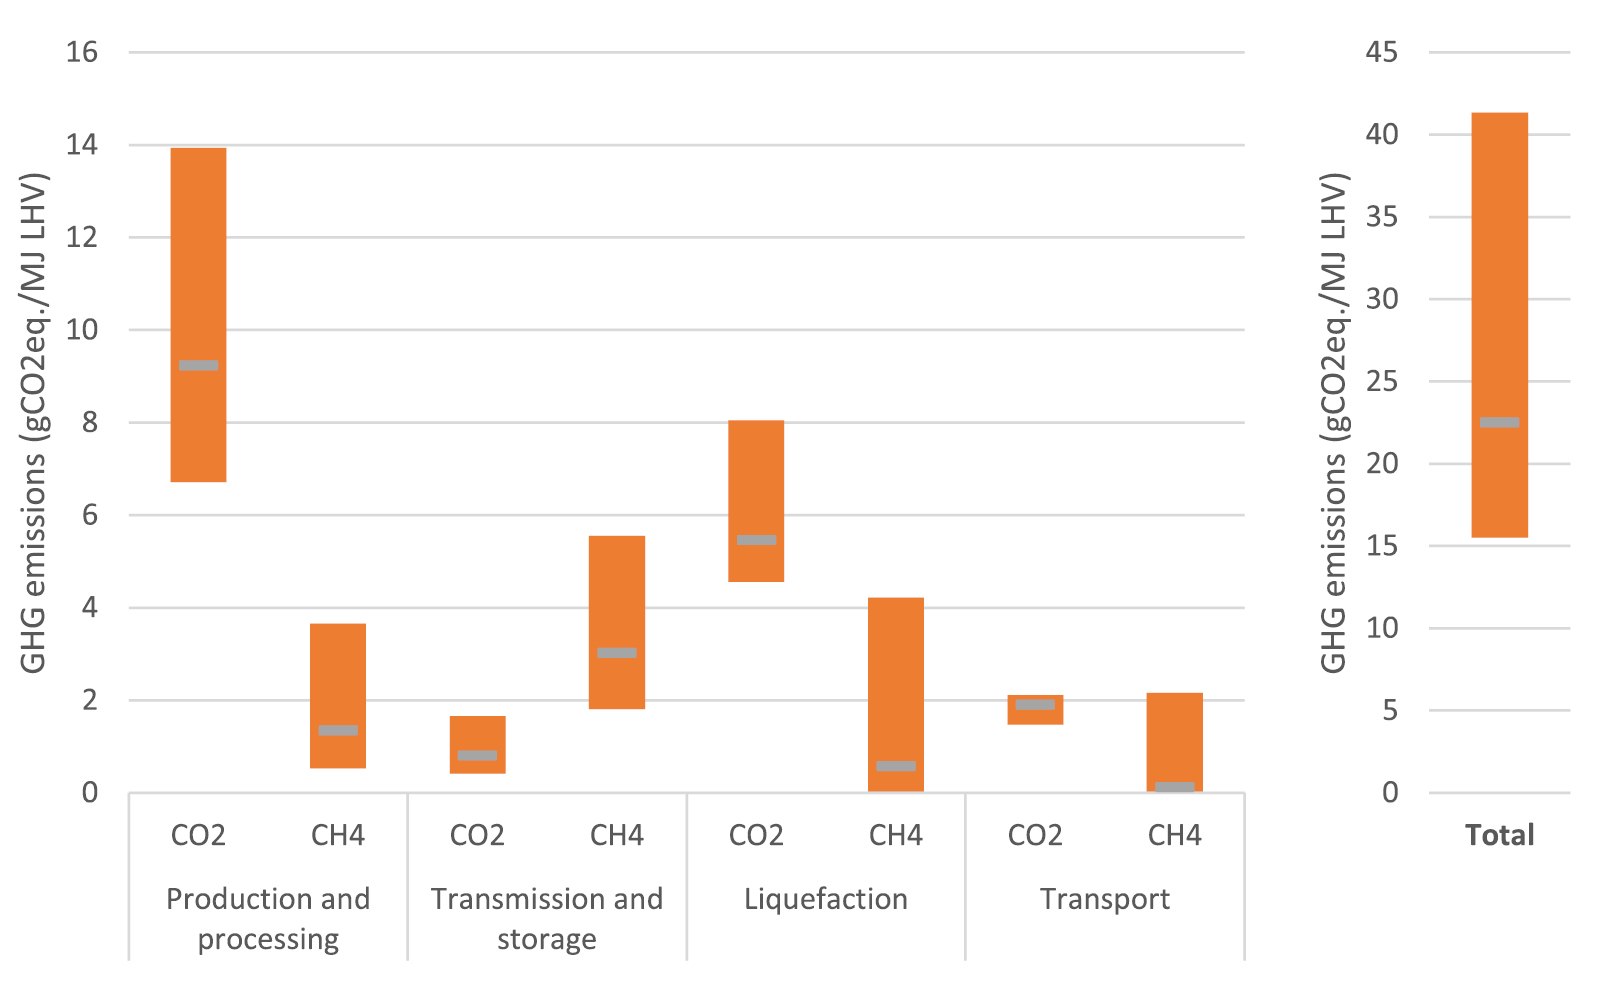
Figure 1 presents an aggregation of supply chain methane and CO2 emissions estimates from the sources discussed above, expressed as grams of CO2 equivalent per mega joule (MJ) of natural gas delivered on a lower heating value (LHV) basis. For context, the emissions of CO2 from natural gas combustion are over 50 g of CO2 per mega joule.

Figure 1. Average and ranges of GHG emission estimates for different stages of the supply chain, split by CO2 and methane. Source: [33, 36, 38–42].
Download figure:
Standard image High-resolution imageEstimates of total supply chain methane emissions vary widely and are likely to reflect natural variation across regions, processes, technologies and regulatory environments. Other effects such as methodological variation and representativeness of data adds further uncertainty to methane emission estimates. Whilst the range of estimates is extremely large, typical total LNG supply chain methane emissions estimates may be 0.2%–1% of gas production for lower emitting routes or 1%–4% for higher emitting routes. In comparison, the most recent estimate of total global methane emissions from natural gas is 1.7% of total gas production from the International Energy Agency, or ~3% of gas production if oil and gas are considered collectively [3].
Figure 2 displays the range of methane emissions only, as a percentage of throughput. It indicates a higher variability in the upstream stages and, whilst this may be the case, there has been much less focus on measuring downstream emissions and so there may be additional variability that is unaccounted for. There are still many gaps in our understanding of methane emissions, their magnitude and variation across different regions and supply chain stages.
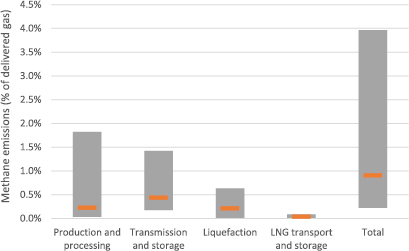
Figure 2. Averages and ranges of estimates of methane emissions across different stages of the natural gas supply chain. Source: [33, 36, 38–42].
Download figure:
Standard image High-resolution imageThere are currently relatively few high-quality estimates of methane emissions from LNG supply chain stages. Figure 3 shows the available literature estimates of CO2 and methane emissions from liquefaction and from LNG transport. Note that LNG transport refers here to an LNG carrier ship rather than the smaller scale LNG trucks which may exhibit different emissions profiles.

Figure 3. Estimates of GHG emissions from liquefaction and LNG transport, split by CO2 and methane emissions. Circles represent individual literature estimates, the blue bar represents the mean estimate and the orange box represents the interquartile range. Source: [32, 39, 40].
Download figure:
Standard image High-resolution imageKey emissions from liquefaction are CO2 emissions from fuel usage for liquefaction and residual methane emissions from any untreated boil-off gas (BOG). The natural gas is often used as fuel for liquefaction, where 8% to 14% of gas throughput is used to drive the process. A small amount of electricity is also used for ancillary processes but this is a small addition [39].
Estimates of methane emissions associated with liquefaction are typically low, as central facilities are likely to have effective BOG management and emissions-minimising procedures in place, although there is an absence of publicly available direct measurements to provide assurance (figure 3). There are typically four options for managing BOG [42]: venting; flaring; using BOG as fuel; and re-liquefying. The Natural & bio Gas Vehicle Association (NGVA Europe) study used industrial reported data to estimate a BOG rate of 1.8% and a re-capture rate of 99%, resulting in an unabated BOG of 0.02% [39].
LNG carrier emissions occur chiefly from fuel use as well as potential methane emissions from storage. There are likely to be different emission profiles associated with intermittent operations such as loading and unloading, port operation and deep-sea, but there is limited data to define such differences. Transport CO2 emissions are largely estimates from natural gas and fuel oil combustion, whereas methane emissions are typically considered to be very low. BOG associated with unloading to a terminal will typically be captured for injection into a gas grid [42]. However, no data were found on measurements of residual methane emissions. Again, there were very few high-quality measurement data on methane emissions from LNG carriers and it is likely that emissions are under-represented here: there is a high upward uncertainty which should be a priority for both academia and industry to reduce.
Regarding the contribution from CO2 and methane to total supply chain emissions, CO2 is the dominant source of emissions for the central supply chain emissions estimate. This is primarily due to the fuel intensity associated with gas processing and liquefaction. However, as shown previously the higher emitting supply chains will have a much higher contribution from methane [38].
4.2. Greenhouse gas emissions from trucks
4.2.1. Emissions in the pump to tank (PTT) stage
The pump-to-tank (PTT) stage of the life cycle covers the storage of liquefied natural gas (LNG) or compressed natural gas (CNG) at the fuel station to its delivery into the vehicle's fuel tank. Most emissions in this stage are likely to arise from fugitive CH4 emissions, with associated supply chain emissions from process energy requirements. Again, there is limited published evidence on fugitive emissions during the PTT stage. However, leaks may constitute up to 21% of the total pump to wheel (PTW) CH4 emissions (1%–9% of WTW emissions) [43]. There are several ways leaks can occur and there are some differences between the operation of LNG and CNG stations. Common to both are continuous unintentional leaks from fuel nozzles (and other fuel delivery system components). Furthermore, emissions can occur when hoses are connected to vehicles at the start and end of each fuelling event [43]. The two most significant contributors to emissions from LNG in the PTT stage are:
- BOG management in refuelling stations and bunkering tanks; and
- BOG management in vehicle tanks during or prior to fuelling.
Recent measurements of CH4 emissions at truck fuel stations were collected by Clark et al [43] and these have been incorporated into the latest evaluation of WTW emissions by Cai et al [34]. Sources of emissions included leaks from mechanical fittings, venting, compressors and releases during fuelling hose disconnection. The summarised ranges of emissions at these fuel stations is given in table 1. The upper bound of vehicle fuel tank venting is 3% which has been estimated based on data from Gunnarson et al [44], Ursan et al [45] and UNECE Regulation 110 [46]. For full LNG fuel tanks, the minimum holding time without venting is five days [46] and for intensively-used vehicles it is unlikely that there will be venting. However, in the event that a tank remains full after five days, 2%–4% per day of LNG may boil-off and be vented [44, 45].
Table 1. Summary of the range of CH4 leakage (as a percentage of throughput) during all stages of the pump-to-tank stage.
| Source | CH4 leakage as a % of throughput | Note | ||
|---|---|---|---|---|
| Low | Middle | High | ||
| Delivery | 0.1 | 0.1 | 0.4 | |
| Station tank BOG | 0.0 | 0.1 | 2.0 | |
| Continuous leaks at stations | — | — | — | Negligible |
| Fuelling nozzle | — | — | — | Negligible |
| Vehicle fuel tank | 0.0 | 0.1 | 3.0 | |
| Vehicle manual vent | 0.0 | 0.1 | 4.2 | |
| Total | 0.1 | 0.4 | 9.3 | |
4.2.2. Emissions from the tank-to-wheel (TTW) stage
4.2.2.1. Exhaust CO2 emissions
Several studies have investigated TTW CO2 emissions of natural gas HGVs (NG HGVs) in the US and Europe [43, 47–49]. A summary of emissions produced by the various diesel and natural gas HGVs from the literature is presented in figure 4. This data includes a range of drive cycles for each vehicle type compared, which influences the wide range of estimates. The literature indicates that natural gas HGVs have lower CO2 tailpipe emission than diesel but that there is a wide and overlapping range in these estimates.
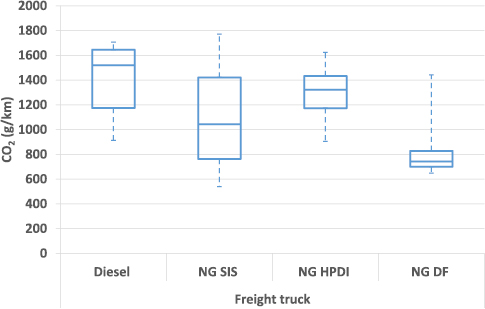
Figure 4. Summary of tailpipe CO2 emissions from various diesel and natural gas engines in freight trucks. Sources: [21, 48, 51–58]. Note: Given drive cycle variation in the included estimates above it is fairer to compare best, worst or central estimates.
Download figure:
Standard image High-resolution imageA recent on-road study was undertaken by Vermeulen et al [48], who conducted a series of real-world emissions measurements using two Euro VI compliant SIS engine LNG HGVs (Scania G340 with an automatic gearbox and Iveco Stralis Hi Road with a manual gearbox) across urban, rural and motorway drive cycles in the Netherlands. The results were compared against the average of six Euro VI diesel HGVs from previous tests. The average tailpipe emissions produced by the LNG HGVs, across all routes, were generally 5%–10% lower than diesel and the two emitted less CO2 across the majority of test cases. However, one test with the Scania G340 (low load condition 10% payload) in urban driving, showed higher emissions than the diesel counterparts. While the sample size of this study is limited, the results are broadly in line with a study undertaken by Cryogas (LNG supplier in Poland) using an Iveco LNG HGV. This study found emissions from LNG vehicles (0.65 kg km−1) to be 11% lower than their diesel counterparts (0.73 kg km−1) [50]. While the variation in the data remains, the results indicate that natural gas can provide a reduction in tailpipe CO2 emissions compared to conventional diesel vehicles.
The theoretical maximum reduction in CO2 emissions compared to diesel is approximately 25% [59, 60]. The reason that CO2 reductions are lower than this in the data above is because LNG trucks are not as energy efficient as diesel trucks. The fuel efficiency of trucks is dependent on not only the engine technology but other aspects, such as: powertrain efficiency, aerodynamic drag, load conditions and rolling resistance amongst others. Furthermore, the drive cycle can significantly influence fuel consumption, with urban cycles being more intensive than long-haul. A summary of the fuel efficiency of various natural gas trucks relative to their diesel counterparts is presented in table 2. This shows both significant variation and a considerable fuel efficiency penalty5 for most natural gas HGVs. For SIS, HPDI and dual fuel engines, there is a 19% [7%–44%], 17% [4%–44%] and 14% [−2%–40%] fuel consumption penalty respectively, compared to comparable diesel engines. Ongoing testing of new HPDI engines may corroborate or improve on the higher efficiency estimates for HPDI engines in table 2, though they were not publicly available by time of publishing [61].
Table 2. Ranges of the fuel efficiency (based on energy content of fuel) of various natural gas heavy vehicles relative to diesel.
| Vehicle type | Fuel | Engine type | Fuel consumption relative to diesel counterpart (%) | Source | ||
|---|---|---|---|---|---|---|
| Average | Min | Max | ||||
| Freight truck | Natural gas | Spark ignited stoichiometric | 119 | 107 | 144 | [48] |
| Natural gas | High pressure direct injection | 117 | 104 | 144 | [51] | |
| Natural gas | Dual fuel | 114 | 98 | 140 | [21] | |
A report by the International Council on Clean Transportation (ICCT) examined numerous available technologies that can deliver diesel fuel consumption reductions (up 30%–40%) [62], including improved engine technology [62]. Diesel engine efficiency is predicted to increase by 3.5% between 2018 and 2025 [54] and if natural gas engine efficiency improves at the same rate, the efficiency penalty for natural gas engines will stabilise at 0%–15% [54, 55]. Improvements in engine fuel efficiency will result in reductions in CO2 emissions from both natural gas and diesel of up to 15% and 40%, respectively, on current technology emissions (figure 4).
4.2.2.2. Methane emissions
Methane is an important contributor to GHG emissions in natural gas trucks given its high climate forcing relative to CO2. There are three potential mechanisms for methane emissions in trucks:
- Engine slip, where unburned CH4 passes through to the exhaust due to incomplete combustion;
- Leakage through the engine crankcase, as CH4 can escape from the combustion chamber into the engine crankcase; and
- Dynamic venting where the fuel rail pressure control system can emit small amounts of gas to the atmosphere to relieve pressure under changing load on the engine (limited to high pressure (HPDI) engine designs) [62].
There are a number of techniques to reduce these types of methane emissions. To reduce methane slip in the exhaust gas, catalysts can be used; a three-way catalyst is paired with SI stoichiometric (SIS) engines while a oxidation catalyst is used to control the emissions from SI lean burn (SILB) and compression-ignition (CI) engines [16, 63]. For crankshaft emissions, if the crankcase is open to atmosphere, any CH4 present will be vented. Therefore, crankcase ventilation systems and improved oxidation catalysts can be used to minimise or eliminate these emissions. However, the ICCT stated that at least up to 2015, there has been little incentive for manufacturers to implement these technologies [62]. Emissions estimates for these three potential mechanisms are presented below.
4.2.2.3. Tailpipe methane
Tailpipe emissions, or engine slip, can be measured as the percentage of fuel which passes through unburnt. The range in emissions of various natural gas trucks (and one diesel for comparison) is given in figure 5. Of all the natural gas engines the SIS engine produces the lowest emissions. The SILB produces significantly greater emissions, agreeing with the findings presented by Yoon et al [54]. The emissions from SIS engines are substantially lower because of the high exhaust temperature, while the lower temperatures produced by the SILB engines do not enable the oxidation catalyst to remove comparable amounts of CH4 [16]. There are numerous factors which can explain the variation in emissions, from differences in vehicle age, catalyst temperature, engine speed, vehicle load, transient behaviour and emissions diffusion between neighbouring micro-trips [43]. However, these results suggest that a SIS engine with a three-way catalyst can provide an effective method for reducing CH4 emissions. Furthermore, a SILB engine with an oxidation catalyst will not be able to meet Euro VI emissions standards without appropriate thermal management of the gases entering the catalyst.
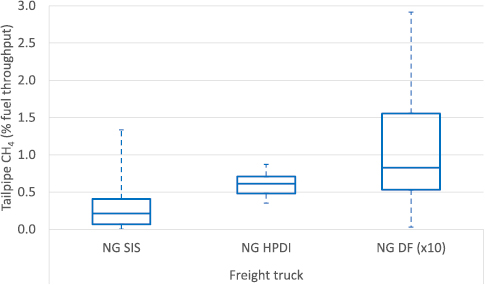
Figure 5. Summary of tailpipe CH4 emissions quantified as engine slip (% fuel throughput) for different vehicle and engine types. Sources: [17, 35, 43, 44, 50, 57, 58]. Note: Natural gas Dual Fuel (NG DF) engine methane slip data is reduced to a tenth of true values to aid scale issues. Multiply by 10 for true value.
Download figure:
Standard image High-resolution imageMethane emissions have the potential to negate climate benefits over diesel. It has been estimated that if engine slip exceeds 2.6 g CH4 km−26 then total GHG emissions of natural gas freight trucks will be higher than diesel [64]. However, this is highly dependent on the fuel efficiency of the truck amongst other factors. In addition, regulations such as the EURO VI limits on heavy duty vehicles in Europe require methane emissions limits significantly below this level (0.5 g km−1 limit) [65]. Assuming a vehicle fuel efficiency of 12 MJ km−1 the EURO VI 0.5 g kWh−1 limit is equivalent to 0.15% of throughput (shown in figure 5)7.
4.2.2.4. Crankcase methane
Clark et al [43] summarised all published findings on crankcase emissions from various heavy duty SIS natural gas vehicles. Freight trucks have, on average, the lowest emissions while transit buses have the highest. However, freight trucks also have the biggest range in emissions and can have emissions on par with transit buses. Delgado and Muncrief [62] suggested that if exhaust gas recirculation for a SIS engine is on average 20%, then emissions would be 0.4%–0.8% of fuel throughput. It should be noted that since HPDI engines introduce fuel just prior to ignition, the fuel is unable to penetrate crevices between the piston and cylinder and crankcase emissions are thought to be negligible [62].
4.2.2.5. Dynamic venting (HPDI engines only)
HPDI engines do not produce significant, if any, emissions of CH4 through the crankcase. However, they have a dynamic venting system that is used during transient behaviour (sudden changes in engine load), directly venting CH4 to the atmosphere. The only major study on dynamic venting in HPDI engines was undertaken by Clark et al [43], which showed that, while it is possible for no venting to occur, emissions can be greater than 2% of the fuel used. Other studies have also suggested that emissions produced by dynamic venting could be within a similar range to crankcase emissions [62]. A return-to-tank system is being employed by Volvo in new HPDI engines. This may have the potential to reduce methane emissions from dynamic venting, though there is currently no available estimate of this technologies performance [66].
The emissions from trucks can be categorised by refuelling and vehicle operation, and by the main GHGs, CO2 and CH4. At the refuelling station, CO2 emissions are thought to be relatively low, while the CH4 emissions from CNG and particularly LNG, may be significant enough to influence overall WTW emissions. Central estimates of CH4 emissions at this stage are around 0.4% of throughput, though upper estimates place this value at over 9% of throughput.
The most significant parameters influencing GHG emissions from truck operation are the efficiency of the vehicle and the CH4 leaked through exhaust, or engine venting. Natural gas trucks emit less CO2 than diesel equivalents given the lower CO2 intensity of natural gas compared to diesel (~10% less) though typically not the theoretical ~25% emissions reduction of natural gas relative to diesel trucks. Maximising the potential requires maintaining very close efficiency penalty against diesel engines, and minimising the CH4 emissions in exhaust and through venting. The long-term view of natural gas engine efficiency, relative to diesel, suggests that energy efficiency penalties will remain in the range of 0%–15%. There also exists the potential for CH4 emissions to increase GHG emission to greater than those of diesel equivalents. Careful choice of natural gas engines and after-treatment technologies is therefore needed to maximise any potential GHG reduction benefits.
The significant variation in TTW CH4 emissions estimates can be explained by several factors, including: differences in vehicle age, catalyst temperature, engine speed, vehicle load, and duty/drive cycle. Only few measurements exist to quantify non-tailpipe TTW emissions including crankcase emissions and dynamic venting, making this area a key uncertainty.
These are the findings for the pump to wheel system boundary. The fuel supply chain (WTP) also emits CO2, CH4 and other air pollutants. On a full life cycle basis (WTW), emissions from TTW are the biggest source of CO2, and CH4, while the fuel station contributes 9% towards CH4 emissions, as shown in figure 6. However, there is a large variation in emissions from all the stages and maximum emissions can be much larger than average emissions. Therefore, it is important that all life cycle stages be considered in order to cut emissions of GHGs and air pollutants from natural gas HGVs.

Figure 6. Breakdown of emissions from WTW life cycle of average LNG HGV. Range in emissions for each stage is also shown. Notes: This figure aggregates the relevant evidence presented previously. In the 'Electric' column the electric mix considered is the UK 2016 mix (42% gas, 9% coal, 19% nuclear, 5% imports, 25% renewables) and the error bars are for the lowest and highest CO2 intensity electric mixes (100% hydro and 100% coal). The electricity accounts for 67% of the total GWP and the battery manufacture 33%. The truck is modelled on the Tesla Semi which has an estimated fuel consumption of 2 kWh km−1.
Download figure:
Standard image High-resolution image4.3. Greenhouse gas emissions from ships
4.3.1. Bunker-to-tank
In the bunker-to-tank stage, the operations include the storage of LNG at a terminal or bunkering facility, and the delivery of LNG to the ship. Emissions associated with storage are likely to be from BOG (i.e. methane emissions) or from BOG management, (e.g. CO2 emissions from fuel use in re-liquefaction). Emissions associated with vessel loading may include methane emissions from vapour displacement associated with changing tank levels, CO2 from fuel usage or fugitive emissions. Additionally, there may be methane emissions associated with transfer pipe purging as well as flash losses [41]. There are limited high quality data sources for this supply chain stage.
Estimates of methane emissions associated with storage and bunkering are given in figure 7. Whilst effective BOG management during storage and loading operations are often assumed, Lowell et al [42] suggest there is more risk of higher methane emissions at more remote bunkering facilities where there is potentially less access to gas infrastructure than at more central, larger, liquefaction sites. Indeed, the higher estimates in figure 7 are associated with smaller and more remote facilities where re-liquefaction at smaller sites may not be economically feasible. Note that none of these estimates have sufficient transparency to be taken as a representative sample.
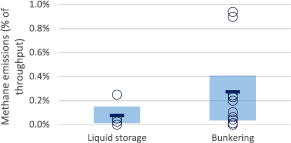
Figure 7. Estimates of methane emissions from LNG storage and bunkering operations. Source: [9, 39, 41, 42].
Download figure:
Standard image High-resolution imageBunkering may be carried out via port-to-ship (PTS), ship-to-ship (STS) or truck-to-ship (TTS) methods, depending on the available infrastructure and transfer volume required. These may result in varying methane emissions, as suggested by Corbett et al [41], but CO2 emissions resulting from fuel use are likely to be negligible. The NGVA Europe study estimated an electricity requirement associated with ship fuelling of 0.015 kWh kg−1 LNG [39], which equates to approximately 0.13 gCO2 MJ−1 LHV LNG assuming an electricity carbon intensity of 400 gCO2 kWh−1.
4.3.2. Tank -to-wake
The key aspects determining CO2 emissions from ship engines are the fuel used, and the efficiency of combustion. CO2 emissions arise from main fuel combustion, pilot fuel combustion and ancillary engine fuel combustion. Figure 8 shows literature estimates of CO2 emissions from engine operation for different fuels and engine types. Emissions are expressed per kWh of power output from the engine, in order to incorporate the different average engine efficiencies. LNG engines exhibit emissions of 400–470 gCO2 kWh−1 power output, whereas HFO and MDO options exhibit emissions of 530–610 gCO2 kWh−1 (25th and 75th percentile figures). This means that LNG exhibits a reduction in direct CO2 emissions of 26% on average, ranging from 12% to 35%. Note that for HFO and MDO diesel engines, slow speed and medium speed engines are included within each range. Slow speed diesels (SSD) are typically 2-stroke and used on larger vessels (e.g. container ships), whereas medium speed diesel (MSD) engines are typically 4-stroke and used on smaller vessels (e.g. ferries), although this is not exclusively the case. Emissions from SSD engines are typically lower than MSD due to higher efficiencies but the range within the literature is relatively constrained as shown in the figure 8.
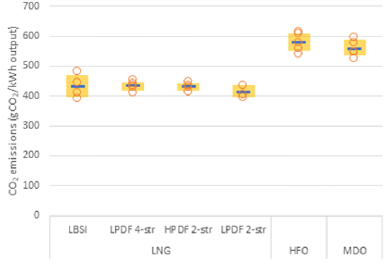
Figure 8. Estimates of carbon dioxide emissions from various engines and fuels. Source: [28, 39, 67–71].
Download figure:
Standard image High-resolution imageCO2 emissions across the LNG engine types are relatively similar as can be seen, with only the LPDF 2-stroke engine showing lower emissions with an average of 410 gCO2 kWh−1. However, there may be more variation than is indicated here. A recent study by SINTEF [28] provided the most robust and transparent set of measurements of LBSI and LPDF 4-stroke engines, both during operation and on test beds. The recommended emission factor for LBSI and LPDF 4-stroke are the highest values shown in the graph, 480 and 452 gCO2 kWh−1, respectively.
These higher CO2 emissions suggest that the efficiencies of these engines are lower than expected and hence fuel consumption is higher. Estimates of primary fuel consumption show some variation, with HPDF and LPDF 2-stroke engines showing lower fuel consumption, whilst HFO and MDO exhibit higher consumption [28, 39, 68, 72].
In dual fuel engines using pilot diesel fuel to initiate combustion, system efficiency is governed not only by primary fuel consumption, but by pilot fuel consumption as well as the requirement for ancillary power. Table 3 shows the efficiency of the main LNG ship engine types, and the resulting emissions of CO2 assuming standard emissions intensities of LNG, HFO and MDO. In particular the HPDF 2-stroke engine requires a minimum 5% liquid pilot fuel for operation, which impacts upon total efficiency and CO2 emissions. Even so, both HPDF and LPDF 2-stroke engines have efficiency estimates of 53%–55% on a lower heating value (LHV) basis, which is substantially higher than the older LNG engines, and diesel engines.
Table 3. Typical values for main and pilot fuel consumption, fuel efficiency and CO2 emissions for different marine fuels and engines.
| Values | LPDF 4-stroke | LBSI | HPDF 2-stroke | LPDF 2-stroke | HFO | MDO |
|---|---|---|---|---|---|---|
| Main fuel consumption (g kWh−1) | 169.1 | 170.2 | 135.1 | 138.2 | 201.5 | 184.5 |
| Pilot fuel consumption (g kWh−1) | 2.5 | 0 | 8.3 | 1.0 | 0 | 0 |
| Total fuel efficiency (% LHV) | 44.6% | 44.9% | 53.5% | 54.9% | 44.2% | 45.3% |
| CO2 emissions (g kWh−1) | 452.1 | 480.5 | 430.8 | 411.6 | 579.4 | 557.5 |
Source: [9].
Ancillary power requirements are dependent on the duty of the ship (e.g. a cruise liner would have high power demands), but included in this demand is the fuel delivery system. This is likely to be relatively small, but the high-pressure LNG delivery system requires more power than the low-pressure engine systems. However, this is not included within the scope of this study.
Given the link between efficiency and CO2 emissions, increasing engine efficiency could be an important tool in reducing emissions. The SINTEF report [28] suggests that efficiency improvements could result in engine efficiencies of greater than 50% (presumably on a lower heating value basis), where current low pressure engines currently exhibit efficiencies of 45%–48% LHV. However, newer gas engines such as the HPDF 2-stroke and LPDF 2-stroke already exhibit efficiencies of 53%–55% LHV. In the longer term, the efficiency of natural gas engines might improve incrementally, as has been the case in diesel and HFO engines in the past [73]. However, there is little evidence in the literature to help define the rate of improvement.
Ship methane emissions have been shown to be highly variable for those engines that have been tested, but only two out of the four main engine types have been assessed (LBSI and LPDF 4-stroke). Furthermore, only exhaust emissions have been tested. Whilst these are highly likely to represent the majority of ship methane emissions, other sources of ship methane emissions may occur that have not been assessed, for example intermittent venting of storage or fuel delivery systems, fuel purging or more broadly fugitive emissions. Given the high GWP of methane, measuring such emissions is an important area for future research, and a holistic measurement assessment of LNG-fuelled ships would be required to effectively characterise emissions and rule out additional emission sources.
In publications before 2015, methane slip from ship engines was estimated to be between 1.9% and 2.6% [42, 74]. However, recent measurements by SINTEF [28] in 2017 showed much broader variation, with average methane slip of 2.3% (1.6%–3.3%) and 4.1% (2.7%–5.8%) from LBSI and LPDF 4-stroke engines, respectively. Note these only include engines built since 2010 and despite improvements made by engine manufacturers in combustion chamber design and tighter air-fuel ratio control to reduce methane emissions. Estimates and measurements of methane emissions from four different LNG engines are summarised in figure 9.

Figure 9. Estimates of methane emissions from various engines and fuels. Circles represent individual literature estimates, bars represent mean estimates and the yellow bar represents the interquartile range. Source: [28, 39, 42, 67–69].
Download figure:
Standard image High-resolution imageWhilst the figure shows high variability in emissions for LBSI and LPDF 4-stroke engines, the other two (HPDF and LPDF 2-stroke) have no associated measurements of their methane emissions other than from the manufacturers. It is expected that the LPDF 2-stroke engine exhibits slightly lower methane slip than the LBSI and LPDF 4-stroke, whilst the HPDF 2-stroke exhibits extremely low emissions at approximately 0.2% of throughput. However, there is a requirement to validate these data with real-time in situ emissions monitoring to ensure that low emissions can be achieved or to determine where the greatest potential reductions exist.
Analysing the methane slip and NOX emissions in marine vessels shows a competing trend between these species, especially at low engine loads. LBSI and LPDF engines can control NOX emissions (for instance to meet more stringent Tier III NOX emissions) by using lean fuel-air mixture to reduce the combustion temperature [28]. However, this technique increases the chance of incomplete combustion of methane and therefore, higher methane slip. This process also increases the carbon monoxide (CO) emissions. On the contrary, a rich fuel-air mixture can minimise methane slip, improve load acceptance and reduce CO emissions at a cost of increasing NOX emissions. Despite the best efforts of engine manufacturers to eliminate them from LBSI and LPDF engines, these undesired emissions will continue to reduce the GHG benefits of natural gas fuelled ships using these engine types.
In shipping, black carbon is pollutant increasingly examined for its global warming potential. Study of shipping sourced black carbon emissions and their impact of climate change is relatively nascent, though one study estimates the contribution to shipping emissions at 7% on a 100 year time horizon and 21% on a 20 year time horizon [4].
4.3.3. Total ship life cycle GHG emissions
Estimates of total life cycle GHG emissions for LNG and other fuels are somewhat more constrained than the ranges seen for methane emissions, as shown in figure 10. Broadly, LNG estimates are slightly lower than those of HFO (6% lower on average). There is a broader range for LNG than the liquid fossil fuels due to differing estimates of both methane slip and upstream supply chain emissions. For context literature estimates of liquid hydrogen life cycle GHG emissions are included [75]. This presents a wide range of estimates, reflecting the potential for hydrogen to be sourced from fossil fuel and renewable production methods [75].

Figure 10. Estimates of total life cycle GHG emissions associated with different marine fuels. Source: [13, 39, 42, 68, 69, 72, 74, 76–79]. Note: Circles show individual literature estimates, the bar represents the mean values and the yellow are denotes the interquartile range. Liquid hydrogen (Liq H2) is for use in fuel cell systems. Other related fuels such as ammonia or bio-derived fuels are also options for decarbonisation, but are not discussed here.
Download figure:
Standard image High-resolution imageExamining estimates of LNG options in more detail, figure 11 shows a range of estimates of total life cycle GHG emissions, split into upstream and ship-based emissions. Particularly high variation comes from the upstream emissions. The lowest estimates of supply chain emissions are around 60 gCO2eq. kWh−1, which is extremely low considering the potential contribution from liquefaction alone which may be 80–100 gCO2eq. kWh−1 (if fuelled by the natural gas itself). Methane emissions account for most of the variation in the upstream emissions estimates, which may reflect a genuine variability of emissions across different supply chains and regions.

Figure 11. Life cycle GHG estimates of emissions associated with LNG fuelled ships, split by supply chain and ship contributions. Source: [9, 39, 42, 68, 74, 76, 80].
Download figure:
Standard image High-resolution imageMethane slip from the engine also plays a large part in the variation in estimates. For example, the NGVA study estimated emissions associated with the use of two engine types, LPDF 4-stroke and HPDF 2-stroke. For the LPDF 4-stroke, an emission of 1.8% was assumed, which is approximately half of the recommended emission factor estimated by SINTEF (4.1%) [28].
By using the central estimates of emissions of CO2 and methane from each stage of the supply chain, life cycle GHG emissions were estimated for the different LNG engines and compared to the liquid fuels, shown in figure 12 [9]. As can be seen, the sensitivity of CO2 and methane emissions to the rank-order preference of each technology is high. The following are key findings from this analysis:
- Ship CO2 emissions are the dominant emissions of all fuel options technologies, highlighting the need to remove the carbon or to derive from a biogenic source.
- Methane emissions have a strong influence on total emissions for LNG.
- Supply chain emissions are high for natural gas, in particular for those associated with liquefaction and from methane.
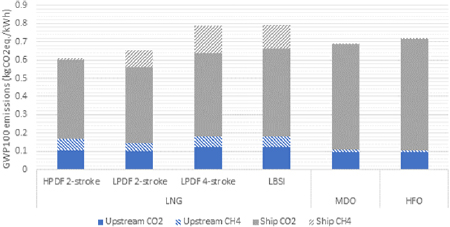
Figure 12. Life cycle GHG estimate of emissions associated with LNG fuelled ships compared to liquid fuels split by upstream and ship contributions from CO2 and methane. Source: [9].
Download figure:
Standard image High-resolution imageIt is clear that end-use combustion CO2 emissions are the dominant source of GHG emissions for all fuels and engines. Notably, the higher efficiencies associated with the LPDF 2-stroke and HPDF 2-stroke engines serve to both reduce these CO2 emissions, as well as reducing the upstream supply chain contribution due to lower fuel requirements.
The importance of methane emissions on the GHG result should not be understated: lower methane emission LNG options perform the best whilst the higher emitting options perform worse than the liquid fuels. If LNG is to contribute materially to the shipping sector, methane slip must be minimised to the levels suggested of the HPDF engine, whilst great care must be taken to utilise the better-performing natural gas supply chains with lower embodied emissions [33].
A large proportion of the LNG supply chain emissions arise from the liquefaction process, where some of the natural gas is used as fuel to drive the liquefaction process. If an alternative low-carbon fuel were used for the process, the benefits would be two-fold: lower emissions associated with the process; and increased product volume, which lowers the levelised emission profile.
5. Cost in natural gas ships and trucks
The costs associated with natural gas as a transport fuel are key drivers in vehicle or ship purchasing decisions. Fuel costs may be the dominant operating cost and the engine type plays a key role in defining the difference in ship or truck (capital) cost. This section explores both these issues in turn, before making some comparisons on a Total Cost of Ownership (TCO) basis.
5.1. Evidence on fuel cost
The cost of natural gas to vehicle or ship operators is influenced by a number of factors, including;
- The wholesale gas price, which varies over time and location;
- The form natural gas is stored in; and
- The taxes or duties applied to the fuel.
The first two of these factors vary, but have historical trends that can be examined. In contrast, the taxes and duties typically applied to transport fuels are not mirrored in natural gas, though this may change in the future. This is particularly the case for road fuels, where duties are attached to the sale of transport fuels in many countries.
Should demand for natural gas as a transport fuel increase significantly this would also have an influence on the natural gas price, though this is an aspect of future fuel price that is not typically covered in the transport literature.
A number of studies compare the price of incumbent fuels with the price of natural gas as either LNG or CNG, drawing the conclusion that natural gas is relatively cheap, providing an economic basis for a transition to natural gas as a transport fuel [81–89].
5.1.1. Ship fuels
Figure 13 presents the historical prices for three shipping fuels: heavy fuel oil (HFO), marine diesel oil (MDO) and LNG. The data in figure 13 are normalised to 2017 US Dollars and presented in dollars per GJ of fuel8. This data can also be presented in dollars per kWh of engine output, accounting for variations in engine efficiency. However, the differences in engine efficiency have a small impact on the cost to ship operators relative to the significant differences in fuel prices.

Figure 13. Comparison of the price of different shipping fuels in 2017 US dollars per GJ of fuel. Source: [89, 92–95]. Note: Fuel prices from Europe and the USA.
Download figure:
Standard image High-resolution imageThe LNG prices compared here are wholesale prices in the USA and Europe and may not fully capture the costs of bunkering and refuelling. However, these costs are not expected to play a significant role, with several studies comparing similar estimates of LNG price to conclude that there is a potential cost benefit over incumbent fuels such as HFO and MDO [84–88, 90]. One study assumes that costs of small-scale distribution of LNG to deliver to a wider shipping market might increase fuel costs by approximately 30%, though this study still finds LNG a cheaper fuel than HFO on an energy basis [89]. Another available estimate of bunkered LNG suggests that, based on a recent low, bunkered LNG is 35% cheaper than intermediate fuel oil (IFO380)9, and a 65% discount against marine gas oil (MGO)10 [91]. International shipping also largely avoids the types of fuel tax applied in many countries to road fuels, therefore these types of additional cost to LNG as a shipping fuel have not played a role in the analysis of costs in figure 13.
Figure 13 shows that the prices of incumbent HFO and MDO are significantly higher than LNG. LNG is on average ~50% less than HFO and ~65% less than MDO within this time period. However, this data also suggests volatility in fuel price, including periods where the difference in price between HFO and LNG is significantly narrowed, or in some cases, eliminated. Given this volatility, there is uncertainty regarding the future trend in these prices, though one study models a static price difference between LNG, HFO and low sulphur marine fuels out to 2030 [89].
Literature on ship fuel costs do not typically discuss the potential impact of a substantial increase in LNG demand on LNG fuel price. As an indication of scale the global market for LNG is currently 15 736 PJ, while the global ship fuel market is 11 920 PJ, therefore an increase in ship market demand for LNG could have a significant impact on total LNG demand [4, 96]. A knock-on reduction in HFO and MDO demand could also reduce their prices, which would reduce this price differential further. Assessing different scenarios of change in future fuel demand and the impact on price is an area for future research, where integrated whole systems economic models might provide useful insight.
5.1.2. Truck fuels
The comparison of truck fuels on a similar basis to that for ship fuels illustrates the significant impact that fuel duties and taxes can have on the fuel price. With fuel duty CNG and LNG are 20% to 23% cheaper by unit of energy in the United States [97]. This indicates that fuel cost may provide an economic incentive to transition towards natural gas as a truck fuel.
To compare this with prices in Europe, figure 14 presents LNG, CNG and diesel prices in several countries. This demonstrates three things:
- CNG and LNG are significantly cheaper than diesel on an energy basis in the majority of countries. Sweden is the only country where diesel LNG and CNG are closely prices, driven by the high fuel duty applied to natural gas in that country [98].
- There is significant variation in all fuel prices between countries. Again this is driven to a large extent by differences in VAT and fuel duty [98].
- In many countries there is little difference between CNG and LNG. This is counterintuitive given the greater cost associated with liquefaction of LNG relative to the cost of CNG compression. However, this is thought to be related to pricing behaviour by the fuel station operators, who may do this for marketing and promotional reasons [98].
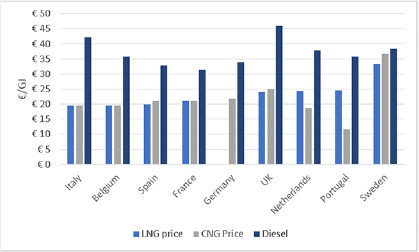
Figure 14. LNG, CNG and diesel prices in a number of countries in Europe in 2016. Source: [98].
Download figure:
Standard image High-resolution imageA significant proportion of the apparent price difference is a function of the fuel duty applied, with duty on natural gas fuels typically significantly less that on liquid road fuels [97].
Figure 15 illustrates the differing fuel duties applied to CNG in three European countries. This also highlights the significant variation in fuel taxes across different countries.
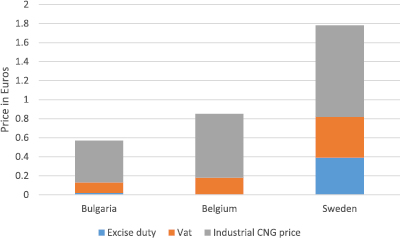
Figure 15. CNG price comparison in Bulgaria, Belgium and Sweden. Source: [99].
Download figure:
Standard image High-resolution imageSince fuel price and tax varies with jurisdiction and fuel, and may also be changed in the future, it is challenging to draw conclusions regarding the future price trends for these fuels. Pressure may emerge for governments to increase the duty on natural gas road fuels as demand increases [100]. This is an issue highlighted by Joss [83], who examined the UK fuel duty on CNG, LNG and diesel. To illustrate the potential impact of future increases to natural gas road fuel duty they compared the potential equalisation of duty on these three fuels on a CO2 and energy basis. Adding fuel duty to natural gas fuels reduces the price benefit against diesel significantly, though CNG and LNG both remain cheaper than diesel, reflecting the difference in the underlying fuel prices without duty.
5.2. Vehicle cost
The cost of vehicles represents a significant proportion of capital costs for truck or ship operators. The cost of new ship or truck designs incorporating engines that can utilise modern lower carbon fuels will, in the short term at least, be greater than the cost of the incumbent vehicle designs. Much of that increased cost lies in the engine and fuel system costs. While these are not particularly more sophisticated than incumbent engine designs, the additional cost is thought to be largely a function of the relatively low volumes of production currently [83]. The cost differential may therefore narrow over time if natural gas vehicle adoption increases.
5.2.1. Ship costs
There are relatively few publicly available estimates of ship costs in the literature, that cover incumbent HFO fuelled vessels, natural gas fuelled vessels and hydrogen fuelled vessels [88, 90, 101, 102]. This makes comparing across different studies a challenge given the large variations in prices between ships of different duties, sizes, and countries of origin, as well as studies with different published dates and various units used. The transparency of studies is also a challenge, with many studies omitting details of vessel size, engine size or disaggregation of engine and tank costs. Table 4 represents estimates of full ship costs normalised in 2017 US dollars. This comparison highlights a number of key issues:
- First, gas options are a higher cost due to the additional cost of engines, fuel supply systems and LNG fuels tanks. Where there are directly comparable estimates this cost premium is 6%–10% [90, 101]. However, total costs are still dominated by the balance of ship costs in HFO and natural gas ships based on these estimates.
- Second, there is a large variation in the cost estimates of the various ship types in table 4. This range is a function of the vessel and engine size, fuel tank size and vessel range, the country source of data and age of data.
- Finally, while the gas engines represent a small increase relative to the incumbent liquid fuel engines, hydrogen power trains have a much more significant impact on ship costs. A significant proportion of that cost is dictated by the cost of the fuel cell stack, while the cost of hydrogen tanks also plays a significant role relative to the cost of tanks in vessels using liquid or natural gas as fuel [90].
Table 4. Estimates of total ship cost and ship cost per kW of engine output in 2017 US dollars.
| Fuel | Engine size (kW) | Ship type | Ship cost | Cost per kW engine | Source |
|---|---|---|---|---|---|
| HFO/MDO | 9801 | Bulk carrier | 30 639 033 | 3126 | [88] |
| 2400 | Short sea | 18 119 719 | 7550 | [90] | |
| 11 000 | Deep sea | 80 140 927 | 7286 | [90] | |
| 23 000 | Container | 131 600 927 | 5722 | [90] | |
| 9801 | Bulk carrier | 30 699 092 | 3132 | [88] | |
| 14 500 | Gas carrier | 40 400 000 | 2786 | [101] | |
| LPDF | 2400 | Short sea | 19 258 672 | 8024 | [90] |
| 11 000 | Deep sea | 87 802 979 | 7982 | [90] | |
| 23 000 | Container | 141 696 199 | 6161 | [90] | |
| 14 500 | Gas carrier | 44 400 000 | 3062 | [101] | |
| HFC | 2400 | Short sea | 27 541 972 | 11 476 | [90] |
| 11 000 | Deep sea | 137 088 613 | 12 463 | [90] | |
| 23 000 | Container | 234 003 222 | 10 174 | [90] | |
In addition to this evidence there have been statements as to the cost of newer HPDI natural gas engines for ships. One statement suggests that these engines will cost 15% to 40% more than LPDF engines [102]. However, this cost premium, when integrated in total ship costs, will be smaller relative to total ship costs.
5.2.2. Truck costs
A number of studies provide estimates of the cost of trucks, engines, or the cost differential to incumbent diesel vehicles [34, 81, 83, 103–106]. These estimates are presented in figure 16, normalised in 2017 US dollars per vehicle based on costs stated in published year. This does not consider cost reduction potential. Several key issues are highlighted by this comparison, which show some similarities to the issues identified for ship costs in the previous section.

Download figure:
Standard image High-resolution imageFirst, gas vehicles appear more expensive than incumbent diesel vehicles, with directly comparable estimates suggesting a price premium of ~25% to ~50% for SIS engines and ~30% to ~90% for HPDI engines against diesel fuelled trucks. Second, there is significant variation in costs for each engine type, which is a function of vehicle and engine size, the country source of data, as well as the age of the data. To compare these costs to zero emissions vehicle options, Tesla have stated that the first versions of its proposed 'Tesla Semi' has an expected price of between $180 000 and $200 000 for a version with an 800 km range [106]. This estimate is towards the top of the range of estimated high-pressure-direct-injection (HPDI) trucks. However, final details of pricing, the fact that the electric truck may have only 80% of the range of an LNG truck and the potential of loss-leading pricing behaviour limit the value of direct price comparison.
It is also possible to retrofit existing trucks with natural gas engines at a reduced costs relative to new vehicle cost [82]. This may cost in the region of $30 000 dollars excluding the residual value of the truck [82].
There are few estimates of the cost of hydrogen fuel cell powered trucks, though these might be able to provide reduced emissions through low carbon hydrogen in the future [107]. The Fuel Cells and Hydrogen 2 Joint Undertaking (FCH2 JU) provide an estimates for the cost of a hydrogen fuel cell powered long distance truck (>12 tonnes) at $340 000 to $375 000 [107]. This study also estimates significant cost reduction in the future arriving at $130 000 to $143 000 by 2030 [107]. It is uncertain over what timescale these trucks might become a more competitive economic prospect.
5.3. Total Cost of Ownership (TCO) and the payback proposition
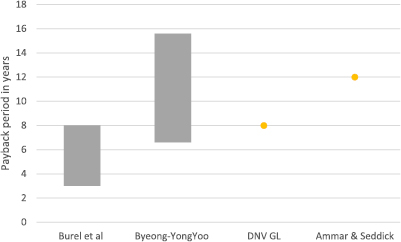
5.3.1. Total costs of LNG ship ownership
Several studies give estimates of several elements contributing to the total cost of LNG fuelled ships [84–88, 90]. Various options are compared over time with other fuel options including incumbent HFO fuelled vessels, MDO/MGO fuelled vessels, or investment in other emissions mitigation technologies such as exhaust gas scrubbers to mitigate SOX emissions [84–87].
The literature typically concludes that the extra investment in LNG ships is paid back within the lifetime of the vessel. In figure 17 studies measure payback periods of investing in LNG ships against the costs of MGO/MDO ships, or HFO ships including aftertreatment technologies necessary to meet future air pollution limits. This demonstrates a range from 3 to nearly 16 years needed to pay back the initial LNG investment through reduced fuel costs.
Figure 17. Payback periods for LNG ships estimates in four literature estimates. Source: [84–87]. Notes: Payback period in [84] LNG against MDO, with range a function of varying LNG price from ~25% below to ~20% over the HFO price. Payback period in [85] measured between LNG and MGO, with range a function of varying the additional cost of the LNG system between 10% and 15% of the MGO engine. [86, 87] measure the payback period between LNG and HFO including necessary aftertreatment technology.
Download figure:
Standard image High-resolution image
5.3.2. Total costs of natural gas trucks ownership
Similar to ships, numerous studies estimate different elements contributing the total cost of natural gas trucks [81–83, 108]. Many of these studies compare natural gas trucks to diesel fuelled trucks, giving payback periods, which estimate the length of time it takes to recover the higher initial capital cost of natural gas trucks through the comparatively lower fuel costs [81–83].
A recent study in the UK by the Energy Technologies Institute (ETI) [83] examined the potential future of natural gas fuelled trucks, comparing different gas engine options with a conventional diesel truck. With a 32% higher capital cost for an LNG natural gas truck, the payback time is five years on a TCO basis assuming current UK fuel duty and with government projections of fuel price over time [83]. The study also states that a 32% incremental cost is sufficient to install an HPDI engine, thought to be Euro VI compliant [83].
Ivanco et al [82] examined the return-on-investment (ROI) associated with retrofitting of diesel trucks with a dual fuel engine. The study demonstrates the impact of a range of fuel price differentials and annual distance travelled on the time to pay back the initial capital investment, estimated at $31 000. The study found that at a fuel price discount of ~50% below diesel and 100 000 miles annual distance travelled that the retrofit investment would be paid back in 15 months. However, if the fuel price differential is reduced to 10% the payback period increases to 8 years11.
Finally Gabl [81] compares the cost of diesel to dedicated natural gas trucks on a TCO basis. The study assumed that the incremental cost of the natural gas truck was €20 000, a diesel cost based on diesel prices in 2016 in Europe. On this basis the initial extra investment in the natural gas engine is payed back in five years. This study also examines the sensitivity of this finding to changes in the capital or fuel cost differential. This examination found that reducing the fuel consumption of the natural gas truck by 15% would reduce the payback period to three years, while reducing the incremental truck purchasing cost by 15% reduced the payback period to four years.
In summary, natural gas trucks exhibit higher capital costs by approximately 20% to 75% compared to diesel, but reduced fuel costs give an expected payback period of 15 months to eight years, based on assumptions on duty cycles and distance travelled. Given an expected truck life span of 10–15 years, there is an expectation that natural gas trucks will be cheaper on a TCO basis, unless fuel tax increases significantly. As well as capital and fuel costs, key factors affecting cost effectiveness are the expected utilisation, duty cycle and mileage of the truck.
6. Discussion
6.1. Summary of main findings
6.1.1. Natural gas options to reduce emissions from trucks and ships
Using natural gas as a transport fuel is one way to reduce emissions from trucks and ships. This option sits within a raft of other fuel switching, energy efficiency and exhaust gas treatment options. Many of these options can be used in combination, providing significant potential for decarbonisation. However, the contribution that natural gas can make to emission reduction is constrained by a number of factors that must be well understood before judging the benefit of natural gas as a transport fuel.
First, there are several different engine types that can use natural gas, including engines that use only natural gas, and variants that use both natural gas and liquid fuel. The emissions from these engine types vary and there are a number of trade-offs between engine types in terms of engine efficiency and methane slip. Exhaust gas after-treatment options are available to mitigate emission of the important GHGs. Maximising the benefits of natural gas as a transport fuel will in part rely on the optimisation of engine design in combination with these after-treatment options. In particular the use of high-pressure duel fuel engines in shipping, and spark ignited stoichiometric engines in trucks, may have the potential to minimise methane slip.
There are also a raft of energy efficiency measures available now or in the near future that can contribute to significant emissions reductions in ships and trucks. Many of these measures can be used in combination with engine and fuel options, delivering significant combined emissions reductions. However, these are independent of natural gas and are likely to be pursued regardless of the future development of natural gas as a transport fuel.
Other fuel switching options exist including the use of vehicles using hydrogen or electricity and electric motors. These technologies have the potential to reduce emissions significantly, eliminating direct engine related emissions entirely. However, these are less developed technologies and need more time to reach practical deployment. This highlights the need to understand the role of natural gas in the near future when emissions reductions are needed but more technically advanced options are not fully commercially deployable. The defining point at which hydrogen or electric trucks become available is therefore also a key aspect of future research.
6.1.2. Emissions estimates from natural gas trucks and ships
The GHG emissions reduction potential of natural gas engines is defined by the lower carbon intensity of the fuel relevant to incumbent liquid fuels. However, total GHG emissions are influenced by other emissions sources including:
- the difference in engine efficiency between natural gas and incumbent liquid fuel engines, experienced as difference in CO2 emissions in the exhaust per unit of engine energy output;
- unburned natural gas emitted within the exhaust gas stream, known as methane slip; and
- methane emissions from the engine and fuelling system, such as crank case venting, dynamic venting or accidental fuel system leaks.
Given the wide variation in estimates of these emissions there is a wide range of potential GHG emissions from natural gas fuelled trucks and ships. At worst, natural gas fuelled trucks and ships may have supply chain and in-use emissions exceeding current incumbent diesel fuelled trucks and heavy fuel oil fuelled ships. However, best estimates of lifecycle emissions show a potential to reduce emissions from natural gas fuelled trucks by 16% against best estimates of diesel truck emissions, with average estimated emissions across all engines of 1300 gCO2eq km−1 and best emissions from spark ignited engines of 810 gCO2eq km−1. In ships the equivalent potential for emissions reduction is 15% relative to heavy fuel oil ships including emissions from the supply chain, with best emissions from high pressure dual fuel engines reaching ~600gCO2eq kWh−1.
Expanding this to total well-to-wheel/wake GHG emissions includes:
- Supply chain emissions, at 140 gCO2eq kWh−1
- Bunkering or fuel station emissions—at 9.3 gCO2eq kWh−1 for trucks or 8.2 gCO2eq kWh−1 for ships.
This gives a total well-to-wheel/wake in total well-to-wheel emissions of 810 to 2840 gCO2eq km−1 for trucks and 580 to 800 gCO2eq kWh−1 for ships.
The efficiency of incumbent technologies will also improve incrementally over time. This will erode the relative benefit of natural gas engine emissions reductions, with some estimates suggesting that engine efficiency improvements in diesel may keep pace with efficiency improvements in natural gas engines. There is also a challenge in interpreting estimated emissions in the absence of real-world emissions measurement. Independently verified in-use data is currently limited but is needed to corroborate the current expectations regarding engine emissions performance.
6.1.3. The costs of natural gas as a fuel for trucks and ships
Choosing natural gas trucks or ships typically involves additional capital costs relative to incumbent liquid fuelled trucks or ships. This additional cost relates to the fuel tank, fuel delivery system and the engine. There is some indication that the additional cost of natural gas engines will reduce if manufacturing increases, though this is unlikely to be reflected in the fuel tank and fuel system costs, which inherently require more components and materials.
The additional costs of LNG trucks is 20% to 75% more than diesel fuelled trucks and the additional cost of LNG ships is 20% to 50% more than HFO fuelled ships.
In contrast the cost of natural gas as a fuel is expected, by many estimates, to be less than current fuel costs, both in terms of the energy content of the fuel and the energy output of the engine, which accounts for differences in engine efficiency. This creates the possibility of a payback period, where the additional cost of the truck or ship is recovered by the operator through reduced fuel costs. LNG prices have been on average ~50% less than HFO prices between 2000 and 2015 and LNG and CNG are ~20% lower than diesel prices, including fuelling costs and duty.
Payback of the initial capital investment in natural gas trucks or ships depends on a number of factors, including fuel cost differential, and the annual fuel usage of the vehicle. However, studies often estimate payback within the first life of the truck or ship, creating an economic benefit of fuel switching to natural gas for vehicle owners. Estimates of payback period are between 15 months and 8 years for trucks and between 5 and 12 years for ships.
Tax and duty implications on fuel costs are a significant proportion of the fuel price differential in truck fuels. This aspect is therefore a key element of the payback proposition. Should natural gas displace incumbent fuels then the current tax regime for natural gas as a transport fuel may be under pressure, and duty or tax raises may follow. There are several ways that taxes might be increased to align with incumbent taxes on liquid fuels, though final prices are likely to remain cheaper than liquid fuels given the relatively low wholesale price of gas. However, reducing the price difference between natural gas and liquid fuels will extend the payback period, and studies that examine higher natural gas prices in the future highlight the potential that natural gas vehicles might not be able to pay back within the lifetime of the vehicle under these conditions.
6.1.4. Implications for global emissions
Natural gas has the potential to reduce global emissions from trucks and ships in the medium term. However, this potential relies on the real-world performance of vehicles and the minimisation of emissions in the fuel supply chain and refuelling processes. In addition, global goals for GHG emissions reduction in shipping, and increasingly likely GHG reduction necessary in trucks to meet national decarbonisation commitments, require greater GHG reduction than is achievable with natural gas engines alone.
In shipping, natural gas engines in combination with other efficiency improvements can reduce GHG emissions. However, even assuming very challenging rates of efficiency improvement it appears challenging to meet a 50% GHG emissions reduction target by 2050 using natural gas engines and ship efficiency improvements alone. Real world GHG emissions also have the potential to be greater than existing estimates, particularly when including supply chain and refuelling emissions and given the relatively poor level of research on these emissions sources. Higher real-world emissions rates from natural gas trucks and ships would further increase the challenge of meeting global climate change goals with these technologies. Further, as countries increasingly adopt net zero emissions goals, current sector specific goals will likely become insufficient.
6.2. Implications for policy
There are a number of implications for policy arising from the analysis of natural gas as a transport fuel in trucks and ships. First, the supply chain is likely to play a more significant role in the total GHG emissions of natural gas fuel than in incumbent liquid fuels. Minimising supply chain emissions will there for have an important role to play in emissions reduction strategies. Emissions in the natural gas supply chain are already under scrutiny, with current recommendations including better measurement and reporting of emissions and investment in emissions reduction technologies. Policy to support these measure would benefit natural gas in all its uses, including transport. Emissions at the refuelling station, including tank venting (the pump-to-tank phase) may not be included in these supply chain policies and regulations. These stages in the supply chain are therefore likely to need policies and regulations of their own to incentivise or require action to minimise these.
The current duty on vehicle fuels varies significantly by jurisdiction, fuel, and intended end-use. Shipping fuels tend not to pick up duty while in trucks, diesel receives significant duty in many countries while natural gas as a transport fuel it taxed significantly less. However, fuel tax is often used as a mechanism to price carbon intensive activities, which may encourage modification of fuel tax regimes in the future. Additionally, if the use of natural gas as a transport fuel was to increase significantly, displacing more heavily taxed liquid fuels, then increases to the tax on natural gas may occur in order to recover lost tax revenue. In the event that fuel tax is modified, it would be prudent to incentivise carbon emissions reduction. However, this is difficult to achieve given the uncertainty in GHG emissions that may arise from natural gas vehicles and the multiple cost factors that come together in the total cost of ownership proposition that ultimately informs fuel switching choices.
While natural gas may have a decarbonisation role in transport, vehicle or fuel options that provide more significant decarbonisation will likely be needed to meet global decarbonisation goals. This is likely to mean battery electric or hydrogen fuel cell based vehicle options, which are currently relatively expensive in terms of both the production of the energy vector and the vehicle manufacture. This means that policies will be needed to drive down the costs of these options. This may include measures to directly assist in the development of the technologies (technology-push policies) and measures to support and encourage demand for these technologies (market-pull policies). Broad carbon focussed interventions, such as carbon taxation would also work to support these technologies into commercial maturity.
The modification of existing policies is likely to be a key aspect of measures to decarbonise trucks and shipping. For example, it is worth considering the existing energy efficiency design index (EEDI) policy in shipping, and the impact of extending the current policy on emissions in 2050. Given the recently established 2050 GHG emissions target in shipping, examination of policy is necessary and there is suggestion in the literature that the extension of the EEDI policy should be part of that process.
6.3. Open questions
New research is needed to understand a number of issues around natural gas as a transport fuel in ship and trucks. First, there is some uncertainty in the real world performance of newer natural gas vehicle designs. While estimated emissions data is often based on simulated operation under test conditions, data on emissions performance of these vehicles in real-world operation is often less available. In addition, other vehicle emissions sources such as tank venting and accidental emissions in the fuel system are likely additional to the emissions included in simulated operation data. Measurements of these types of emissions in real world operation is a key area for future research.
Methane slip in the exhaust gas of natural gas engines is a significant factor limiting their decarbonisation potential. There is ongoing research into the reduction of methane slip through various approaches and this is likely to be a continuing challenge that will benefit from further attention.
In addition to technical research, more research is needed into the modelling of truck and ship operation. For instance, there are a large number of energy efficiency measures and engine options in addition to fuel switching to natural gas. Many studies examine the impact of these measures on total achievable emissions reduction. However, the interaction of different technology measures may not be additive, with measures such as slow-steaming in ships likely to have an impact on the value of other measures such as the effectiveness of hull coatings to reduce friction or wind technologies to provide supplementary drive or power. More sophisticated modelling of the interaction between all technical options in truck and ship design may be needed to better understand the likely benefit of these options on total emissions from ship or truck fleets, and the cost per unit of emissions reduction, which will also be affected by these types of technology interactions.
Whole system modelling of truck and ship fleets is also required. To best understand these transport systems requires integrating a wide range of variables. This includes aspects of future demand for goods transportation, market prices for input costs (such as fuel), decommissioning profiles for existing fleets, impacts of carbon pricing and policies and future implementation of advanced technology options and vehicle design. Given the highly complex nature of these variables and their interactions, these models are an essential aspect of research into the future impact of technology choices and policy initiatives to meet long term decarbonisation goals.
7. Conclusion
First, the total GHG benefit of switching to natural gas fuel was found to be approximately a 10% GHG reduction in shipping when comparing the lowest estimates of well to wake GHG emissions. Methane slip contributes between 2% and 20% to well to wake GHG emissions, varying with natural gas engine type. Fuel supply chain emissions contribute between 23% and 27% to well-to-wake GHG emissions. Comparing lowest well-to-wheel greenhouse gas emissions estimates for trucks, the benefit of switching to natural gas fuel is approximately a 16% reduction in greenhouse gas emissions. Methane slip contributes approximately 15% of well-to-wheel greenhouse gas emissions, and supply chain emissions contribute approximately 11% to well-to-wheel greenhouse gas emissions. Finally, in the worst cases, natural gas ships and trucks emit more greenhouse gasses than the diesel trucks and heavy fuel oil ships that they would replace, with methane emissions and deficit in engine efficiency the key drivers of these additional emissions.
Acknowledgments
Thanks to Rula Dahdal and Zivile Venslaviciute for assistance with the literature trawl.
Funding
The Sustainable Gas Institute is supported by funding from Royal Dutch Shell.
Footnotes
- 5
Calculated as the difference between the diesel and natural gas engine energy efficiency as a percentage of the diesel engine energy efficiency.
- 6
This is equivalent to ~1% of CH4 throughput assuming 12MJ/km fuel efficiency.
- 7
Historically engines are tested in dynamometer laboratory tests. Given that real world driving may introduce other variable there may not be a fair direct comparison between EURO limits and the data captured in figure 5.
- 8
Energy of fuels typically calculated on the lower heat value though references may not always make this explicit.
- 9
Intermediate fuel oil 380 is a blend of gasoil and heavy fuel oil, with less gasoil than marine diesel oil, a maximum viscosity of 380 centistokes and less than 3.5% sulphur.
- 10
Marine gas oil.
- 11
This study appears to compare the price of diesel to the price of natural gas on a Gasoline Gallons Equivalent (GGE) basis. The conversion value is not disclosed but if the difference between energy density of diesel and gasoline has not been properly accounted for the price differential may have been overestimated in this study.