
Abstract
Point defect formation and migration in oxides governs a wide range of phenomena from corrosion kinetics and radiation damage evolution to electronic properties. In this study, we examine the thermodynamics and kinetics of anion and cation point defects using density functional theory in hematite ( -Fe2O3), an important iron oxide highly relevant in both corrosion of steels and water-splitting applications. These calculations indicate that the migration barriers for point defects can vary significantly with charge state, particularly for cation interstitials. Additionally, we find multiple possible migration pathways for many of the point defects in this material, related to the low symmetry of the corundum crystal structure. The possible percolation paths are examined, using the barriers to determine the magnitude and anisotropy of long-range diffusion. Our findings suggest highly anisotropic mass transport in hematite, favoring diffusion along the c-axis of the crystal. In addition, we have considered the point defect formation energetics using the largest Fe2O3 supercell reported to date.
Export citation and abstract BibTeX RIS

Original content from this work may be used under the terms of the Creative Commons Attribution 4.0 license. Any further distribution of this work must maintain attribution to the author(s) and the title of the work, journal citation and DOI.
1. Introduction
The hematite phase of iron oxide, α-Fe2O3, has significant technological importance. It is used as a functional material for a wide range of applications including magnetic storage, gas sensing, memory devices, photocatalysis, in batteries; and as a pigment [1–6]. Additionally, it forms on corroded steels and rust—iron oxide—has a significant impact on the economy [7]. The properties and evolution of Fe2O3 are often dictated by the presence of defects and their rate of migration. In particular, mass transport determines oxide growth rates during corrosion. The flow of oxygen vacancies from the metal/oxide interface to the oxide/solution interface or metal vacancies in the opposite direction lead to the growth of the corrosive oxide scale. Understanding the mechanisms that govern film growth characteristics is important to predict and ultimately mitigate corrosion.
Advances in experimental, theoretical, and computational methods have led to a renewed focus on defects and their diffusion mechanisms in materials such as Fe2O3. Experiments in which the partial pressure of oxygen is varied have revealed detailed information about the defects in hematite. Studying single crystals of natural hematite, Chang and Wagner [8] examined the dependence of iron self-diffusion and electrical conductivity versus oxygen partial pressure. Dieckmann [9] used similar methods to show how the non-stoichiometry,  , in Fe2O3−
depends on the oxygen activity and that, in the temperature range of 1100 °C and 1300 °C, oxygen vacancies are the most prevalent atomic defects in the material.
, in Fe2O3−
depends on the oxygen activity and that, in the temperature range of 1100 °C and 1300 °C, oxygen vacancies are the most prevalent atomic defects in the material.
Point defect transport in Fe2O3 has also been treated theoretically, primarily using empirical models. For example, both Catlow et al [10] and Warschkow et al [11] used Buckingham potentials to simulate point-defect transport in hematite. They considered five different migration pathways (three within the basal plane and two cross-plane transitions) to understand the oxygen vacancy mechanism in hematite. Warschkow et al reported migration energies in the range of 0.63–5.44 eV, whereas Catlow et al calculated migration energies in the range of 1.12–10.45 eV for the five different pathways for +2 charged oxygen vacancies. Despite quantitative differences (mostly due to differently parameterized potentials) in migration energies, both works suggest the lowest migration energy for oxygen vacancies is for the in-plane mechanism. They also pointed out that the lowest migration energy path is not percolating, complicating direct inference of diffusion kinetics and anisotropy in hematite.
The nature of the Buckingham and related potentials limits the types of properties they can be used to study. In particular, the static nature of charge in these models only allows for the consideration of fully charged defects. However, Fe is a multivalent cation and thus it is expected that the defects in hematite can easily adopt various charge states. Further, those charge states would impact migration mechanisms. Thus, more recent work has used density functional theory (DFT) to consider the kinetic properties of defects in hematite. (We note that other papers have examined the defect thermodynamics in hematite, but here we are focused on kinetic properties.) Shousha et al [12] examined the migration paths for a subset of defects they determined to be particularly important: Fe interstitials and Fe vacancies. In our own previous work [13], we examined the migration of the fully charged cation interstitial and focused on the path parallel to the c-axis, which we found to exhibit a particularly low migration energy.
In the present study, we use DFT to examine the migration energetics associated with point defects in hematite. We identify pathways using a classical potential coupled with temperature accelerated dynamics (TAD) [14, 15] simulations and use those as starting points for subsequent DFT calculations. We consider all four intrinsic point defects spanning the neutral to fully charged state. We are ultimately interested in the behavior of hematite in non-equilibrium conditions (irradiation and corrosion) where defects that are not thermally dominant may contribute to transport. We then construct the full diffusion tensor to extract anisotropies associated with these defects. Finally, we revisit the thermodynamics of these defects, revising the assessment we provided in our previous work [16].
2. Computational methods
The most feasible paths for cation and anion migration via vacancy and self-interstitial defects were identified using TAD. TAD is one of several accelerated molecular dynamics methods [17] that, to varying degrees of approximation, extend the timescale of atomic simulations further than can be reached by conventional molecular dynamics (MD). In particular, TAD assumes harmonic transition state theory to extrapolate the timing of events observed during high temperature MD—where activated events occur more rapidly—to a lower temperature of interest to recover the correct state-to-state dynamics at that lower temperature. Here, we are less concerned about the generated trajectory than we are about the migration mechanisms discovered during the TAD simulation.
The TAD simulations were performed on the isostructural compound Cr2O3, which has robust empirical potentials that have been validated against a number of crystal structures [18]. We assume that the migration paths identified by TAD in Cr2O3 will also be followed in Fe2O3, and use DFT calculations to refine the energetics. For each vacancy defect, multiple competitive paths were found (including non-percolating options) while for each self-interstitial defect a single dominant path was found. After identifying the most frequently accessed transition pathways, the migration barrier of each path was refined using climbing image nudged elastic band (NEB) [19] in DFT. These calculations used the generalized gradient approximation plus Hubbard U (GGA + U) exchange-correlation scheme of Dudarev et al [20] (Ueffective = 5.3 eV based on values from the Materials Project [21]) and spin polarization following a conventional anti-ferromagnetic ordering. A 960-atom orthorhombic simulation cell (20.37 Å × 17.64 Å × 27.85 Å) was used for both TAD and DFT; the TAD supercell was scaled by the DFT lattice constant of Fe2O3 before the DFT calculations were performed. This large cell limits the interactions of defects between periodic images, of particular importance due to the extended nature of the cation interstitial. Further, this was the smallest cell usable for the TAD simulations and we simply adopted the same cells for the DFT calculation for convenience. Due to the large cell size, a single point was used to sample the Brillouin zone. An energy cutoff of 500 eV was used for the plane-wave basis set. Structures were relaxed, keeping the overall lattice constants fixed, such that calculated forces on ions were less than 0.01 eV Å−1 and electronic self-consistent steps were converged to 10−5 eV. We chose to keep the volume fixed as charged defects often exhibit significant relaxation volumes as a consequence of the charge itself, not the defect [22]. However, as our cells are quite large, we expect that the energetics described here are relatively insensitive to this constraint [23]. Migration barriers were evaluated considering multiple possible charge states for each type of point defect. In each case, the same pathways as identified by TAD were used as a starting point but were reoptimized using NEB and DFT. For the  defect, convergence of the NEB was not obtained and so no value is reported, though the larger calculated formation energy suggests it likely is not an important defect for any value of the Fermi level. For most barriers, three images were sufficient to calculate the barrier height.
We note that our approach—using a classical potential coupled with TAD to identify dominant pathways—is not guaranteed to identify all important paths. In particular, it is possible that a pathway that has a high barrier with the potential could have a low barrier within DFT. This is always an issue for any such MD + DFT approach. Further, the set of paths sampled is limited by the simulation time. For example, we have only seen one path for cation interstitials associated with that defect moving along the c axis of the crystal. However, there must be pathways that move the defect in perpendicular directions—but they must be of significantly higher migration energy. We have not attempted to find such paths. Again, we assume that the landscape described by the empirical potential is qualitatively representative of the DFT landscape and that the fastest pathways will be the same in both. Indeed, in our previous work on the cation interstitial [13], we found good agreement between DFT and the classical potential for the fast pathway identified in this way, suggesting that there is good equivalence between the two landscapes. We assumed this equivalence extended to all considered charge states of the defects, reminimizing the same pathways with different charges.
In addition to migration barriers, the ground state energetics of each defect were also calculated using the same DFT approach. For self-interstitial defects, the position (split-dumbbell vs. interstitial site) and configuration of the defect was initiated from TAD-derived structures and minimized in DFT to find the true ground state. The formation energy of the defect is defined according to the formalism

following Zhang and Northrup [24]. In this expression ![$E_{{\text{def}}}^{{\text{tot}}}\left[ {{X^q}} \right]$](https://content.cld.iop.org/journals/2516-1075/5/2/024007/revision3/estacd158ieqn3.gif) refers to the DFT calculated energy of the cell with the defect
refers to the DFT calculated energy of the cell with the defect  with charge
  .
.  refers to the energy of the cell without defects,
  is the chemical potential for each species
  , and
, and  represents the number of atoms (and/or electrons) which must enter or leave a cell to form the defect. A detailed description of how chemical potentials are defined in reference to the DFT cell energies is given in
 ![$\varepsilon \left[ q \right]$](https://content.cld.iop.org/journals/2516-1075/5/2/024007/revision3/estacd158ieqn10.gif) —and in this study we follow the charge correction methodology recommended by Kuamgai and Oba [25] as it is more appropriate for anisotropic materials such as Fe2O3. In prior work, we obtained formation energies from rhombahedral primitive cells and had found a rather minor dependence on cell size for vacancy defects. However, for the present study we noticed a significantly larger effect (up to 1 eV) for interstitial defects on both sub-lattices. Accordingly, in the present work formation energies and migration pathways are both reported from 960 atom orthorhombic cells. This ensures consistency in formation energies across all defects.
—and in this study we follow the charge correction methodology recommended by Kuamgai and Oba [25] as it is more appropriate for anisotropic materials such as Fe2O3. In prior work, we obtained formation energies from rhombahedral primitive cells and had found a rather minor dependence on cell size for vacancy defects. However, for the present study we noticed a significantly larger effect (up to 1 eV) for interstitial defects on both sub-lattices. Accordingly, in the present work formation energies and migration pathways are both reported from 960 atom orthorhombic cells. This ensures consistency in formation energies across all defects.
3. Results
The barriers for migration energy along with the formation energy of each defect are summarized in table 1. Defect formation energies are reported for a Fermi level at mid gap (intrinsic semi-conductor treatment) and for chemical potentials corresponding to oxygen at standard temperature and pressure, following the methodology described in
Table 1. Calculated mid-gap defect formation energies (for chemical potentials corresponding to oxygen at standard temperature and pressure) and calculated migration barriers (lowest value for a percolating pathway) for intrinsic defects of varied charge states.
| Defect | Charge | Kröger–Vink | Formation (eV) | Migration (eV) |
|---|---|---|---|---|
| VFe | 0 |

| 3.16 | 1.36 |
| −1 |

| 2.20 | 1.33 | |
| −2 |

| 2.68 | 2.05 | |
| −3 |

| 0.80 | 2.12 | |
| VO | 2 |

| 3.44 | 1.24 |
| 1 |

| 3.39 | 1.18 | |
| 0 |

| 3.46 | 1.30 | |
| Fei | 3 |

| 4.84 | 0.64 |
| 2 |

| 4.38 | 0.81 | |
| 1 |

| 4.56 | 1.46 | |
| 0 |

| 4.88 | 2.41 | |
| Oi | 0 |

| 2.28 | 0.46 |
| −1 |

| 4.81 | n/a | |
| −2 |

| 2.89 | 0.44 |
Our thermodynamic results suggest that oxygen vacancies have a higher formation enthalpy than Fe vacancies. On this basis one might expect the former to be less prevalent, in contrast to empirical observations [9, 27]. However, entropic contributions to the free energy stabilize oxygen vacancies and destabilize Fe vacancies when formed by reactions with O2 gas in the environment. That calculation is beyond the scope of this paper, which is focused solely on the energetic landscape, but will be treated in an upcoming manuscript.
Due to the low symmetry of the corundum structure, many defects have several migration pathways with different barriers, not all of which lead to long range migration. The values given in table 1 correspond to the lowest barrier for a percolating path, though competing paths may exist, and defect diffusion is anisotropic in most cases. This is described in detail for each defect type individually in the following subsections.
3.1. Cation vacancies
Three unique migration paths for the cation vacancy emerged from the TAD simulations and are illustrated in figure 1. Two configurations have similar energy, and effectively constitute two unique ground states. One can be considered a split vacancy structure and the other as a single vacant site. These represent the initial and intermediate minimum in the c-axis path described in figure 1(e), respectively. A third minimum, only stable for some charge states, also exists at least 1 eV higher than the ground state structure. This is the intermediate minimum for the pyramidal path in figure 1(c). During the migration, depending on the distortion of the surrounding polyhedra, we can see three different transition state structures: trigonal planar, square planar, and tetrahedral.
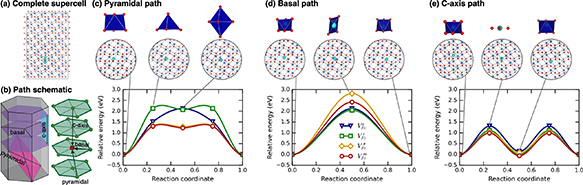
Figure 1. TAD found and DFT-refined migration pathways and energetics for VFe. (a) Full utilized supercell. In this, and subsequent, images, the oxygen ions are red, the Fe are blue, and moving atoms are represented in cyan. This schematic represents a superposition of all of the positions visited in the c-axis migration path. (b) Schematics of the three determined migration paths and their relationship to the crystal structure of Fe2O3. (c) Pyramidal path with net migration pathway energies. (d) Basal path with net migration pathway energies. (e) c-axis path with net migration pathway energies. In these figures, the polyhedra of the initial, transition, and final states are shown above the atomic representations. The minimum energy path, as determined by NEB calculations and as a function of charge state, is shown for each type of hop.
Download figure:
Standard image High-resolution imageFrom the ground-state structure, the vacancy (and the corresponding ions that are actually moving during the vacancy migration event) can move along the c axis to either adjacent site to form the nearly-degenerate but structurally distinct split-vacancy configuration; however, no further migration along this path is possible and each split-vacancy site can only transition to a single neighboring vacancy site. As such, this c-axis path, illustrated in figure 1(e), is non-percolating and contributes little to long range diffusion despite having the lowest barrier for all charge states. From the split-vacancy structure, the vacancy can migrate directly to another split-vacancy site within the same basal plane (the basal path in figure 1(d)). The barrier for this path is sensitive to charge state, with significantly more expensive migration for the doubly charged vacancy than the triply charged vacancy. The third and final transition pathway lies within pyramidal planes, including both basal and c-axis components. For charged defects, this pyramidal path, shown in figure 1(c), includes a slight local minimum as the defect traverses the anion basal plane while the neutral defect sees a simpler single barrier with that local minimum becoming a saddle point (or an extremely shallow minimum that was unresolvable with our NEB calculations). In either case, successful migration via this path involves moving through the intermediate minimum onward to another split-vacancy site. The collection of pathways describing cation vacancy migration is summarized in the schematic in figure 1(b).
The relative energetics of paths change with defect charge, and the non-percolating path can combine with either of the two percolating paths, influencing the anisotropy of diffusion, which will be discussed in greater detail below. However, it is important to note here that the dominant percolating path does depend on charge state. For the −2 charge state, the basal path is much higher in energy than the pyramidal path, and pyramidal migration will be preferred. For all other charge states, the basal and pyramidal paths have similar energies, indicating a mix of pyramidal and basal motion will contribute to migration. Finally, the −2 and −3 charge states of the Fe vacancy migrate the fastest with a barrier of about 1.3 eV, while the 0 and −1 charge states migrate more slowly with barriers closer to 2 eV.
3.2. Anion vacancies
The TAD simulations only identified two unique paths for the anion vacancy, as shown in figure 2. For the basal path (figure 2(c)), the vacancy remains on a given basal plane of the hexagonal close pack structure of the anion sublattice. For the pyramidal path (figure 2(b)), the defect moves instead within a pyramidal plane to a neighboring basal plane. The coordination of cations with the vicinity of the defect breaks the symmetry of defect migration, and accordingly only 2 of the 6 basal paths and 4 of the 6 pyramidal paths have low barriers. Further, for the basal path, the available jumps are arranged into unconnected triangular rings, rendering the pathway non-percolating. Thus, much like the cation vacancy, the lowest energy path does not dictate the activation energy for diffusion, but may contribute to anisotropy. In contrast to the cation lattice and as shown in figures 2(b) and (c), the migration barrier changes very little with the charge state. The largest change is for the pyramidal path, amounting to only a ∼0.1 eV difference between neutral and singly charged defects. The migration energy for percolating transport of anion vacancies is about 1.2–1.3 eV for all charge states.

Figure 2. Energetics for VO migration in Fe2O3. (a) Schematics highlighting the paths that the oxygen vacancy can take through the crystal structure of Fe2O3. (b) and (c) Energy profiles of the minimum energy paths (MEPs) found for the oxygen vacancy as a function of charge state for (b) the pyramidal pathway that moves the vacancy to a neighboring basal plane and (c) the basal pathway that keeps the vacancy within a given basal plane of the hexagonal structure of the crystal.
Download figure:
Standard image High-resolution image3.3. Anion interstitials
Only one low-energy pathway was revealed by the TAD simulations for anion interstitial migration, which follows nearest neighbor paths within the pyramidal planes. This pathway is illustrated in figure 3. The ground state for this defect is a split dumbbell configuration, such that the defect moves by an interstitialcy mechanism (where the O interstitial pushes out a lattice atom, replacing it and changing the identity of the interstitial). The migration barriers obtained for neutral and doubly charged defects are similar, at 0.46 eV and 0.44 eV, respectively. The preferred charge state is one of these two across the entire bandgap, and the singly charged defect always required a significantly higher energy to form. On the other hand, when following the same migration path,  exhibits no barrier and in fact has a slightly lower energy in what for the other charge states was the saddle point configuration. At this time, it is not clear whether this indicates a different ground state configuration for
  than
than  and
and  or simply a metastable state which arrests the energy minimization prior to reaching the true minimum. However, given the relatively unlikely formation of this charge state (see table 1), we have not pursued this further.
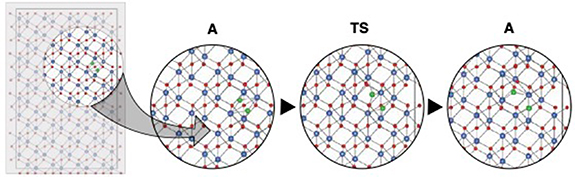
Figure 3. Low-energy and percolating pathway identified for the oxygen interstitial. The moving atoms comprising the split-interstitial structure in the initial configuration are highlighted in green.
Download figure:
Standard image High-resolution image3.4. Cation interstitials
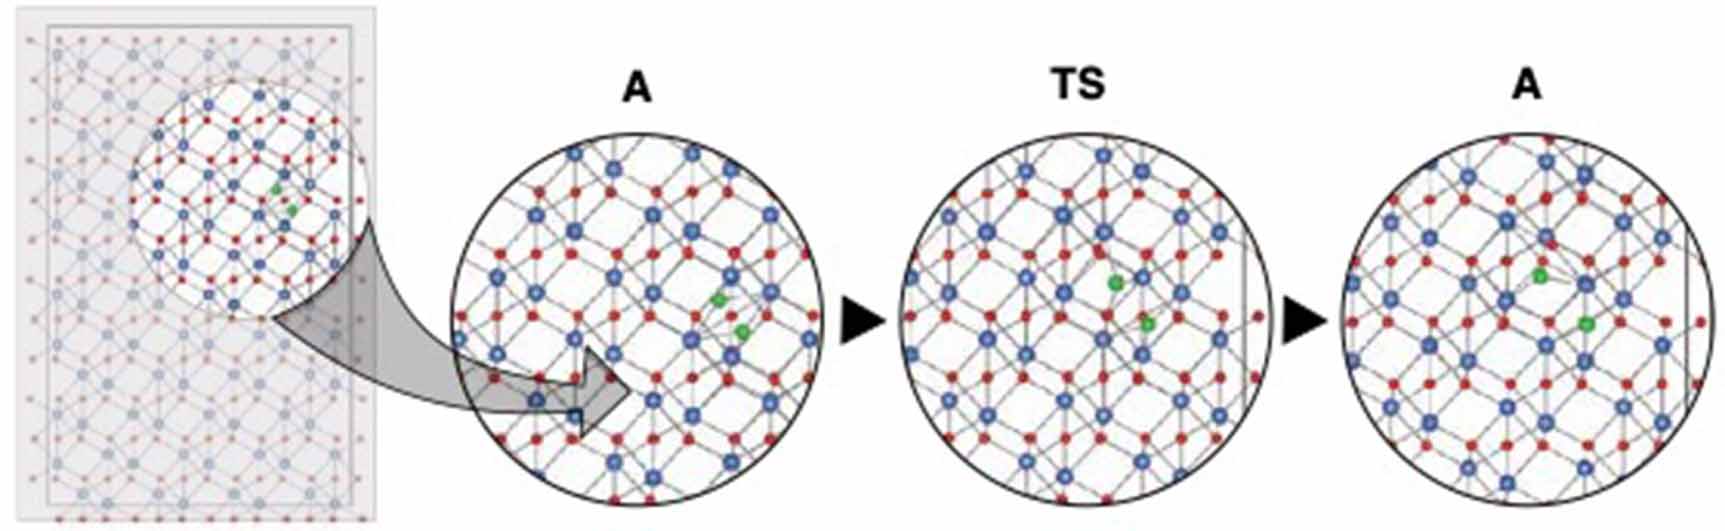
We have already discussed the migration of cation interstitials in our previous work [13]; here we summarize those results for completeness. For cation interstitials, TAD found a strongly dominant (very low energy) pathway along the c axis. The ground state configuration is for the additional Fe atom to occupy an interstitial site located at the center of a hexagonal ring of cations. Despite this, the defect still prefers to move by an interstitialcy mechanism, similar to the anion interstitial. This involves the coordinated motion of three atoms, displacing the defect by three basal planes in a single hop. Due to the anti-ferromagnetic (AFM) ordering of cations in hematite, this migration mechanism requires at least a temporary magnetic disordering on the traversed basal planes, as atoms from one plane move to the next, as described in greater detail in our previous publication [13].
Here, the previously reported analysis for the triply charged defect is expanded to include states spanning neutral to fully charged. Unfortunately, due to the complexity of this path (most likely due to the magnetic ordering with neighboring cations), NEB calculations did not always fully converge. Thus, for  and
and  we report an estimated migration barrier based on single point energies of individual images from NEB calculations converged for the other charge states. To validate that this gives reasonable estimates, we performed the same process for
  , where we both optimized the NEB calculation and calculated single point energies of the images from a NEB converged for
  . The saddle energies obtained via these two approaches were 0.81 and 0.88 eV, respectively, providing confidence that the single-point estimates are reasonable.
Obtained migration barriers of  are provided in table 1. These differences in migration barrier vs charge state suggest a prominent effect of the Fermi level on the kinetics for cation transport. Namely, when the Fermi level sits near the valence band maximum, triply charged defects will be easy to form and migrate quickly through the lattice. As the Fermi level rises, increasingly neutral defects will be preferred thermodynamically, but these defects are much less mobile. That is, two effects will occur as the Fermi level moves toward the conduction band: there will be fewer interstitials, and each interstitial will move more slowly. Thus, a rising Fermi level reduces the activity of the interstitialcy mechanism for cation diffusion.
4. Anisotropy
Due to the low symmetry of the corundum structure, the diffusion of point defects is not necessarily expected to be isotropic. Indeed, experimental studies have reported anisotropic transport in this and related structures [28] in which, for example, cation transport along the c axis is much greater than perpendicular to the c axis. To capture deviations from isotropic transport, the defect flux may be written

where  are the components of the diffusion tensor. For the isotropic case,
  is diagonal, with each entry equivalent to the diffusion coefficient

where  is the number of migration paths,
  is an attempt frequency (usually the phonon frequency),
  is a jump distance, k is Boltzmann's constant, T is temperature, and
  and
and  are the entropy and enthalpy changes between ground state and saddle point configurations (the so-called entropy and enthalpy of migration). If either the migration barriers change between paths or the paths are not isotropically distributed, the components of the tensor are given by [29]:

summed over all possible jump paths. For the corundum structure, this results in a tetragonal symmetry with two unique components
(bold symbols referring to tensors or vectors) in a coordinate system where the third direction is oriented along the c axis of the crystal.
For the interstitial defects, there is only one set of migration barriers, so the degree of anisotropy is determined solely by the set of jump vectors  . The simplest example is the cation interstitial, which migrates solely along the c-axis and hence
  . Our TAD simulations did not identify a pathway for cation interstitials with a basal component in their migration. Barriers have been reported in the literature for such paths [30], but they are much higher in energy (about 1.9–3.7 eV in Cr2O3, depending on charge state) and, for simplicity, we ignore them in this analysis. The anion interstitial migrates within pyramidal planes and the hops have both a and c components. However, all jumps for this defect have an identical barrier, such that the ratio between a and c becomes
This ratio will not change with temperature (neglecting effects due to e.g. thermal expansion) or charge state, though the magnitude of each component has an Arrhenius dependence, which varies between defects of different charge.
The vacancy defects are more complex, and anisotropy analysis must account for the non-percolating nature of some paths (i.e. paths that, when repeated, cannot move the defect long-range through the crystal), multiple barrier heights, and changes in preferred path between charge state. The cation vacancy has three migration paths, of which one (the c-axis path) is non-percolating. However, this non-percolating jump may still contribute to long-range diffusion if it is immediately followed by a jump along one of the other two paths. Accordingly, we include 'compound' hops (1) c-axis + basal and (2) c-axis + pyramidal that account for their possible contribution. A net displacement vector  and frequency for the compound hop which follows first path (1) then (2) are given by


where  gives the probability that the second step in the process follows path (2) instead of any other available path including a return to the initial position along path (1). The anion vacancy also has percolating and non-percolating paths, and the set of compound hops for each defect are illustrated in figure 4.

Figure 4. Schematics illustrating the motion of atoms involved in direct jumps (solid lines) and compound paths containing non-percolating hops (dashed lines) for (a) iron and (b) oxygen vacancy defect migration in Fe2O3. In this schematic, the compound event is defined by combining the associated dashed mechanism with the c-axis mechanism (for the Fe vacancy) and the basal mechanism (for the O vacancy) for the anisotropy analysis. For the cation lattice the non-percolating jumps are oriented along the c-axis while for the anion lattice they lie in the basal plane. For the anion defect, subsequent pyramidal hops are only sketched for one of the two possible non-percolating jumps. (c) Diffusional anisotropy is shown for cation vacancies, demonstrating a dependence on both temperature and defect charge state. For the interstitial defects anisotropy is strictly temperature independent while for the anion vacancy it varies by only a few percent.
Download figure:
Standard image High-resolution image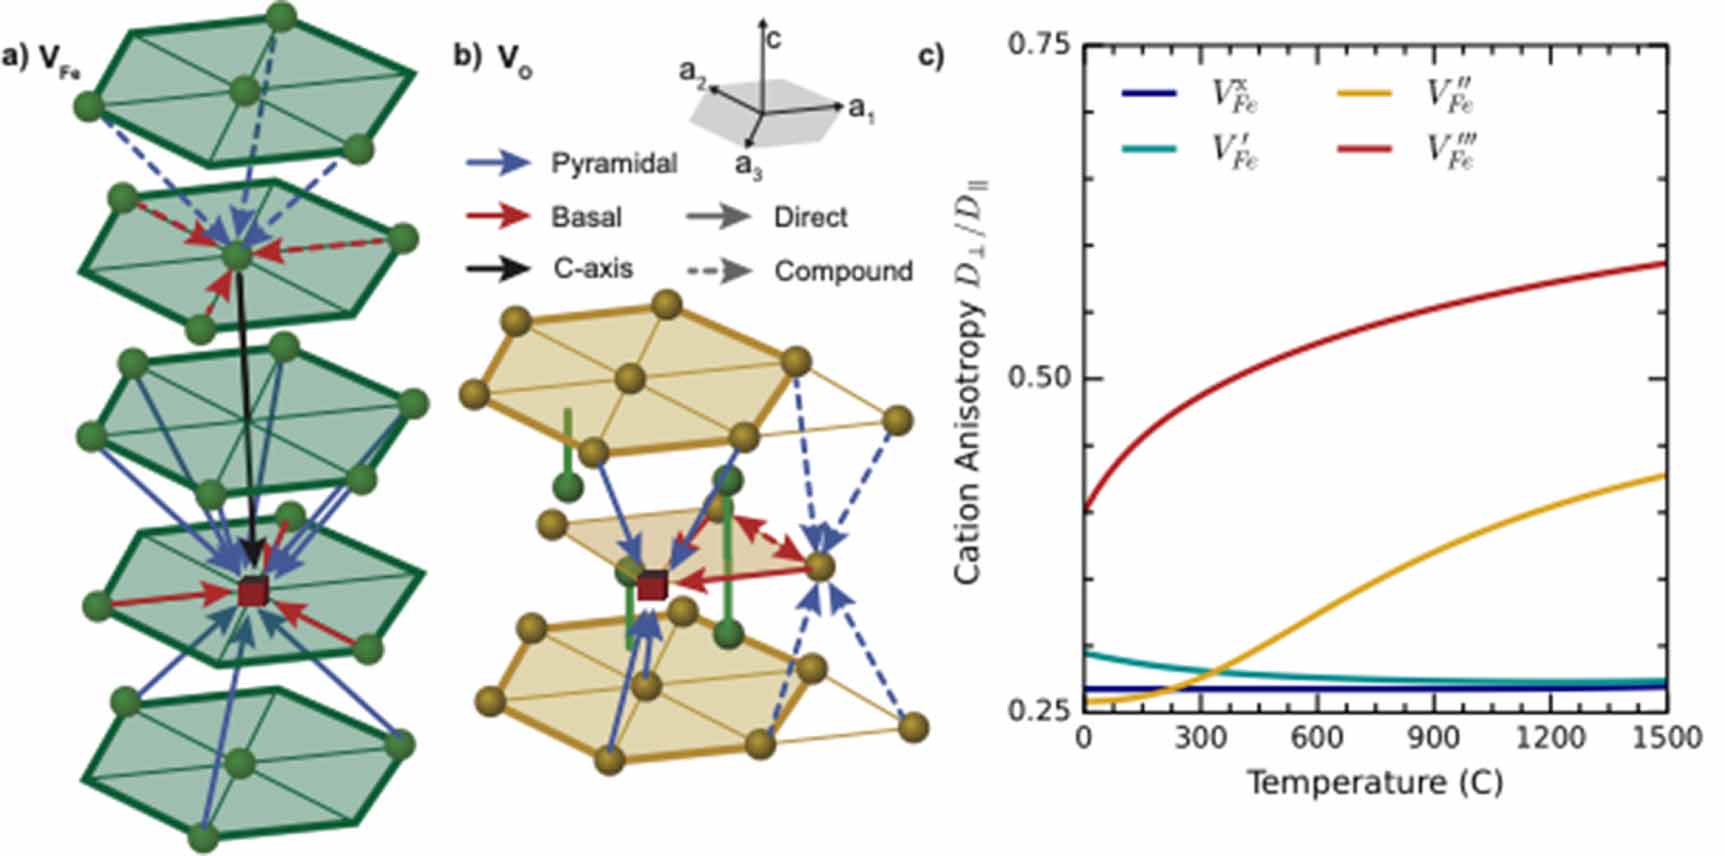
The ratio of basal ( ) to c-axis (
 ) diffusion is given at 500 C for each of the four defects in table 2. In principle, the attempt frequencies and saddle point entropies could change between the different types of paths, but for the purposes of this work, these are assumed to be equivalent. Note that this may perturb the degree of anisotropy slightly, but would only have strong impact if
  (and given that
  is usually on the order of Boltzmann's constant, is unlikely even at high temperature). The relative barrier heights for the vacancy defects change with charge state, which has a more pronounced effect on anisotropy. This is most notable for the cation vacancy, where the −3 charge state allows more basal diffusion than the other charge states due to the more favorable energetics of the basal path in comparison to the other charge states. A mild temperature dependence appears in the anisotropy of this defect, as shown in figure 4(c), as the relative frequency for activating the non-percolating hop (which promotes c-axis diffusion) is temperature dependent. Notably, no point defect in Fe2O3 strongly favors basal diffusion, with a range of c-axis preference from fully 1d for the cation interstitial to the nearly isotropic anion vacancy. This is broadly consistent with experimental findings of faster tracer diffusion along the c axis in the corundum structure, including in hematite [28].
Table 2. Diffusional anisotropy of each defect at 500 C for the charge state preferred when the Fermi level is mid-gap.
| Defect | Daa /Dcc |
|---|---|

| 0.83 |

| 0.15 |

| 0.52 |

| 0.0 |
5. Discussion
Our results provide critical data regarding defect transport for Fe2O3 that fills in a significant knowledge gap for this material. By combining classical potential-based TAD with DFT, we are able to remove some of the guesswork in identifying pathways for defects in these types of complex structures. As noted, we have not fully enumerated all possible migration mechanisms, but we have identified what we expect are the dominant paths for this structure. This approach, of using a classical potential to explore the potential energy surface and DFT to refine the energetics, is very powerful, but relies upon some level of equivalence in the potential energy landscape in the two descriptions. Possibly fortuitously, for the corundum structure, we seem to have that equivalence (with the possible exception of one of the charge states of the oxygen interstitial). The resulting pathways and thermokinetic data will be invaluable for mesoscale models of radiation damage and corrosion.
Beyond providing raw values, we also find some surprising behavior that is fundamentally interesting. In particular, we have found that, even though for the most part the elementary hops are similar for different charge states of a given defect, the relative height of the associated barriers changes. This is most pronounced for the cation vacancy, where the relative rate of basal versus pyramidal hops changes with charge state. This leads to a significant shift in the anisotropy associated with transport due to this defect and would suggest that the anisotropy would be a strong function of the electronic properties of the material, for example as modified by aliovalent doping. Another important factor is the role of non-percolating hops. In many DFT studies, these are often ignored as they do not lead to net migration of the defect. However, as shown here, such paths do provide access to other percolating pathways and thus do impact the overall transport rates and anisotropy of diffusion. Thus, these paths do need to be accounted for when considering transport through the crystal.
Our observations for the 960 atom cell differ somewhat from our previously reported thermodynamic calculations of point defect formation energetics [16]. Some portions of those differences are explained in the
Finally, our reported kinetic barriers as a function of charge state for cation interstitials differ from those previously reported using DFT by Shousha et al [12]. These authors find that as charge state increases the barrier increases monotonically, whereas we find the exact opposite as shown in table 1. One difference among many between these studies is cell size, as they utilize an 80-atom cell (there are also differences in application of Hubbard U correction). Defect self-interactions across the 3d periodic cell can arise for a number of reasons. Strain interactions between interstitial defects can be substantial due to their large relaxation volumes [32], a matter further exacerbated for charged defects. In our 960-atom cell, such (electro-)mechanical self-interaction should be strongly reduced. To this point, we have noted significantly different formation energies (up to 1 eV) for interstitial defects between our present 960 atom cells and our prior work with 80 and 120 atom cells. This again highlights the importance of cell size not only as it relates to Coulombic self-interactions in the 3d periodic cell treatment of defects but also the mechanical contribution that we speculate can lead to dramatically varied migration barriers.
6. Conclusions
We have used a combination of TAD with a classical potential and DFT to first identify key migration mechanisms in the corundum structure and then optimize the energetics of those paths for α-Fe2O3. We consider all of the important charge states of all elemental point defects. We find interesting behavior in which, for some defects, the relative rates of individual paths shift with charge state and thus change the predicted diffusion anisotropy associated with that defect. This has important implications for the nature of mass transport as a function of the electrical state of the material (p- or n-type doping, for example). However, anisotropy always favors c-axis transport. We have also reassessed the thermodynamics of defect formation energies in this material. Together, these constitute the first complete thermo-kinetic database for native defect behavior in α-Fe2O3, which we will use in a future paper as the foundation of a mesoscale model of defect evolution in hematite. These results provide new insight into the transport of defects and their anisotropy in hematite and ionic oxides more generally.
Acknowledgments
This research was supported by FUTURE (Fundamental Understanding of Transport Under Reactor Extremes), an Energy Frontier Research Center funded by the U.S. Department of Energy (DOE), Office of Science, Office of Basic Energy Sciences (BES). This research used resources provided by the Los Alamos National Laboratory Institutional Computing Program. Los Alamos National Laboratory, an affirmative action equal opportunity employer, is managed by Triad National Security, LLC for the U.S. Department of Energy's NNSA, under Contract 89233218CNA000001.
Data availability statement
The data cannot be made publicly available upon publication because the cost of preparing, depositing and hosting the data would be prohibitive within the terms of this research project. The data that support the findings of this study are available upon reasonable request from the authors.
Appendix:
The purpose of this appendix is to address the question of how the chemical potential of each atom in a multi-element compound relates to the energy per atom manifest in DFT calculations. This is of particular importance for calculating point defect formation energies because the extra energy associated with added or removed atoms must be accounted for. DFT-based point defect formation energy calculations have been previously addressed in the literature by a number of groups [24, 31, 33–35]. Correction schemes to address differences between DFT energies and empirical enthalpies have been quite successful for calculating a phase's enthalpy of formation [36–38]. Prior work introduced two corrections needed to accurately capture formation enthalpies of transition-metal oxides (TMOs)—treated with a Hubbard-U correction, as done here—that are in agreement with experimental values. However, it is less clear that the same correction schemes are relevant for the potential of each element individually, which we examine in further detail here.
The first correction relates to the O chemical potential. The gaseous O2 molecule is the experimental standard state for O, and therefore important for computing the heat of formation of oxides. However, DFT (at the GGA-level) has errors associated with O2 binding energetics [39–43]. Accordingly, a correction for this overbinding  is assumed for the O2 molecule energy, such that:

where  is the energy per formula unit (pfu) reported by DFT for the O2 molecule in a box with varied dimensions and
  is a corrected value. (Note that we choose to ignore the contribution of zero-point energy to the energetics of the O2 molecule as (a) it is rather small—0.05 eV per O [44]—and (b) it is in any case superseded by the empirical corrections we apply to achieve agreement with experiment.) This correcting can be done either through adjusting the binding energy directly to match experiments or by fitting formation enthalpies to non-correlated oxide phases (which do not require Hubbard-U correction) [31, 37, 39]. Both methods provide similar corrections of 0.64–0.69 eV/O depending on the choice of exchange-correlation treatment (e.g. Perdew-Burke-Ernzerhof (PBE) vs. PBEsol). Our own calculated correction for the binding energy is
  0.78 eV using PBE-GGA and is what we will use for the consideration of correcting our O2 molecule DFT energies in this work.
The second correction is applied to correlated materials such as TMOs. In these systems, a Hubbard-U correction [20] is often applied to maintain the GGA-level of computational effort while improving calculated properties. As the metal reference state often used in the calculation of the formation enthalpy lacks this correction, there is a proposed error associated with using these GGA and GGA + U values together. Thus, a 'mixing' correction, as suggested by Jain et al [45] and subsequently others [37, 38], can be applied in order to obtain more accurate formation enthalpies of TMO materials. This correction has been shown to be a function of the transition metal content in the considered structure. That is, it scales with the number of cations in the oxide per formula unit (pfu). While these prior references provided models for mixing correction based on transition metal content, if an experimentally known enthalpy of formation  is available, a direct correction
  can be calculated as:

Here,  is the DFT-calculated energy of the oxide with stoichiometry x and y and
  is the DFT-calculated energy of the metal reference. Thus, an adjusted (corrected) internal energy for the oxide phase can be given as:

assuming no change is made to the energy of the pure metal phase. We note that, while convention has been that the correction is applied to the oxide, formally it could be applied to the metal instead. Based on a variety of Fe oxides, the correction for Fe2O3 with Ueffective = 5.3 eV was reported as −2.24 eV [37] and −2.26 eV [38] in previous work. In the present work, by fitting directly to the experimental Fe2O3 formation enthalpy [46] (rather than averaging over a range of Fe oxides), and using our O2 correction, we find a mixing correction of −2.17 eV, in fair agreement with these previously reported values based on different methods.
The application of these two corrections in regard to calculating point defect formation energies must be carefully considered. As written by Zhang and Northrup [24], the formation energy of an isolated point defect, X, with charge q within the grand canonical approach can be written as:

Here, ![$E_{{\text{def}}}^{{\text{tot}}}\left[ {{X^q}} \right]$](https://content.cld.iop.org/journals/2516-1075/5/2/024007/revision3/estacd158ieqn61.gif) is the energy of the cell containing defect
is the energy of the cell containing defect  ,
,  is the energy of the cell without the defect,
 ![$\varepsilon \left[ q \right]$](https://content.cld.iop.org/journals/2516-1075/5/2/024007/revision3/estacd158ieqn64.gif) represents charge and electrostatic corrections and is dependent upon cell size and defect charge,
represents charge and electrostatic corrections and is dependent upon cell size and defect charge,  are the chemical potentials for the atoms of species i, and
  is the difference in number of atoms of species i between the cell containing a defect and the cell without the defect (accounting for taking out/adding in atoms to create the defect). However, the corrections to the energy of the oxide phase as given by equation (A3) imply that the chemical potentials of the atoms in the oxide must also be different. In particular, both of the following must be satisfied


such that

where  is the energy per atom of species
  in the uncorrected DFT cell. The corrected energies of the defected and undefected cells become


which can be inserted into equation (A4). Interestingly enough, all of the corrections cancel, and one is left with simply

in which the corrected chemical potential reverts to the energy per atom in the DFT phase. Equation (A10), however, is not complete because the  values are only defined for a given phase and, in principle, a range of chemical potentials are valid as long as they satisfy the stability criterion of equation (A6).
The key question in applying equation (A10) lies in how much energy is associated with each atomic species, as discussed in [35]. This is a particularly challenging question when attempting to correlate the atomic enthalpy in one phase to a different phase. Equation (A5) maintains the formation enthalpy of the phase, but the energy distribution between elements will change with the location on the phase diagram. For instance, when the oxide is in equilibrium with oxygen gas, equilibrium demands

but, this does not necessarily mean ![$E_{\text{O}}^{{\text{DFT}}}\left[ {{{\text{O}}_2}} \right] = E_{\text{O}}^{{\text{DFT}}}\left[ {{{\text{M}}_x}{{\text{O}}_y}} \right]$](https://content.cld.iop.org/journals/2516-1075/5/2/024007/revision3/estacd158ieqn70.gif) . There is no reason to assume that the values of
. There is no reason to assume that the values of  are identical between the two phases. DFT energetics are insufficient to uniquely identify the values of
  in equation (A10) for a particular equilibrium condition. Put another way, it is not at all obvious upon which elements the chemical potential alignment values ought to be partitioned in the oxide phase to capture formation enthalpy. To illustrate this uncertainty, we consider two possibilities—first, that it just so happens that
 ![$E_{\text{O}}^{{\text{DFT}}}\left[ {{{\text{O}}_{\text{2}}}} \right] - {\mu _{\text{O}}}\left[ {{{\text{O}}_{\text{2}}}} \right] = E_{\text{O}}^{{\text{DFT}}}\left[ {{{\text{M}}_x}{{\text{O}}_y}} \right] - {\mu _{\text{O}}}\left[ {{{\text{M}}_x}{{\text{O}}_y}} \right]$](https://content.cld.iop.org/journals/2516-1075/5/2/024007/revision3/estacd158ieqn73.gif) . In this case, we find
. In this case, we find
for the energies in the oxygen rich limit. Alternatively, one might assume that ![${\mu _{\text{O}}}\left[ {{{\text{M}}_x}{{\text{O}}_y}} \right]$](https://content.cld.iop.org/journals/2516-1075/5/2/024007/revision3/estacd158ieqn74.gif) and
and ![$E_{\text{O}}^{{\text{DFT}}}\left[ {{{\text{M}}_x}{{\text{O}}_y}} \right]$](https://content.cld.iop.org/journals/2516-1075/5/2/024007/revision3/estacd158ieqn75.gif) are equivalent and that
are equivalent and that ![${\mu _{\text{O}}}\left[ {{{\text{O}}_2}} \right] = \frac{1}{2}E_{{{\text{O}}_2}}^*$](https://content.cld.iop.org/journals/2516-1075/5/2/024007/revision3/estacd158ieqn76.gif) , as defined in equation (A1). One can show that this gives
, as defined in equation (A1). One can show that this gives
which was a common method prior to the introduction of the mixing corrections [31].
As we noted earlier, neither choice affects the formation enthalpy of the compound which is assured by the interrelation of equations (A12) and (A13). However, this choice does influence the chemical potentials of individual elements, and therefore impacts point defect formation energies. In our view, while arguments can be made in favor of many choices to distribute corrections between elements in compounds, there is no clear physical basis to prefer any of them a priori. If known values can be applied from either experiment or higher levels of theory, those can, in principle, be used [35]. For the purposes of this work, we have selected equation (A12). In a subsequent study, we will show that this choice most successfully reproduces experimental data on diffusion and non-stoichiometry for hematite, though that agreement may well be fortuitous. Thus, for this work, based on our 960 atom cell, we have for the oxygen-rich limit an Fe chemical potential of −9.82 eV/Fe and an O chemical potential of −4.93 eV/O. Explicitly providing unmodified energies, corrections, and chemical potentials will greatly aid in reproducibility of future work. To this end, we provide the unmodified energies from this work in table A1.
Table A1. DFT output system energy values (E0) and values with correction from the Kumagai and Oba approach for finite-size cell effects.
| Defect | Charge | Kröger–Vink | E0 (eV) | K&O corrected (eV) |
|---|---|---|---|---|
| Bulk | 0 | — | −6609.368 | — |
| VFe | 0 |

| −6596.386 | — |
| −1 |

| −6593.357 | −6593.300 | |
| −2 |

| −6588.962 | −6588.774 | |
| −3 |

| −6586.985 | −6586.610 | |
| VO | 2 |

| −6609.237 | −6609.099–6605.0948 |
| 1 |

| −6605.128 | −6605.095 | |
| 0 |

| −6600.984 | — | |
| Fei | 3 |

| −6626.880 | −6626.494 |
| 2 |

| −6623.080 | −6622.901 | |
| 1 |

| −6618.732 | −6618.681 | |
| 0 |

| −6614.314 | — | |
| Oi | 0 |

| −6612.019 | — |
| −1 |

| −6605.441 | −6605.434 | |
| −2 |

| −6603.358 | −6603.311 |