
Abstract
Argon and hydrogen plasmas were produced by a Compact ECR Plasma Source (CEPS) attached coaxially to a large chamber. This paper presents characterization results of the two plasmas using a newly designed Langmuir Probe. Experiments in argon were conducted to benchmark the plasma parameters and to determine the efficacy of the CEPS for thruster applications, recommended by recent results (Ganguli et al 2019 Plasma Sources Sci. Technol. 28 035014), while the hydrogen experiments were undertaken to determine the typical range of plasma parameters for assessing the usefulness of CEPS for different applications. In argon plasma, high densities (≈1012 cm−3), high electron temperatures and plasma potentials are obtained at fairly low pressures ≈0.3–0.5 mTorr. The plasma potential drops substantially (≈65 V) within the CEPS itself, demonstrating its suitability as a plasma thruster. On the other hand, plasma densities are lower for hydrogen in front of the CEPS, and the electron temperatures and plasma potentials, higher. The hydrogen experiments have helped establish an important aspect of such plasmas. At low pressures (≈0.5 mTorr) plasma density is relatively low with a single, high temperature electron population; on the other hand, at higher pressures (≈6 mTorr), the plasma has two electron populations, a low temperature, high density population and another low density, high temperature warm population. For hydrogen this transition from the former (with single electron population) to the latter state (with two electron populations) occurs at a pressure, ≈3 mTorr while similar transition for argon occurs at ≈0.3 mTorr. Apart from the observed two states of plasma, each state with its own distinctive properties, another important feature of the hydrogen plasma is that the axial density profiles obey approximately n/B = constant although no such scaling is observed for argon.
Export citation and abstract BibTeX RIS
1. Introduction
Laboratory plasmas are produced by application of electrical energy, and the type of electrical energy employed is used to distinguish the different plasmas formed. This is so, since each form of electrical energy gives the plasma its own set of distinctive properties that may be exploited for specific applications, giving rise to the concept of dedicated plasma sources [1]. Thus one has DC plasma sources, AC and low frequency RF plasma sources, high frequency RF and helicon plasma sources, surface wave plasma sources, microwave and electron cyclotron resonance (ECR) plasma sources, etc [1–5]. Amongst the different plasma sources, there are those that rely on the absorption of plasma waves launched in the plasma, like the microwave and surface wave plasma sources. Another example is the helicon plasma source [6, 7], where plasma is sustained by absorption of RF, whistler waves (helicon waves) either through Landau damping or by collisions [8, 9]. The ECR plasma source is another notable source [10–12], where high frequency whistler waves (in microwave range) are absorbed very efficiently in the vicinity of ECR zone [13–15]. In particlar, they yield very high-density, overdense plasmas that find various applications [16–21]. It is worth mentioning here that it is only in unbounded unmagnetized plasma that there exists a cut-off density [ωpe < ω (ωpe: plasma frequency, ω: wave frequency in radians)] above which wave propagation is not possible. In ECR produced plasmas, microwaves are launched as whistler waves inside a conducting waveguide in presence of an inhomogeneous axial magnetic field, decreasing along the waveguide axis. However, the condition for wave propagation is now reversed and reads, ωpe > ω. The additional condition required for whistler wave propagation is ωce > ω (ωce: electron cyclotron frequency in a magnetic field) [5, 22, 23]. As the wave propagates along the decreasing magnetic field it may encounter a resonance surface, where ωce = ω, following which the wave goes into cut-off for lower fields (ωce < ω). It may be noted that the plasma densities obtained in typical ECR discharges are high and considerably greater than the critical density corresponding to ωpe = ω [11, 24–26].
It turns out that in plasma loaded waveguides, the nature of the whistler modes can be altered considerably when the boundary conditions imposed by the waveguides are included, though the fundamental nature of the resonance described above remains unaffected. These modes have been studied in detail in several earlier papers [9, 11, 15, 24].
The authors' group at IIT Delhi has developed a permanent magnet based, highly portable, high density Compact ECR Plasma Source (CEPS) [27] that may be used in a number of ways. For instance, it has been used as a standalone source for filling any moderate volume system with high-density argon plasma with moderate power (∼300–400 W) [17, 28, 29] or, using multiple CEPS to fill, industrial sized, large volume chambers (∼1.2 cu. m) with plasma using moderate microwave power levels (∼7 kW of power) [30, 31].
A configuration that allows for considerable flexibility in investigations and applications is one in which a single CEPS is connected coaxially to a very large vessel, an expansion chamber. In such a configuration the CEPS magnetic field produces a diverging field in the expansion chamber, decaying exponentially along the chamber axis. The authors have used this configuration extensively to characterize argon and hydrogen plasmas at different pressures and microwave powers. This paper presents some of these results.
Apart from calibration of the CEPS for plasma production in the above configuration, argon plasma was also investigated to determine the possibility of using the CEPS as a thruster for deep space vehicle propulsion. In general, plasma based thrusters are attractive on account of the very high specific thrusts attained by them. Additionally, they also have the advantage that the electric field required for accelerating ions are generated internally within the plasma itself, and not by external power supplies, as has to be done for ion thrusters [17, 32]. Helicon plasma systems, for instance, are known to produce 'double layers' with fairly large potential drops that can accelerate ions [33, 34]. The ECR mechanism, on the other hand, can heat electrons to high temperatures, which result in very large plasma potentials that can also accelerate ions to high energies. It is worth mentioning here that helicon thrusters (thrusts ∼ few mN) and VASIMR (thrusts ∼ few N with additional ion heating) have been studied extensively [35–37] with input powers levels ∼kW. In comparison, studies on ECR thrusters are relatively few, with the associated technology development still far from mature [38, 39]. Our investigations using the CEPS based plasma thrusters are an attempt to show that ECR plasma thrusters may indeed be strong contenders if nurtured suitably. This possibility is not unrealistic considering that the CEPS because of its high electron heating potential, compactness and efficiency, may in reality well prove to be a highly attractive alternative to other conventional plasma thrusters. Preliminary studies wherein the CEPS was connected to a small test chamber have already given such indications [17].
The studies with hydrogen, on the other hand, were conducted because of the general usefulness of hydrogen plasmas for a wide variety of applications that require reduction, passivation and cleaning in materials processing, thin film applications and nanoscale fabrications. The applications range from improving selectivity of graphene monolayers [40], fabrication of graphene ribbons using hydrogen plasma etching for nanoelectronics and spintronics applications [41–43], improving photo-catalytic performance of hydrogenated TiO2 nanoparticles [44], removal of corrosion layers [45], rendering diamond-like-carbon films more corrosion resistant [46], selective heating of transition metals for fabrication of nickel-silicide electrodes for ultra-large-scale integrated devices, etc [47]. A somewhat different application pertains to the extraction of H− beams from hydrogen plasmas for neutral beam heating of fusion plasmas [48, 49].
In what follows characterization results for argon plasma are presented first, following which results for hydrogen are presented. As will be seen there are considerable differences in the plasma properties of the two gases on account of the differences in their mass, as well as because hydrogen is a molecular gas, which gives it additional degrees of freedom. The latter aid the molecules in acquiring energy from electrons, which in turn alter the energy balance of electrons quite significantly. Apart from calibration of the CEPS, the argon experiments were performed mainly with the CEPS thruster in mind. The hydrogen experiments however, are expected to reveal specific plasma properties that could find use in a variety of applications both, new or known. It may be noted, however, that the argon and hydrogen experiments presented here are a first of their kind, on account of the fact that the CEPS is a relatively recent device and its working is yet to be fully understood, explored and exploited.
2. Experimental setup and diagnostics
Figure 1 shows the experimental system comprising the CEPS (ID ≈ 9.1 cm, length ≈11.6 cm) [17, 28, 29] that is connected coaxially to a large expansion chamber (ID ≈ 48 cm, length ≈75 cm). The CEPS has a set of NdFeB ring magnets that creates a magnetic field whose ECR surface lies within the CEPS and produces a diverging field that decays exponentially along the expansion chamber with scale length, λM ≈ 9.2 cm (figures 1(a) and (b)). All the experiments were performed at fixed microwave power. The net power delivered to plasma (=forward power — reflected power) was ≈600 W (forward power ≈630 W, reflected power ≈30 W).
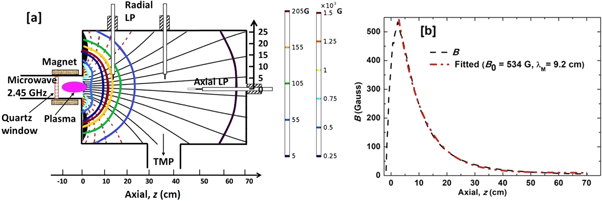
Figure 1. (a) Schematic of experimental setup and the contours (thick solid lines) of constant magnetic field with the field lines are shown inside the expansion chamber. Black (solid) lines are originating from inside the CEPS while red dashed lines are originating from outside the CEPS. (b) On axis magnetic field strength with fitted profile [B = B0 exp(−z/λM), λM = 9.2 cm] in expansion chamber. Expansion chamber starts at z = 0.
Download figure:
Standard image High-resolution imageAxial and radial, tungsten Langmuir probes (LP) were employed for obtaining plasma parameters (figure 1(a)). The tip of the axial probe was oriented along the magnetic field (i.e. the z axis). However, to protect it from head-on bombardment by energetic streaming ions, the tip itself was encapsulated in a ceramic cap. Such a construction restricts the probe collecting area to its midsection (0.25 mm dia. × 4 mm long) permitting particle collection normal to the magnetic field only. This design, arrived at after several trials, enabled the probe to survive the harsh plasma environment near the ECR zone inside the CEPS. Even then, it was necessary to keep sufficient distance from the ECR surface located at z ≈ −5.3 cm inside the CEPS to avoid damage to the probe. (The junction between the CEPS and expansion chamber is taken as z ≈ 0 (figure 1)). For argon for instance, LP data was recorded from z ≈ −3.5 cm to the end of expansion chamber. For hydrogen, on the other hand, the high bulk electron temperatures saturated the LP amplifiers both in the ion saturation and electron transition regions, so that LP data was mostly recorded from z ≈ 3 cm.
LP data was analyzed carefully for determining the bulk electron density (n), bulk electron temperature (Te), plasma potential (Vp) and warm electron density and temperature (nw, Tw), if present. The details of the LP procedure, data acquisition, its validity, and analysis of the plasma parameters from the I-V data can be found elsewhere [9, 50, 51]. As will be explained in section 3.2, for purposes of LP analysis and other reasons, it is reaonable to assume that the positive ions in the hydrogen plasma are all H+ ions. Figures 2(a) and (b) show typical I–V characteristics for the axial LP recorded at z ≈ 10 cm for argon and hydrogen plasma respectively, at 1 mTorr pressure and microwave power ≈600 W (cw). The plot of ln (Ie) versus probe voltage V in figure 2(a) for argon shows two distinct slopes indicating the presence of two electron populations. One population, detected at deeply negative probe biases, corresponds to a low density, high temperature (Tw ≈ 68 eV) warm population, while the other, found at low probe biases corresponds to bulk electrons with low temperature (Te ≈ 3.6 eV). In contrast, ln (Ie) versus V plot for hydrogen in figure 2(b) indicates that only one electron population—the bulk population, is present. It may be noted however that the bulk population has a much higher temperature (Te ≈ 27 eV).
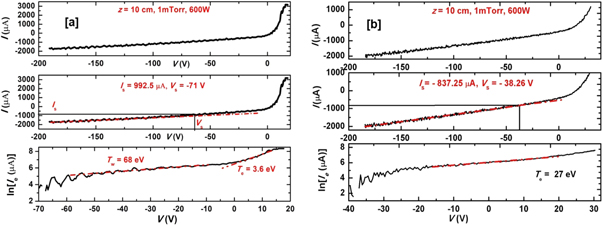
Figure 2. Typical LP characteristics of (a) argon plasma and (b) hydrogen plasma collected at z = 10 cm.
Download figure:
Standard image High-resolution image3. Plasma characterization results
3.1. Characterization of argon plasma
Axial profiles of the different plasma parameters are presented in figure 3 at argon gas pressures,  ≈ 0.3 and ≈0.5 mTorr and for ≈600 W (cw) microwave power. The profiles commence from z ≈ −3.5 cm, the closest one could approach the ECR zone inside the CEPS without damaging the probe. It is seen that the trends for the two profiles at
  ≈ 0.3 and ≈0.5 mTorr are approximately similar. For instance, closest to the ECR zone (z ≈ −3.5 cm), the bulk densities and bulk electron temperatures lie in the range n ≈ (0.25–1.0) × 1012 cm−3 and Te ≈ 15–20 eV, respectively. However, by z ≈ 0, these densities rise to, n ≈ (1.1–2.25) × 1012 cm−3 with a concomitant decrease in the bulk temperatures to about Te ≈ 5 eV. Accompanying this change in the bulk electron population, is the sudden onset of a separate warm electron population at z ≈ 0, with density, nw ≈ (0.7–1.3) × 1010 cm−3 and temperature, Tw ≈ 50–60 eV. Following these initial variations in n and nw within the CEPS (up to its edge), there is a rapid decrease in these quantities from z ≈ 0 to z ≈ 7.5 cm, after which they decrease more slowly to ≈(1–3) × 1011 cm−3 and ≈(3–3.7) × 108 cm−3 respectively, by z ≈ 55 cm. Also, after the initial sharp fall in temperature within the CEPS from ≈20 eV to ≈5 eV, Te decreases slowly with z (to ≈2.4 eV upto z ≈ 20 cm), settling finally at ≈2 eV at z ≈ 55 cm. Although the fall in Te is not severe, it will be seen later (figure 5) that the rapid fall in density from z ≈ 0 to z ≈ 7.5 cm is a consequence of magnetic and geometric expansion. Tw fluctuates marginally along the system length lying mostly within, ≈50 to 60 eV. It is observed from figure 3 that the plasma potential, Vp drops by about ≈65 V (from ≈104 V to ≈39 V) for ≈0.5 mTorr and about ≈39 V (from ≈77 V to ≈38 V) for ≈0.3 mTorr within the CEPS itself (from z ≈ –3.5 to z ≈ 0). Beyond z ≈ 0, Vp drops gradually, decreasing to about ≈20–25 V by about z ≈ 45 to 50 cm.

Figure 3. Axial profile of Argon plasma parameters at 0.5 mTorr (black square) and 0.3 mTorr (red circle). [a] bulk electron density (n), [b] warm electron density (nw), [c] bulk electron temperature (Te), [d] warm electron temperature (Tw) and [e] plasma potential (Vp).
Download figure:
Standard image High-resolution imageA few remarks regarding the nature of the CEPS produced plasma are in order. (i) It may be noted firstly that the plasma densities and electron temperatures are high (∼1012 cm−3) within the CEPS, even for ≈0.3 mTorr. This is due to the ECR heating mechanism that can yield high plasma densities even at fairly low pressures. The additional advantage gained from the CEPS is that its magnetic field offers better confinement resulting not only in high plasma densities (∼1012 cm−3) but high electron temperatures as well (15–20 eV); both features are of importance for thruster applications. (ii) A fairly ubiquitous feature of ECR plasmas is that the electrons either have a relatively low bulk density along with a high bulk temperature or a relatively high density, low temperature bulk population, accompanied by a low density, high temperature warm population. It is usual for ECR plasmas to show a transition from the former situation to the latter one, under a change of conditions that perturb the plasma somehow (viz. geometric or magnetic field expansion, etc). It turns out however, that at sufficiently low pressures this transition may be inhibited. For instance with argon, this transition is blocked for pressures below ≈0.05 mTorr, and for hydrogen this blocking occurs up to a much higher pressure, ≈2 mTorr. (iii) It is possible to interpret the profiles in figure 3 in another way. It was observed above that Tw varies between 50–60 eV. It turns out that the rate constant for ionization by electron impact on argon passes through a broad maximum precisely in this range of temperatures [5]. This implies that the warm electrons can be regarded as a source of ionization for plasma production. It follows therefore, that the bulk plasma density profile should follow the warm electron profile, since Tw is already in the correct range and will not exercise any control over the bulk density profiles. The strong correlation between the bulk and warm electron densities is seen clearly in figures 3(a) and (b). The latter feature is not new and has been reported in earlier studies on ECR plasmas [24, 52, 53]. (iv) From the thruster application point of view, the most important plasma parameter is the plasma potential. It is seen that the potential drops are very steep and can accelerate ions very efficiently as they exit the short section of the CEPS, giving strong indication that the CEPS may actually turn out to be an efficient thruster. Even inside the expansion chamber, the small gradient in Vp can give rise to a weak electric field that can help in overcoming friction due to collisions of ions with neutral atoms.
Radial LP profiles were taken at two axial locations: (i) Location R1 at z ≈ 13.8 cm; (ii) Location R2 at z ≈ 38.8 cm. Figures 4(A) and (B) give respectively, the radial variations of the plasma parameters at locations R1 and R2 for argon gas pressures,  ≈ 0.3 and ≈0.5 mTorr and 600 W (cw) microwave power. It is seen once again that the nature of the variations for the two pressures are approximately similar with the warm electron population being present in both cases. It can also be seen that the bulk density profiles mimic the warm population profiles, implying that the latter acts as a source for the bulk plasma since Tw is high enough for efficient ionization. The bulk densities for ≈0.3 mTorr are uniformly lower than that for ≈0.5 mTorr. Also, as expected, the densities for R2 are lower than that for R1. Another notable feature is that the radial spread of the plasma is higher for R2 as compared to that for R1. Vp is about ≈30 V for R1 and about ≈20 V for R2. It is also seen that Vp is nearly uniform along the radius indicating a very low radial electric field component.
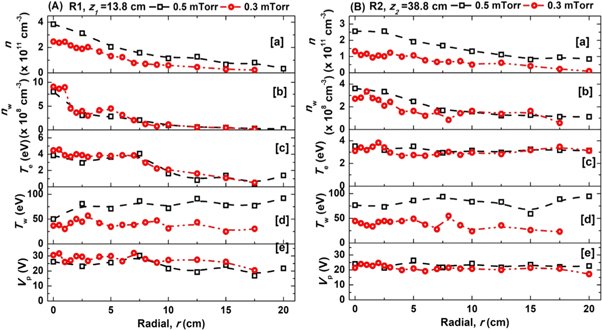
Figure 4. Radial profile of Argon plasma at pressure ≈0.5 mTorr (black square) and 0.3 mTorr (red circles), power ≈600 W at (A) z = 13.8 cm and (B) z = 38.8 cm respectively. [a] Bulk electron density (n), [b] warm electron density (nw), [c] bulk electron temperature (Te), [d] warm electron temperature (Tw) and [e] plasma potential (Vp).
Download figure:
Standard image High-resolution imageTo see the effect of the geometric and magnetic field expansion, profiles of the on-axis plasma density n, normalized with respect to their values at z ≈ 0, have been plotted for pressures, ≈0.3, ≈0.5 and ≈1 mTorr in figure 5 for z ≥ 0. For reference, the on-axis magnetic field B normalized with respect to its maximum at z ≈ 2.5 cm is also shown. It is seen that for all pressures there is an initial region from z ≈ 0 up to z ≈ 5–7.5 cm in which all densities fall faster than B. The latter is followed by a short transition region (up to about, z ≈ 10–15 cm) beyond which is another region (up to about, z ≈ 55 cm) where the densities fall slower than B. A possible reason for the initial rapid fall could be that closer to the source, the plasma that emerges from within the CEPS can through cross field transport, easily reach field lines that enter the expansion chamber from outside the CEPS (shown as red dashed lines in figure 1(a)) and are not loaded with plasma. As a result the plasma density drops more rapidly than B along the axis. As the plasma flows out along the axis to larger values of z, field lines that are still unloaded at these axial locations occur only at large values of the radius, thereby reducing the depletion of plasma from the central region and allowing the plasma density to drop less rapidly than B.

Figure 5. Normalized argon plasma density profile at different argon pressures. All the profiles are normalized with respect to their corresponding maxima. On axis magnetic field normalized with respect to peak value at z = 2.5 cm is also shown for reference.
Download figure:
Standard image High-resolution image3.2. Characterization of hydrogen plasma and comparison with argon results
Figure 6 shows axial profiles of n, Te, Vp and nw, Tw, (when the warm population is present) obtained at ≈600 W of microwave power and hydrogen gas pressures  ≈ 0.5 and ≈6 mTorr. The axial profiles start at z ≈ 3 cm, which is the closest the LP could be taken towards the CEPS mouth. Although hydrogen is a molecular gas, for temperatures above ≈0.2 eV, it can go into a highly dissociated state [54]. This would be easily possible in ECR plasma since ions typically acquire temperatures of ≈few tenths of eV, which they can transfer very efficiently to the neutrals through collisions. Thus in steady state the gas molecules would have sufficient energy to become dissociated into H atoms that ionize to produce H+ ions. Thus it would be reasonable (and convenient) to assume that the hydrogen plasma has only H+ ions, and not
 etc.
etc.
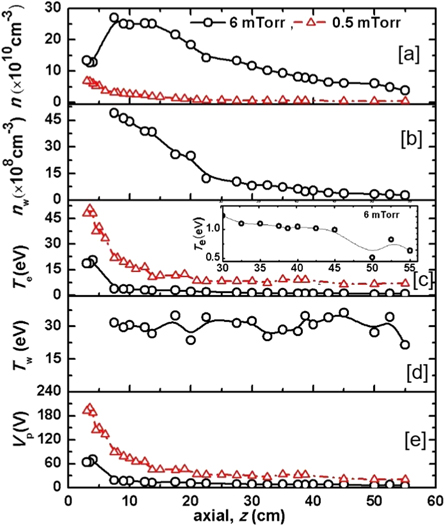
Figure 6. Axial profile of Hydrogen plasma parameters at 6 mTorr (black circle) and 0.5 mTorr (red triangle). [a] Bulk electron density (n), [b] warm electron density (nw), [c] bulk electron temperature (Te), [d] warm electron temperature (Tw) and [e] plasma potential (Vp).
Download figure:
Standard image High-resolution imageExamining the profiles for ≈0.5 mTorr first, it is seen that there is no warm population for this case. Instead one finds a relatively low, bulk density with n ≈ 7 × 1010 cm−3 decreasing smoothly with z to n ≈ 0.46 × 1010 cm−3 at z ≈ 55 cm. The corresponding bulk electron temperature starts at Te ≈ 45 eV and decreases monotonically to Te ≈ 7 eV at z ≈ 55 cm. Both, the fall in n and Te are on account of the diverging magnetic field that helps the plasma expand. (It may be recalled that a similar high temperature, low density population was observed for argon at 0.5 mTorr, though the densities there were higher and the Te values lower; the results for argon were obtained inside the CEPS, while those for hydrogen are about 3 cm in front of the source mouth.) It is interesting to note that the profile for n follows closely the Te profile, indicating that ionization within the expansion chamber is due to bulk electrons, with Te conrolling the profiles this time. It was noted above that Te decreases from ≈45 eV to ≈7 eV along the expansion chamber. It turns out that the rate constants for ionization by electron impact on H atoms are moderately high and vary marginally in this temperature range. Thus one may conclude that electrons in the bulk population have sufficient energy to maintain the plasma to offset plasma losses. Going on to the plasma potential, one sees that Vp ≈ 200 V at z ≈ 3 cm, which is much higher than what was obtained for argon. Since Vp is related to Te linearly, its profile tracks Te fairly closely. Vp decreases monotanically along the axis, falling to ≈20 V at z ≈ 55 cm.
The nature of the plasma profiles for ≈6 mTorr are very different from the profiles considered above for ≈0.5 mTorr. To begin with, one observes the presence of a warm population that commences not from z ≈ 3 cm, but from z ≈ 7.5 cm. Thus, as for argon, one finds a relatively low density (n ≈ 1.8 × 1011 cm−3), high electron temperature (Te ≈ 23 eV) population at z ≈ 3 cm. Due to the onset of expansion induced by the expanding magnetic field in the region, both the density and elecron temperature begin to fall. Thus, at z ≈ 4 cm, n ≈ 1.28 × 1011 cm−3 and Te ≈ 20 eV. As noted above however, the onset of the warm population at z ≈ 7.5 cm triggers a rise in the bulk density to n ≈ 2.7 × 1011 cm−3 along with a fall in Te ≈ 3.7 eV, at that location. The corresponding warm electron density and temperature are respectively, nw ≈ 5 × 109 cm−3 and Tw ≈ 32 eV. Beyond z ≈ 7.5 cm, all three quantities, n, nw and Te decrease monotonically in the expanding magnetic field, while Tw fluctuates between ≈30 eV and ≈40 eV. One observes once again the startling similarity between the bulk and warm density profiles, n and nw indicating clearly that the warm population is the source for the hydrogen plasma. Note that Tw does not exercise any control over the bulk density profile as it is large enough to ionize the H atoms all along the chamber. The plasma potential, Vp ≈ 65 V at z ≈ 3 cm, decreasing to a ≈ few Volts near the chamber end.
The difference between the densities and temperatures of the plasma at the two pressures is notable. Also noticeable is the relatively low density and high temperature of hydrogen with respect to argon. This can be attributed to the lower ionization rate constant and higher collisional energy losses for hydrogen [5, 55, 56].
As for argon, radial profiles of the different parameters for hydrogen plasma are presented in figures 7(A) and (B) at axial locations R1 and R2, corresponding to z ≈ 13.8 cm and ≈38.8 cm respectively, for pressures ≈0.5 mTorr and ≈6 mTorr. It is seen again that there is the warm population present only for ≈6 mTorr and not for ≈0.5 mTorr. The profiles are as expected. The most noticeable feature of the radial plots is the spread of the plasma density at R1 and R2. It is seen that at R1, the radial extend of the plasma for ≈0.5 mTorr is only ≈6 cm, while R2 it is about ≈15 cm. It may be recalled that for argon the radial profiles at R1 extend up to r ≈ 18 cm. The spread is a little higher for pressure ≈6 mTorr due to enhanced collisions (that aid cross-field transport) and is about ≈10 cm at R1, while at R2 it is about ≈20 cm. That the cross-field transport coefficient for hydrogen is smaller than that for argon is particularly noticeable at R1. Because the magnetic field is strong at R1 this reduction may be attributed to the difference in their masses, since the transverse transport coefficients are proportional to √(ion mass).

Figure 7. Radial profile of Hydrogen plasma at pressure ≈6 mTorr (black circle) and 0.5 mTorr (red triangles), power ≈600 W at (A) z = 13.8 cm and (B) z = 38.8 cm respectively. [a] bulk electron density (n), [b] warm electron density (nw), [c] bulk electron temperature (Te), [d] warm electron temperature (Tw) and [e] plasma potential (Vp).
Download figure:
Standard image High-resolution imageLike in figure 5 for argon, figure 8 gives the axial profiles of the hydrogen plasma densities at pressures of  ≈ 0.3, 0.5 and 1 mTorr, normalized to their maximum values in the range. As before, the normalized profile for the magnetic field is also shown. What is most noticeable about this set of profiles is that irrespective of the pressure, the density profiles follow for the most part (except for minor deviations) the B profile (i.e., n/B = const. scaling). It is a little unusual for such scaling to be observed in such a large chamber due to unloaded field lines penetrating the chamber from outside the CEPS since such field lines tend to get populated by plasma through cross-field transport.

Figure 8. Normalized hydrogen plasma density profile at different hydrogen pressures. All the profiles are normalized with respect to their corresponding maxima. On axis magnetic field normalized with respect to peak value at z = 2.5 cm is also shown for reference.
Download figure:
Standard image High-resolution image
However, it was seen in the radial profiles at R1 that cross-field transport is not very efficient for hydrogen. A similar result was observed in another set of experiments using argon reported recently by the authors, wherein the CEPS was connected to a small test chamber [13], and the n/B (=constant) scaling was found to hold very accurately along the entire chamber length, over a wide range of pressures. The latter results with argon are very different from the results presented above in figure 5, where considerable deviations from n/B scaling could be seen. Overall, one can state that n/B scaling is observed when cross-field transport is absent or inhibited and plasma flow occurs predominantly along the field lines, only to be lost at the chamber wall where the field lines intersect the latter. It is necessary however, for electrons to be fairly strongly magnetized, even though the ions need not be. The latter however, would have to be bound to the electrons (and hence the field lines) by quasineutrality.
4. Conclusions
In conclusion, argon and hydrogen plasma characterization results produced using the Compact ECR Plasma Source (CEPS) attached to a large chamber are presented. Apart from benchmarking the system (determining density, temperature, potential profiles, etc, at different pressures), the argon results give strong indication that it may be possible to develop the CEPS further for thruster applications. The hydrogen results are substantially different from those of argon, having lower plasma densities and higher electron temperatures and obeying the scaling, n/B = constant. It was seen that at low pressures the plasma density is relatively low with a single, high temperature electron population, while at higher pressures, the plasma passes to a state with higher bulk plasma density and two electron populations, a low temperature, high density population and another low density, high temperature warm population. One may exploit the situation by choosing to opt for either of the two distinct states by adjusting the pressure. The latter scenario holds for argon as well.
Although the current studies focused on argon and hydrogen, future studies have been planned that would explore the efficacy of CEPS for other gases and molecular gases in particular.
Acknowledgments
We wish to thank Prof P K Kaw, Prof. A K Chakraborty, Prof. M Bandopadhyaay and Prof. M Singh of the Institute for Plasma Research, Gandhinagar for motivating us to initiate the hydrogen plasma experiments at IIT Delhi and for the numerous related discussions. Thanks are due to the Central Research Facility, IIT Delhi for providing liquid nitrogen for the experiments and helping in probe fabrication. The authors would also like to thank Mr A J Josekutty and Mr Hasmukh Kabariya for their help with the experiments.