

Abstract
Nanostructured one-dimensional multiwall-carbon nanotubes have a variety of advantageous properties including good electrical conductivity and mechanical strength, and thus have been widely investigated for use in lithium-ion battery electrodes as conductive and microstructural additives, though they also possess some electrochemical activity. Their application to sodium-ion batteries has been less extensively researched, and therefore a greater understanding of the electrochemical reaction with sodium, and effects of slurry composition and electrolyte formulation is warranted, especially as these are likely components in future Na-ion electrode formulations. Here, we report the fabrication of aqueous and organic multi-wall carbon nanotube (MWCNT) negative electrodes processed by ball milling. The binder of choice is noted to greatly affect the electrochemical performance, both in terms of capacity retention and rate capability over a range of current densities from 25 to 500 mA g−1. Switching from a carbonate- to diglyme-based electrolyte considerably improves initial coulombic efficiencies (∼10%–60%), attributed to less extensive formation of solid electrolyte interphase, and enables a reversible mechanism with capacities up to 150 mAh g−1 over 100 cycles depending upon the binder used. Ex-situ characterization of the discharged and cycled carbon nanotubes by powder x-ray diffraction, transmission electron microscopy and Raman spectroscopy provide an insight into how MWCNTs undergo sodiation and demonstrate a partially reversible structural transformation during cycling when using the diglyme-based electrolyte. This work lays the foundation for a better understanding of these versatile materials, especially when used in the most promising alternative energy storage technology to lithium ion.
Export citation and abstract BibTeX RIS

Original content from this work may be used under the terms of the Creative Commons Attribution 4.0 license. Any further distribution of this work must maintain attribution to the author(s) and the title of the work, journal citation and DOI.
1. Introduction
Lithium-ion is the most energy dense battery technology commercially available, however rising lithium costs and uneven geographical distribution have led to the need for complementary technologies, especially for larger scale applications including grid energy storage deployments, backups and low-cost vehicles [1]. Sodium ion batteries (NIBs) have a wide range of chemistries available, and are touted as a cheaper and more environmentally friendly alternative because of the greater abundance of sodium, the use of aluminum current collectors and cobalt-free positive electrode materials [2–4]. Focussed efforts by large technology firms such as Contemporary Amperex Technology Co., Limited (CATL) to manufacture their own NIB technologies by 2023 show that the technology is very close to commercialization at scale [5].
One of the greatest challenges faced by NIBs has been the anode material of choice. Graphite is the most widely used negative electrode in lithium-ion batteries as it reversibly inserts lithium with a large specific capacity (∼372 mAh g−1). However, sodium intercalation into graphite is considered unfeasible, which was initially attributed to the larger ionic radius of Na+ (0.102 nm) vs. Li+ (0.076 nm) [6]. Recent DFT studies have actually shown that the major reason is the inability to overcome the energy barrier required to form staged intercalation compounds, as larger ions such as K+ (0.138 nm) can react with graphite reversibly [7]. As a result, many classes of anode material for NIBs have been developed over the past decades. These include metal alloys, metal-oxides, and organic and carbonaceous materials. Tin, antimony and mixed tin-antimony alloy anodes obtain extremely high capacities but face very large first cycle inefficiencies and large volume changes, leading to poor cyclability [8]. Metal oxide materials, such as sodium titanate exhibit a very low insertion potential, though its reliance on high amounts of conductive additive is an inherent issue [9, 10]. More recently, redox-active organic molecules have been considered due to their ease of fabrication and high sustainability, however they are still in their infancy as a viable alternative [11]. Amongst the carbonaceous materials, hard carbons (HCs) are now widely accepted as the most commercially viable option. These exhibit large reversible capacities with a low average potential which can be tuned through synthesis methods, although temperatures up to 1500 °C can be required to produce the best performing materials [12]. Additionally, HCs possess limited electronic conductivity and thus suffer from slow kinetics, leading to poor rate capability [13].
Multi-wall carbon nanotubes (MWCNTs) are a carbon allotrope exhibiting good conductive properties, structural stability and high aspect ratio, making them very attractive as conductive additives and prospective anode materials, especially in lithium-ion battery (LIB) [14]. There are a variety of different methods to produce and control their properties, such as arc discharge, laser ablation, and chemical vapor deposition [15–17]. Low-cost synthesis techniques using renewable resources or waste feedstocks can help to further implement their production at scale in a sustainable way [18, 19]. As an anode material, the reversible reaction of lithium ions has been reported to occur on the surface of MWCNTs, as well as the inner surfaces (including in between the walls and into the hollow inner channel) [20]. This phenomenon has allowed for MWCNTs to achieve much higher capacities than graphite [14]. The MWCNTs properties have a very large impact upon their electrochemical performance, and thus can be tailored towards requirements. For example, larger numbers of defects and shorter lengths can provide higher capacities and improve rate performance, due to better ion diffusion as the travel distance is reduced [21].
In addition to the work carried on LIBs, studies on the application of MWCNTs for NIBs are emerging. These mainly focus on the use as a conductive additive, improving the electrochemical performance of HC anodes through better electronic conductivity and nanostructure for example [22, 23]. Moreover, a small number of studies have evaluated the use of MWCNTs as the active electrode material. Luo et al showed reversible capacities of 82 mAh g−1 at 30 mA g−1 using NaClO4 in ethylene carbonate and diethyl carbonate (EC:DEC) electrolyte [24]. The use of alternative electrolytes, such as NaPF6 in diethylene glycol dimethyl ether (DGM), has shown improved capacities of 130 mAh g−1 at 100 mA g−1 [18]. Moreover, chemically modified MWCNTs by partially 'unzipping' the external layers using a modified Hummer's method showed extremely high capacities of 510 mAh g−1 at 20 mA g−1—higher than any HC currently reported [25]. These works all used organic slurries with various ratios of MWCNTs and other conductive carbon materials. Despite an increased interest of MWCNTs for NIBs, the reaction mechanism and microstructural changes that MWCNTs undergo upon sodiation are unclear. Furthermore, the effects of electrode formulations and electrolyte solvent, especially ether-based that have recently shown enhancements in initial Coulombic efficiency (ICE) for various carbon materials, has not been clearly assessed [26, 27].
In this work, we report the preparation of MWCNT electrodes through ball milling to achieve high quality and reproducible organic and aqueous slurries using polyvinylidene fluoride (PVDF) and carboxymethyl cellulose (CMC) binders, respectively, without addition of any other conductive carbon additives and large amounts of solvent. The two electrode types were analyzed electrochemically through galvanostatic cycling and cyclic voltammetry (CV) to determine the influence of electrode formulation and electrolyte solvent (carbonate- or ether-based) on performance in sodium half-cells. Additionally, the reaction mechanism of MWCNTs with sodium, and its dependence upon electrolyte choice, was sought by studying ex-situ samples through a range of complementary techniques including powder x-ray diffraction (PXRD), scanning electron microscopy (SEM), transmission electron microscopy (TEM) and Raman analysis.
2. Experimental section
2.1. Materials
Commercial MWCNTs (Sigma-Aldrich) were used for this study (purity in carbon basis ⩾ 98 wt.%). The average dimensions provided by the supplier are 10 ± 1 nm outer diameter (OD), 4.5 ± 0.5 nm inner diameter (ID) and ∼3–6 µm length. Before use, MWCNTs were dried overnight under vacuum.
2.2. Electrode preparation
A Fritsch Pulverisette seven planetary ball mill was used to combine MWCNTs with PVDF binder (Solvay SOLEF 5130) and n-methyl-2-pyrrolidone (NMP) (Sigma-Aldrich) for an organic slurry, or sodium CMC binder (Sigma-Aldrich) and water for an aqueous slurry. Aqueous cast electrodes were targeted to demonstrate a more environmentally friendly processing technique [12]. The mixing was carried out at 400 rpm for a total of 160 min with a 20 min pause to allow for cooling. A small additional volume of solvent was added after ball milling to obtain a castable slurry. With this technique, slurries up to 90 wt.% active material were produced, but all electrochemical testing presented in this work used a ratio of 85 wt.% MWCNTs to 15 wt.% binder. The slurries were cast on aluminum foil using a doctor blade with a 600 µm casting gap.
2.3. Electrochemical characterization
All cell construction was carried out in an argon-filled glovebox at <0.1 ppm O2 and H2O. Half-cells were constructed using 13 mm electrodes, which were dried under vacuum overnight at 80 °C or 110 °C for organic and aqueous electrodes, respectively. Sodium metal (Sigma-Aldrich) was used as a counter electrode, with a glass fiber separator (Whatman GF/F) soaked in either a commercial carbonate (1 M NaPF6 in EC:DEC, Kishida Chemical Co.), or homemade diglyme-based electrolyte (1 M NaPF6 synthesized by a newly published technique [28] in bis(2-methoxyethyl) ether (Sigma-Aldrich)). All electrochemical analyses were carried out using a Biologic BCS-805 battery cycler with cells held at 30 °C. Galvanostatic cycling was typically performed in a potential window of 0.01–2.5 V at 25 mA g−1 and CV at a sweep rate of 0.2–1 mV s−1.
For ex-situ transmission electron microscopy (TEM), Raman spectroscopy and PXRD measurements, two-electrode Swagelok cells were prepared using 10 mg of the dried commercial MWCNTs as the working electrode and a small amount of sodium as the counter electrode, using either the EC:DEC or DGM electrolyte. These cells were discharged to 0.01 V or cycled to 2.5 V at 10 mA g−1. The MWCNTs were recovered from the Swagelok cells inside an argon glovebox and a fraction was washed three times with 3 ml portions of dimethyl carbonate (DMC, Sigma-Aldrich) or DGM to remove excess electrolyte. The dispersions were centrifuged at 5000 rpm for 2 min between each washing step, and then dried under vacuum overnight.
2.4. Materials characterization
The Brunauer–Emmett–Teller surface area of the MWCNTs was measured with a Micromeritics ASAP2020 analyzer at −196 °C [29]. Prior to measurement, the samples were degassed at 120 °C for 3 h. The total pore volume (Vt) was estimated at a relative pressure (p/p0) of ∼0.99, the micropore volume (Vmicro) was calculated from the Dubinin-Raduskevich equation applied to the nitrogen adsorption isotherm and the mesopore volume (Vmeso) was then determined by difference. The mesopore size distribution was calculated using the Barrett–Joyner–Halenda (BJH) method with the Kruk-Jaroniec-Sayari (KJS) correction on the nitrogen desorption branch [30]. Non-local density functional theory (NLDFT) for a slit/cylindrical pore shape model was applied to the adsorption isotherm to also analyze the micropore size distribution [31].
Ex-situ PXRD of the washed MWCNTs recovered from the Swagelok cells were collected on a STOE STADI P powder diffractometer operating in Debye-Scherrer mode, using molybdenum radiation (Mo Kα1: 0.7093 Å) and a single position-sensitive Mythen linear detector. Samples were loaded into 0.5 mm capillaries inside an argon glovebox and flame sealed, and analyzed in the 2θ region of 6–21° for 14 h, with a step size of 0.375° and step time of 1200 s. The patterns suffered from a large contribution due to the background signal of the capillary, leading to increased broadening of the (002) carbon reflection. To correct for this, the blank capillary was run beforehand, which was then subtracted from the patterns. Patterns were corrected from Mo to Cu 2θ values using the formula,

Micrographs of the washed MWCNTs recovered from the Swagelok cells were obtained using a JEOL JSM-IT800 microscope. A suspension was prepared in the corresponding electrolyte solvent by mixing in a pestle and mortar inside the glovebox, and then drop-casted onto silicon substrates. These samples were installed in a transfer vessel sealed in the glovebox before being transferred into the microscope, avoiding exposure to ambient atmosphere.
TEM, high-resolution TEM (HRTEM) and high-angle annular dark-field STEM micrographs, together with energy-dispersive x-ray spectroscopy (EDS) were collected using an FEI Titan Themis 200 STEM to understand the morphology of the MWCNTs and their changes during electrochemical evaluation. The commercial MWCNTs were dispersed in ethanol (FisherBrand) by ultrasonication (40% amplitude, 0.4 cycle, 10 min) using a Hielscher UP200S ultrasonic processor and drop-casted on a carbon-coated copper grid (Agar Scientific). Ex-situ TEM analysis of the MWCNTs tested in Swagelok cells were conducted using rinsed samples, as excess electrolyte hindered solid electrolyte interphase (SEI) identification. Samples were prepared as for ex-situ SEM analysis and transferred in sealed vials to minimize air exposure. Plasma cleaning before analysis was carried out for 150 s with 18 cm3 min−1 of Ar at 25% power (25 W) using a Henniker HPT-100.
Ex-situ Raman measurements of the MWCNTs tested in Swagelok cells were collected using a Renishaw inVia Qontor confocal Raman microscope with a 532 nm wavelength laser, 1800 l mm−1 grating and a 50x long working distance objective. Unlike the ex-situ PXRD, SEM and TEM analysis, the samples were not rinsed as it has been reported that several parameters, such as the G and D peak positions, can be affected [32]. An airtight optical Raman test cell (ECC-Opto-Std, EL-CELL) with a glass window was used for the analysis. For comparison purposes, the pristine MWCNTs were also measured inside the optical test cell. Laser power was kept to 1% (< 1 mW on the sample) to avoid excessive heating which can degrade the sample or cause fluorescence from the residual electrolyte. At least ten locations were analyzed to ensure the spectra were representative. Due to the difficulty in focusing through the glass window, the laser was refocused manually for each spot. Wire 5.5 (Renishaw) was used to process the spectra collected. Peak assignment was carried out in the averaged measurement for each sample and the peaks were deconvoluted using Lorentzian functions (D and G) or combined Lorentzian and Gaussian functions. The background was taken as a straight line during the deconvolution procedure [33].
3. Results and discussion
3.1. Multiwall carbon nanotube characterization
The commercial MWCNTs, with an average length/diameter aspect ratio of 450, have a mixed morphology of straight and twisted shapes entangled together to form bundles (figure 1(a)). Well-ordered graphene layers are observed, with some structural defects along the sidewalls (figure 1(b)). The kinked and curved regions are indicative of the defective nature of the MWCNTs, which could provide active sites for sodium storage. The TEM studies also reveal a mix of open- and closed-ends, the presence of partitioned MWCNTs (walls are bridging from one side of the inner channel to the other) and a small residual amount of metal nanoparticles from the synthesis within the inner channel. The interlayer spacing calculated from fast Fourier transform is 0.358 ± 0.028 nm (2 standard deviations for a 95% confidence interval for all measurements), which falls within the interlayer range of 0.34–0.39 nm reported for these materials. Increasing d-spacing has been observed with decreasing inner tube diameter for values lower than 10 nm and is attributed to the high curvature that results in increased repulsive forces of the graphene basal planes between concentric tubes [34].
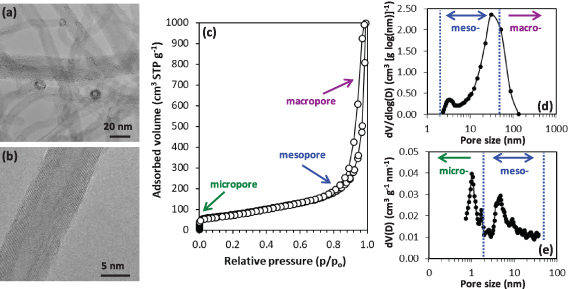
Figure 1. Morphological and textural characterization of the pristine MWCNTs: (a) and (b) HRTEM micrographs, (c) nitrogen adsorption-desorption isotherms and corresponding pore size distribution obtained from applying the (d) BJH-KJS model to the desorption isotherm and (e) NLDFT for a slit/cylindrical pore shape model to the adsorption isotherm.
Download figure:
Standard image High-resolution imageSince the surface area is one major property influencing the electrochemical performance of carbon anodes depending upon the electrolyte solvent used [35], nitrogen adsorption-desorption analysis was carried out (figure 1(c)). A type IV isotherm was observed, characteristic of a mesoporous material, with a surface area of 270 m2 g−1. A total pore volume of 1.55 cm3 g−1 was measured, which can be beneficial for the diffusion of sodium ions [23], and comprises 1.44 cm3 g−1 mesopores and 0.11 cm3 g−1 micropores. The pore size distribution calculated by BJH-KJS in the mesopore range (figure 1(d)) shows two maxima at ∼3.3 and 31 nm, which may correlate to the ID of the MWCNTs and the intertube distance, respectively, and is coherent with the TEM measurements. Mesopores play a vital function to accommodate sodium, as demonstrated by recent operando Raman studies of HCs [32]. The micropore size distribution calculated by NLDFT shows two maxima at around 1 and 1.7 nm, and mesopores centered at ∼4.7 nm. Smaller pore sizes using the BJH method compared to NLDFT method or electron microscopy measurements have been previously reported [36].
A tap density value of 0.068 g cm−3 was measured, which is low when comparing to other carbon materials. This property strongly affects slurry manufacturing and the resultant mass loadings. Typically, MWCNT slurries use PVDF and NMP, however, their high surface area requires extremely large solvent volumes, leading to very low solids loadings. Instead, ball milling was utilized to create aqueous and organic slurries without the addition of any conductive carbon additives. This is a more industrially relevant production technique and showed no major effects on the MWCNTs properties. Reproducible and homogeneous casts were achieved, with electrode active mass loadings of approximately 1 mg cm−2.
3.2. Electrochemical analysis of MWCNT electrodes
Sodium half-cells with aqueous cast electrodes were initially cycled at 25 mA g−1 in three working potential windows using 1 M NaPF6 in EC:DEC to gauge performance. The 0.01–2.5 V window exhibited the lowest capacity fade across 50 cycles and, therefore, it was used for all further electrochemical testing (figure S1). Coulombic efficiencies of all three windows required around 25 cycles to reach values >95%, which indicates some parasitic reactions occurring during charging.
The potential profiles of cycles 1, 10 and 25 for the aqueous and organic electrodes in the optimized potential window at 25 mA g−1 are shown in figures 2(a) and (b), respectively. During the initial discharge of both electrode types, the cell potential drops sharply, with only a small amount of capacity obtained in this region, before reaching a large plateau at ∼0.7 V, which is likely due to the decomposition of the electrolyte upon the MWCNTs surface to form a SEI [37]. The extent of this plateau is also closely linked to the surface area, and for example shorter MWCNTs have shown shorter plateau [38]. Here, the plateau length changes depending on the binder utilized, and is approximately three times shorter for the aqueous than for the organic electrode (∼300 mAh g−1 vs. ∼1100 mAh g−1, respectively). This may be due to the electrode morphology, as demonstrated by one study on drying kinetics of PVDF and CMC-containing electrodes, which found PVDF electrodes were more prone to cracking and aggregation at the electrode surface, exposing interfacial areas to greater amounts of side reactions, particularly SEI formation [39]. Subsequently, the discharge profile of both electrode types tends towards the 0.01 V cut-off, with this region contributing around 250 mAh g−1 of total capacity (∼700 mAh g−1 vs. ∼1500 mAh g−1 for the aqueous processed and organic processed electrode, respectively). Upon charge, both electrode types exhibit similar sloping profiles tending towards 2.5 V, with much of the initial discharge capacity irreversible, and thus low ICE of 15 and 10% for the aqueous and organic electrodes are observed, respectively. Low ICEs are normally related to the excessive SEI formation caused by relatively high surface areas and porosity [25, 40], and the presence of carboxyl functional groups when using CMC binder could enable the formation of a better passivating surface than with PVDF, as recently reported in an study with nitrogen-doped MWCNTs [41]. In further cycles, the plateau at ∼0.7 V is no longer observed which indicates no further SEI formation occurs. Over 25 cycles, the aqueous processed electrode reversible capacity fades from ∼140 mAh g−1 to ∼60 mAh g−1, with most of the losses occurring within the first 10 cycles. The organic electrode exhibits much more stable performance, with the reversible capacity fading from ∼150 mAh g−1 to ∼120 mAh g−1 after 25 cycles.
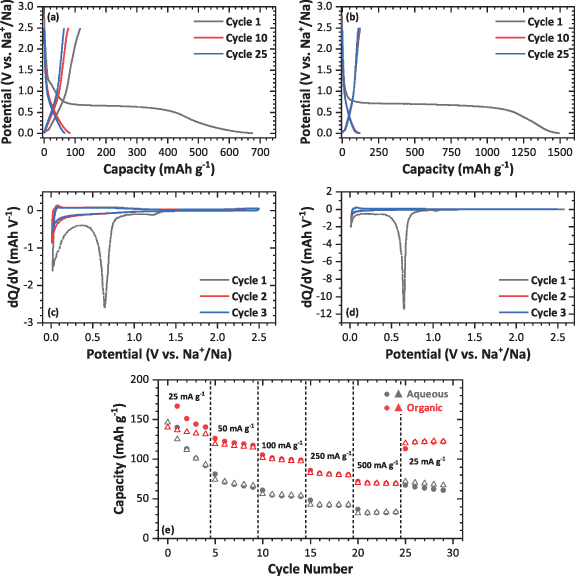
Figure 2. Electrochemical performance of MWCNTs electrodes in sodium half-cells using 1 M NaPF6 in EC:DEC electrolyte in a potential window of 2.5–0.01 V. Galvanostatic discharge-charge profile at 25 mA g−1 and dQ/dV plots for the (a) and (c) aqueous processed and (b) and (d) organic processed electrodes, and (e) rate performance analysis comparing the organic processed and aqueous processed electrodes at various current densities. Closed symbols indicate the discharge capacity, whilst open indicate the charge capacity.
Download figure:
Standard image High-resolution imageThe dQ/dV plots of the first three cycles for each of the electrode types (figures 2(c) and (d)) reveal more about the electrochemical processes occurring. Reduction processes are observed at ∼1.2, 0.7 V and 0.05 V during the initial discharge in both cases. Two processes in the ∼1.2 V region are observed for the organic electrode, whilst only one is seen for the aqueous electrode (figure S2). These can be attributed to the irreversible reaction of the electrolyte with functional groups on the surface [25]. In LIBs, an irreversible process in the first cycle CVs around 1.25 V (vs. Li+/Li) has also been related to ion insertion into the inner channels for MWCNT anodes [42]. Since the TEM analysis of the MWCNTs used in this study show many open ends (figure 1(a)), this process should be also considered. The sharp process at ∼0.7 V corresponds to the SEI formation across the MWCNT surface, as discussed previously. If insertion of sodium into the graphitic layers followed a similar mechanism to graphite to form graphite intercalation compounds (GICs), this is typically seen at around 0.6 V, but would also be accompanied by volume expansion and measurable changes in interlayer spacing [43]. Finally, the broad reduction process at around 0.05 V is difficult to assign, since the reaction mechanism of sodium with carbon is still poorly understood, with many models hotly debated and dependent on type of carbon [44]. Bearing in mind that most information available in NIBs relates to HCs, adsorption of sodium ions at edge or basal defects or insertion into enlarged interlayer spaces, in this case in between walls, could be occurring in this region [45]. Moreover, this is the only reversible peak upon cycling for both electrode types, with its corresponding oxidation peak at around 0.2 V. This peak retains its intensity for the organic electrode during latter cycles, whereas it fades for the aqueous electrode (figure S2), indicating that the process becomes less reversible, and contributes to the gradual capacity fade. It is also noted that a small, broad process which fades across the first three cycles is observed for the aqueous processed electrode upon oxidation at ∼0.7 V. It is unclear what exactly this region is related to as there may be several reactions occurring across this voltage range but does contribute to the continued capacity fade during cycling.
Rate performance for each of the MWCNT electrode types is plotted in figure 2(e). At all current densities, the organic electrode outperforms the aqueous electrode. At 500 mA g−1, organic electrodes retain 100% more capacity than the aqueous, with a maximum of 71 mAh g−1 vs. 31 mAh g−1, respectively. When returning to 25 mA g−1, discharge capacities recover to prior values of 67 and 120 mAh g−1, respectively. However, the organic processed electrode capacity remains stable, whilst the aqueous processed electrode continued to fade. One possible reasoning behind this improved performance for the organic processed electrode is a better developed porosity within the electrode and interactions between MWCNTs when using PVDF than CMC, since an improved connectivity of porosity in HCs has been shown to facilitate fast diffusion of sodium ions at high current densities, leading to improved rate performance [46].
Improvements to the electrochemistry were sought by changing the electrolyte solvent. Recent studies show that carbonate-based electrolytes may not be the most suitable for carbon anodes due to low ICE's related to SEI formation, and can also lead to large excesses of electrolyte needed as it is consumed during initial formation cycles [47]. Glymes, and more specifically diglyme, can solvate sodium ions and allow formation of sodium-GICs [48]. Performance improvements have been reported not only for graphite but also for other carbon materials, such as HCs and carbon nanofibers [49, 50].
The potential profiles in figures 3(a) and (b) when using 1 M NaPF6 in DGM are in stark contrast to the EC:DEC electrolyte. A cycling profile similar to graphite, which has been explored extensively, or to those using EC:DEC was expected [51]. However, a profile more resemblant of a HC is observed, with three distinct sloping regions throughout the initial discharge. ICE's increased to ∼59% for both electrode types, attributed to the loss of the plateau at 0.7 V, and coulombic efficiencies >99% were achieved after around 3 cycles. The organic electrode obtained a slightly larger discharge capacity, approaching ∼300 mAh g−1 in the first cycle, decreasing to ∼150 mAh g−1 after 25 cycles. In contrast, the aqueous processed electrode first discharge capacity is ∼250 mAh g−1, stabilizing at ∼100 mAh g−1 after 25 cycles. The different electrochemical performance may again be linked to the porosity of the electrodes, and the interactions between binder and MWCNTs, as the behaviors seem reproducible between the electrode types, regardless of the electrolyte used. Upon further cycling, the main contributions to reversible capacity are purely from the sloping regions of the profiles above ∼0.2 V since the plateau at low potentials is considerably shorter after the first cycle, which is ascribed to 'pore filling' for HCs [52]. The mesoporosity around ∼30 nm observed from N2 adsorption-desorption isotherms and ascribed to intertube distances could be suitable regions for this process to occur, however its irreversibility after cycling requires further mechanistic studies. Above this potential, it is more likely that most of the obtained capacity is due to defect site and edge adsorption of sodium, as well as a possible contribution from insertion of sodium into the MWCNT layers [12].
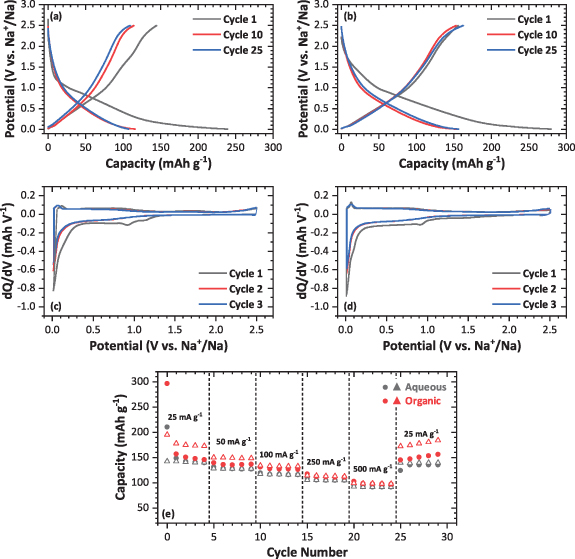
Figure 3. Electrochemical performance of MWCNTs electrodes in sodium half-cells using 1 M NaPF6 in DGM electrolyte in a potential window of 2.5–0.01 V. Galvanostatic discharge-charge profile at 25 mA g−1 and dQ/dV plots for the (a) and (c) aqueous processed and (b) and (d) organic processed electrodes and (e) rate performance analysis comparing the organic processed and aqueous processed electrodes at various current densities. Closed symbols indicate the discharge capacity, whilst open indicate the charge capacity.
Download figure:
Standard image High-resolution imageThe slight differences in the potential profiles of both electrode types give rise to similar dQ/dV plots in the DGM electrolyte (figures 3(c) and (d)). During the initial discharge, reduction processes at ∼1.2, 0.9 and 0.05 V are observed, with a noticeable absence of the large SEI formation process at 0.7 V seen in the EC:DEC electrolyte. The electrochemical studies on carbon anodes with glyme-based electrolytes disagree about whether SEI formation occurs. Some studies note the presence of a reduction process around 0.5 V and assign this to SEI formation [26, 53]. However, for the MWCNTs used in this study, as well as some other carbonaceous materials such as sodiated graphite, the use of DGM does not give rise to a significant peak around that potential [54]. Whether this indicates no formation of an SEI, or formation on an extremely small scale will be discussed in later sections based on ex-situ characterization studies. The aqueous electrode exhibits two small peaks at 1.2 and 0.9 V during the first cycle, whilst the organic electrode only exhibits the one at 0.9 V and can be assigned to the irreversible mechanisms described in the previous section. Upon cycling, the dQ/dV plots are reproducible against one another, indicating reversibility across the whole potential range. The reduction process at ∼0.05 V, which shows a corresponding oxidation peak at 0.1 V, shows no fade after the first cycle regardless of the electrode type, indicating a better reversibility in the DGM electrolyte. However, this peak does not seem to contribute a considerable amount to the total capacity. Therefore, it should be assumed that the broad region from 1 to 0.4 V throughout the dQ/dV is where the majority of reversible capacity is obtained, unlike for the EC:DEC electrolyte where no reversible processes were observed in this voltage region.
The rate performance when using the DGM electrolyte was improved considerably for both electrode types (figure 3(e)) comparing to the EC:DEC electrolyte (figure 2(e)) at all current densities. At 500 mA g−1, a capacity of around 100 mAh g−1 is observed for both the aqueous and organic electrodes, around two-thirds of the initial capacity at 25 mA g−1. Additionally, the capacity recovery after the final current is much improved, with both electrodes returning to their initial values—and the organic electrode capacity increasing further after five further cycles. The observed improvement in rate performance is likely due to two reasons—better sodium transport and better reversibility of reaction processes due to changing the electrolyte solvent. Moreover, the electrode composition does not largely affect the rate performance when using the DGM electrolyte. However, the organic electrode coulombic efficiency increases with higher application of current and decreases drastically upon returning to initial capacity at 25 mA g−1, indicating that there is a rate limited process occurring during charging.
The performance trends of these two electrode types in the two electrolytes also changes over 100 cycles (figure S3). Despite good initial performance of the organic electrode using EC:DEC, their capacities fade slightly faster than the aqueous electrode after 50 cycles, with both electrodes achieving around 50 mAh g−1 after 100 cycles. Furthermore, in DGM, longer term cycling is more stable for both electrodes, achieving around 100 mAh g−1 for the organic electrode, and in the case of the aqueous electrode, the achieved capacities improve to ∼150 mAh g−1, which will be discussed later in this work. These results agree with other works in literature. For example, improved cycling stability has been observed for SnO2 electrodes using CMC compared to PVDF due to improved adhesion of the electrode when large volume changes occur, and for nitrogen-doped MWCNTs using less electronegative binders than PVDF, such as sodium polyacrylate, lowering electrode resistance [41, 46]. Our insights further highlight the importance of the slurry formulation and its impact on the performance.
To understand these electrochemical differences between the two electrolytes, and especially the kinetic behavior, CV was undertaken using scan rates from 0.2 to 1 mV s−1. Similar shapes of the CV plots were observed for all cases (figures 4(a)–(d)), though organic electrodes better retained the anodic peak at low potentials. As scan rate is increased, all four CVs exhibit broadening, especially from the anodic contributions. As current obeys the power law,

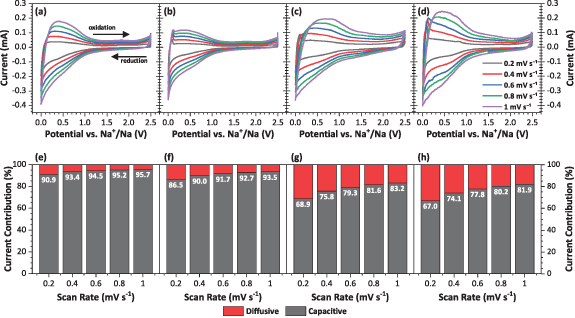
Figure 4. Cyclic voltammograms of MWCNTs electrodes in sodium half-cells and the calculated diffusion controlled (red) and surface capacitive contributions (grey) to total current as a function of scan rate for the (a), (e) aqueous and (b), (f) organic processed electrodes using 1 M NaPF6 in EC:DEC, and (c), (g) aqueous and (d), (h) organic processed electrodes using 1 M NaPF6 in DGM.
Download figure:
Standard image High-resolution imageA log/log plot of the scan rate (ν) vs. current (i) can be plotted for each CV to obtain the slope. This value, b, varies from 0.5, indicating a diffusion-controlled reaction (i.e. faradic) to 1, which indicates a purely capacitive reaction [55]. The EC:DEC electrolyte favors a capacitive mechanism, with b values approaching 1, whereas for the DGM electrolyte the b values are calculated between 0.7–0.8, depending upon the electrode formulation (figure S4). This behavior agrees with other studies using DGM, especially those with HCs, which afford slightly higher diffusive contributions than a carbonate electrolyte [25]. Utilizing the CV data further, it is possible to calculate the current response of data at fixed potentials using Dunn's method [56],

where k1 ν½ and k2 relate to either surface capacitive effects or a diffusion-controlled insertion process, respectively. By plotting current divided by square root scan rate (i/v1/2) as a function of square root scan rate (v1/2), k1 and k2 are obtained from the slope and intercept values, respectively. The percentage contributions of each process at each scan rate show higher diffusion-control in the DGM electrolyte than when using the EC:DEC electrolyte, regardless of the electrode formulation (figures 4(e)–(h)). At a scan rate of 0.2 mV s−1, this is around 33/31% for the DGM electrolyte compared to 14/9% for the EC:DEC electrolyte, depending on the electrode type (aqueous/organic). Partially expanded MWCNTs for NIBs were shown to have improved diffusive contributions, with the pristine MWCNT counterparts showing similar behavior to our observations for the MWCNTs in EC:DEC [25]. In our study, switching the electrolyte to DGM offers more diffusion and less capacitive contribution, without any prior modification of the MWCNTs. A point of consideration for future analysis is how despite an increase in diffusive behavior when using the DGM electrode, the rate capability of the material is improved—as capacitive mechanisms are much faster processes and dominate at higher rates. As scan rate is increased towards 1 mV s−1, less contribution from the diffusive processes is observed, which shows definite kinetic limitations to the reaction of sodium with MWCNTs. This behavior is common to porous carbon materials which exhibit pseudocapacitive behavior at higher current densities, and despite the mechanistic changes can achieve long-term cyclability and high rates [57].
3.3. Ex-situ characterization of electrochemically sodiated/desodiated MWCNTs
To obtain a more fundamental understanding of how MWCNTs react with sodium and understand the capacities achieved, several techniques were applied to the MWCNTs discharged to 0.01 V and cycled to 2.5 V in the EC:DEC or DGM electrolytes using Swagelok cells, in absence of binder. PXRD was initially chosen to determine if any reversible crystallographic changes could be observed during the cycling. Figure 5 compares PXRD patterns of the first discharge and cycled MWCNTs in the two electrolytes with the pristine material. The single well-defined (002) reflection situated around 2θ = 25.5°, for the pristine MWCNTs shows slight broadening, indicating partial disorder of the MWCNTs. Using the (002) peak position, the d-spacing prior to electrochemical reaction can be calculated as ∼0.345 nm, smaller than when calculated by HRTEM (0.358 ± 0.014 nm), which can be due to TEM calibration inaccuracies and smaller number of 'total' measurements compared to PXRD. The (100) and (101) reflections around 2θ = 41° relate to the in-plane graphitic structure, and are not particularly well-defined, which is indicative of misalignment between the graphene layers. The FWHM of (100) and peak intensity of (101) are also dependent on the MWCNTs diameter, which could contribute to this poor definition [58]. The ex-situ PXRD patterns of the MWCNTs recovered from the Swagelok cells in the EC:DEC exhibit similar reflections after both discharge and cycling (figure 5(a)). No shift to lower 2θ is observed for the (002) reflection, indicating no increase in d-spacing which would be expected if sodium intercalation occurs [58, 59]. The broadening of the (002) reflection is difficult to assess, as there may be contribution from the borosilicate glass fiber separator used in the Swagelok cells (reflections marked with *), which was difficult to remove due to the long cycling time. The PXRD pattern after cycling is identical to the discharged sample, indicating that any changes are irreversible.
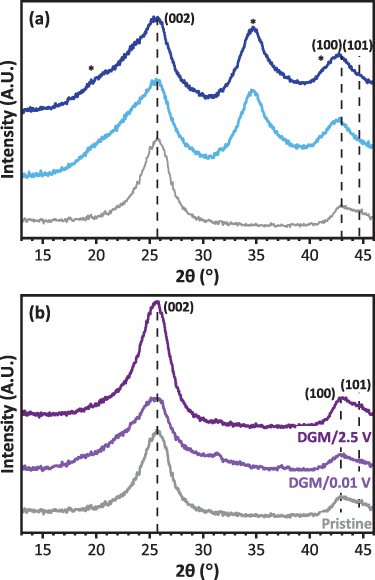
Figure 5. PXRD patterns of the MWCNTs after the first discharge and charge cycles in Swagelok sodium half-cells using 1 M NaPF6 in (a) EC:DEC and (b) DGM electrolyte compared against the pristine MWCNTs.
Download figure:
Standard image High-resolution imageFor the DGM discharged MWCNTs (figure 5(b)), decreased intensities and shifting to lower 2θ are observed for all reflections upon discharge, and a d-spacing of 0.348 nm for the was calculated from the (002) peak position. The small d-spacing increase upon discharge compared to the pristine MWCNTs (∼0.345 nm) could indicate insertion of sodium within the walls of the MWCNTs, as observed for lithium MWCNT cells [60]. Broadening of the (002) reflection and greater asymmetry indicates different crystalline species, for example due to different relative orientations of successive layers of MWCNTs, thus it could be possible that electrochemical reaction has led to MWCNTs with different degrees of disorder [59, 61]. These observations can be corroborated by the findings of a recent in-situ TEM experiment to sodiate a MWCNT through direct contact with sodium metal, exhibiting an expansion of the lattice, as well as width changes caused by amorphization of the MWCNTs. As the reflection intensities and positions are restored on charging (d(002) ∼ 0.346 nm), the process is reversible and agrees with other carbonaceous materials using DGM which indicate that sodium-ions can reversibly co-intercalate with solvent molecules to form layered intercalation compounds, increasing the d-spacing [6]. Moreover, in the DGM discharge pattern collected below 2θ = 13° a very small broadened reflection was detected at around 2θ = 10° (figure S5), which is lost upon charge. This may corroborate the presence of a (001) reflection, which is characteristic of graphene oxide and could relate to the changes in morphology of the MWCNTs during charge and discharge that will be discussed in more depth in the TEM analysis discussion.
SEM micrographs of the discharged and cycled samples exhibit a less defined morphology of individual MWCNTs for the EC:DEC (figures S6(a) and (b)) than DGM electrolyte (figures S6(c) and (d)), which could indicate a layer covering the MWCNTs surface. Further analyses by TEM (figure 6) were necessary to distinguish what was occurring at the nanoscale. Figure 6(a) clearly shows the formation of a thin layer on the MWCNTs surface after discharge in the EC:DEC electrolyte, which is not present in the pristine MWCNTs (figure 1(b)). This is likely the SEI layer, which appears mostly continuous, with a calculated average thickness of 1.3 ± 0.8 nm. Low beam currents were used, as the layer was beam sensitive and precluded accurate EDS quantification. Most of the work carried out in sodiated HCs agree on the formation of a thick SEI layer when using NaPF6 in EC:DEC, in agreement with our ex-situ TEM analysis. A mixed inorganic-organic composition is normally observed with a greater contribution of the organic species, and consisting of but not limited to, Na2CO3, NaF, and decomposed carbonate species, such as sodium double alkyl carbonate from EC decomposition [13, 62]. When charging to 2.5 V, the layer on the MWCNTs surface is still observed, with a comparable average thickness of 1.6 ± 1.2 nm (figure 6(b)), indicating the stability of the SEI formed. The interlayer spacing of the MWCNTs after discharge to 0.01 V was measured as 0.349 ± 0.022 nm and after charge to 2.5 V was 0.353 ± 0.027 nm, within error of one another and of the commercial MWCNTs, which would indicate no insertion of sodium in between walls.
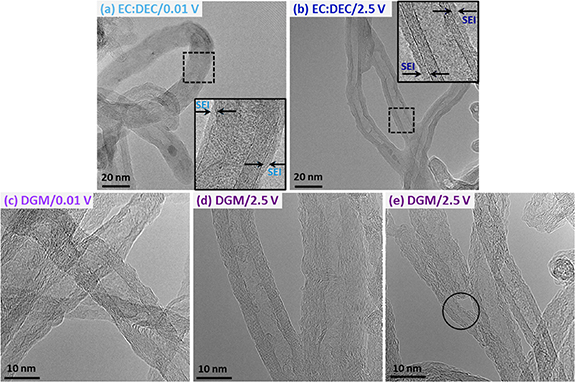
Figure 6. HRTEM micrographs of the MWCNTs after the first discharge and charge cycles in Swagelok sodium half-cells. (a) Discharged to 0.01 V and (b) charged to 2.5 V using 1 M NaPF6 in EC:DEC, and (c) discharged to 0.01 V and (d) and (e) charged to 2.5 V using 1 M NaPF6 in DGM.
Download figure:
Standard image High-resolution imageWith the DGM electrolyte, there is no clear evidence of SEI formation after the first discharge to 0.01 V (figure 6(c)) nor after charging to 2.5 V (figures 6(d) and (e)). The investigations on the SEI formed when using NaPF6 in DGM are not as conclusive as when using EC:DEC and are highly dependent on the carbon material analyzed. For example, Goktas et al proposed no SEI formation on graphite, as well as Pan et al for a HC [43, 50]. However, other works report evidence of a thin, inorganic-rich (most commonly containing NaF) and more conductive SEI layer in HCs, which is considered as the main reason for improved cycling stability [13, 27]. This has been proven to also enable highly reversible and non-dendritic plating of sodium metal anodes, which would benefit half-cell performance [63]. Therefore, our ex-situ TEM analysis and electrochemical characterization (dQ/dV) seem to indicate that either no SEI is formed, or if an SEI is formed we should consider it is extremely thin and difficult to observe, or susceptible to removal during sample rinsing or beam exposure [53, 64]. Further analysis after long-term cycling would provide greater insight into SEI formation, as it may gradually continue to form across many cycles, although there is no clear electrochemical evidence of this occurring. In any case, these differences compared to EC:DEC can explain the higher ICEs reported in figure 3. The interlayer spacing measured after discharge to 0.01 V was 0.372 ± 0.056 nm, larger than the pristine MWCNTs, whereas after charge to 2.5 V decreases back to 0.358 ± 0.034 nm. This is consistent with the reversible d-spacing changes observed for the ex-situ PXRD analysis, possibly indicating sodium insertion between the walls of the MWCNTs.
It is worth noting that large distortions, wrinkling and even cracking of the graphene layers are observed for the discharged MWCNTs in DGM (figure 6(c)). Some of these changes appear to be partially reversible after charging to 2.5 V, as the MWCNTs exhibit a morphology close to the pristine sample (figure 6(d)). These changes during the first cycle are also clearly visible when comparing low magnification TEM micrographs against the pristine MWCNTs, which show how extensive this process is (figure S7). Recent studies reported similar findings during in-situ TEM studies for lithium insertion into graphite, and ex-situ TEM studies for sodium insertion into carbon nanofibers [49, 51]. However, when the graphene layers are cracked, the process does not exhibit reversibility, as highlighted in figure 6(e). In-situ sodiation of a MWCNT has also shown how constant intercalation of sodium into graphitic planes can lead to embrittlement of MWCNTs, and hence could cause this fracturing to become more widespread through continuous cycling [61]. Despite this deterioration in morphology, no detrimental effects to electrochemical performance were observed, as demonstrated by similar capacity retention after 25 cycles, as well as relatively good longer-term cycling of the electrodes carried out over 100 cycles. The exfoliation of the MWCNTs could explain how for example the aqueous electrode using DGM electrolyte slowly improves in capacity across the 100 cycles (and also observed after rate capability testing with the organic electrode), as the MWCNTs begin to provide more defect sites and surface for the sodium-ions to react, increasing observed capacities (figure S3).
Figure 7(a) shows the EDS line profile across a MWCNT after being discharged to 0.01 V in the DGM electrolyte. Only C, O and Na signals are clearly identified. Although the EDS map for sodium in figure 7(b) is noisy, the sum spectrum collected along the whole MWCNT confirms the presence of a small sodium amount (figure S8). Due to the identification of both Na and O within the region of the MWCNT studied, this could possibly confirm the presence of sodium as a solvated diglyme molecule, reported by Jensen et al, which showed these solvent separated-ion pairs have suitable ability to intercalate between graphite layers [65]. However, if considering whether sodium diglyme co-intercalation occurs between the walls of the MWCNTs, it should be noted that much larger d-spacing increases have been reported in literature for graphite than those observed here through TEM and PXRD [35, 54].
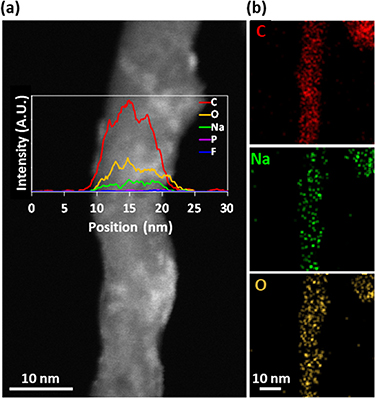
Figure 7. (a) HAADF-STEM micrograph and EDS line profile of a MWCNT discharged to 0.01 V in a Swagelok sodium half-cell using 1 M NaPF6 in DGM electrolyte. (b) The corresponding EDS maps acquired for the Kα peaks of C, Na and O in STEM mode.
Download figure:
Standard image High-resolution imageRaman spectroscopy is a very powerful technique to investigate the nature of carbon materials, however to the best of our knowledge no prior Raman studies related to sodiation of MWCNTs have been reported. Figure 8 shows a comparison of the first- and second-order Raman spectra collected for the MWCNTs recovered from the Swagelok cells in the EC:DEC and DGM electrolytes. The spectral baseline remains uncorrected, and a background slope is observed for all samples, including for the pristine MWCNTs. In this case, the slope may arise from the separator and glass window used in the optical Raman cell. In the spectra of the ex-situ samples, changes in the background slope can also be due to fluorescence from the unrinsed electrolyte and any SEI formed on the MWCNTs. A correlation between background slope in the D and G region and SEI formation has been recently reported by operando Raman studies during sodiation of HC [32]. However, further work in this regard, such as in-situ analysis, would be required to establish further conclusions for these materials. Fitting the spectra (figure S9) was complex due to the aforementioned high background, overlapping of bands from optical cell components with those related to carbon features, and asymmetry and broadening of other bands. Therefore, the Raman discussion below focuses on the most significant carbon bands (i.e. D, G and 2D (G')).
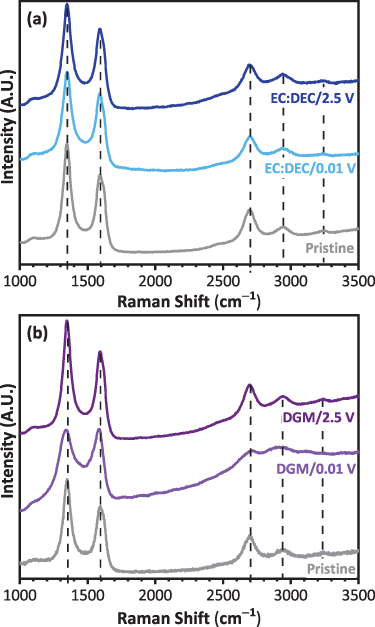
Figure 8. Raman spectra of the MWCNTs after the first discharge and charge cycles in Swagelok sodium half-cells using 1 M NaPF6 in (a) EC:DEC and (b) DGM electrolyte compared against the MWCNTs.
Download figure:
Standard image High-resolution image
For the pristine MWCNTs, the D band, attributed to the breathing mode of sp2 atoms in the rings at the edge planes and defects in the graphene layer, appears around 1348 cm−1, and the G band, related to the in-plane vibrations of sp2 bonded carbon atoms, at 1587 cm−1. The G band also shows a shoulder (D') around 1620 cm−1. Finally, the 2D (G') band, which is an overtone of D and relates to the three-dimensional stacking order of the graphene layers, appears at 2695 cm−1. The pristine MWCNTs present an intense D band compared to the G band, which has been observed for low diameter MWCNTs due to the large strain in the MWCNT walls that may lead to the breakdown of the lattice translational symmetry [58]. Therefore, the D to G peak intensity ratio was ∼1.6, indicative of a partially defective structure and coherent with TEM and PXRD analysis.
Firstly, no significant Raman shifts are observed for the, D, G, 2D bands for the discharged and cycled MWCNTs in EC:DEC compared to the pristine MWCNTs (figure 8(a)). However, the MWCNTs in the DGM electrolyte present much clearer and significant changes (figure 8(b)). After the first discharge, the D band shifts from ∼1348 cm−1 to 1338 cm−1. The shift to lower wavenumbers is accompanied by an intensity decrease and broadening that can relate to a decrease in C–C bond strength, indicating sodium interaction with defects. Additionally, this weakening of the C–C bonds was observed through poorer mechanical strength when sodiating a MWCNT during in-situ TEM, as the charge transfer and insertion of sodium into the graphitic layers was seen to decrease the tensile ability of the C–C within the MWCNTs [61]. Furthermore, a lower intensity of the D' band, which is known to originate from the end planes of graphene, can indicate the reaction with the defects in the edge plane (which are more chemically reactive than the basal plane) [66]. The fact that the D and D' bands do not increase indicates that defects are not being created, unlike the damage that has been observed during sodiation of graphite [54]. The G band also shifts from ∼1587 cm−1 to ∼1569 cm−1, accompanied by a small broadening, decrease in intensity and loss of symmetry. An upshift of the G band during discharge of graphite and MWCNTs in lithium-ion cells is correlated to the formation of intercalation compounds, which is explained by the modification in electron density through charge transfer [66, 67]. On the contrary, sodium/HC half-cells, showing a similar discharge profile to the MWCNTs in DGM, have displayed a downshift in G-band position. Weaving et al attributed this to electron doping resulting from sodium intercalation through the layers [32]. Anji Reddy et al further postulated that this downshift of the G band is indicative of the formation of sodium intercalation compounds, confirmed by DFT calculations for several different sodiated carbons (from NaC24 to NaC6) [68]. In our case, the shift to lower wavenumbers is smaller, possibly indicating that the intercalation of sodium is much more dilute. This is coherent with the small d-spacing changes detected by ex-situ TEM and PXRD analysis. The D to G intensity ratio upon discharge decreased to ∼1.3. The 2D band also shifted to a lower wavenumber of ∼2688 cm−1. A clear broadening upon discharge is also observed, as well as a decrease in intensity. The work by Chacón-Torres et al indicates that a downshift of the 2D (G') band relates to a lattice expansion of the graphene layers in other metal ion intercalation compounds [69]. The TEM data upon discharge indicates an extremely distorted structure of the graphene planes, which also strengthens the discussion that there is some form of intercalation occurring. Interestingly, all changes in terms of peak positions, widths and intensities are mostly reversible after charging to 2.5 V during the first cycle.
4. Conclusions
Two different formulations of MWCNT electrodes, and two different electrolytes were studied to analyze their effects on the electrochemical performance of MWCNTs for sodium-ion batteries. The EC:DEC electrolyte exhibits a very large first discharge capacity, related to the formation of an SEI layer upon the surface of MWCNTs and was confirmed by ex-situ TEM analysis. The reversible capacities of the two electrode formulation types are similar over long term cycling, though organic processed electrodes exhibit greater rate capability than aqueous processed electrodes. In comparison, when switching to DGM electrolyte, a greater ICE is observed in both electrode types (∼60%), attributed to the lower first cycle discharge capacity and lack of evidence of an SEI formed during the first cycle. Reversible capacities and rate capabilities are also much improved, achieving 100 mAh g−1 at a current density of 500 mA g−1–20% greater than organic electrodes using EC:DEC electrolyte. CV shows that the diffusive contribution to overall capacity is increased for the DGM electrolyte, indicating a difference in the reaction behavior of the electrolyte and MWCNTs. Ex-situ PXRD, TEM and Raman confirm that a reversible interaction with sodium occurs during the first electrochemical cycle in the DGM electrolyte, with contributions from several mechanisms such as defect site interaction and possibly partial intercalation of sodium into the MWCNTs, which seem to be assisted using the DGM electrolyte. Electrochemical testing over 100 cycles also reveals that when using DGM, the reversible capacities of the electrodes can increase, which may potentially be due to the effect of MWCNT exfoliation and cracking because of the sodiation occurring in the material. These results illustrate the rich and intriguing electrochemistry underpinning the sodiation mechanism of MWCNTs, especially when using alternative electrolytes. Further studies using the DGM electrolyte, such as in-situ Raman, PDF and x-ray photoelectron microscopy experiments could assist in determining the exact sodiation mechanisms and presence of SEI on the MWCNTs. Mechanical studies on electrodes would also help to understand the MWCNT fracturing seen using DGM and determining the impact of this process upon electrode morphology during long-term cycling.
Acknowledgments
Dr A Fuente Cuesta would like to thank Agency for Green Technology (AGT), Dr S A M Dickson would like to thank the Faraday Institution NEXGENNA Project (FIRG018), and C Lonsdale would like to thank the Faraday Institution FUSE Internship Programme for funding. The authors also acknowledge the EPSRC (Grant Codes EP/L017008/1, EP/T019298/1, and EP/R023751/1).
Data availability statement
The data that support the findings of this study are openly available at the following URL/DOI: https://doi.org/10.17630/83e3b83e-8927-4f60-8534-2c352bac88cc [70].
Supplementary data (1.5 MB DOCX)