


Abstract
Prussian white (PW, ![${\text{N}}{{\text{a}}_2}{\text{Fe}}\left[ {{\text{Fe}}{{\left( {{\text{CN}}} \right)}_6}} \right] \cdot {\text{z}}{{\text{H}}_2}{\text{O}}$](https://content.cld.iop.org/journals/2515-7655/4/4/044012/revision2/jpenergyac9808ieqn1.gif) ) is a promising cathode material for use in sodium-ion batteries for large-scale energy storage applications, which demand long cycling life-times. However, for non-aqueous battery applications PW must not contain any water, and yet dehydration induces a large volume change destabilizing the structure and reducing the cycling life. The material undergoes multiple phase transitions as a function of both the sodium and water content, however, the mechanism behind is poorly understood. Here, we use neutron diffraction to explore the influence of water on the structure of PW. For the first time, two structures for a single composition of PW were observed near room temperature independent of the synthesis method. These structures differ in the FeN6 and FeC6 octahedral tilting configurations, which is connected to the ordering of water in the framework. The removal of water modulates the magnitude of pre-existing structural distortions, if it is itself disordered within the structure, rather than modifying the nature of the distortions. These results provide a robust fundamental understanding of the chemical driving force impacting the nature and magnitude of structural distortions in Prussian blue analogues. The insights provide guidance for designing tilt-engineering ultimately enabling new materials with enhanced long-term electrochemical performance in battery applications.
) is a promising cathode material for use in sodium-ion batteries for large-scale energy storage applications, which demand long cycling life-times. However, for non-aqueous battery applications PW must not contain any water, and yet dehydration induces a large volume change destabilizing the structure and reducing the cycling life. The material undergoes multiple phase transitions as a function of both the sodium and water content, however, the mechanism behind is poorly understood. Here, we use neutron diffraction to explore the influence of water on the structure of PW. For the first time, two structures for a single composition of PW were observed near room temperature independent of the synthesis method. These structures differ in the FeN6 and FeC6 octahedral tilting configurations, which is connected to the ordering of water in the framework. The removal of water modulates the magnitude of pre-existing structural distortions, if it is itself disordered within the structure, rather than modifying the nature of the distortions. These results provide a robust fundamental understanding of the chemical driving force impacting the nature and magnitude of structural distortions in Prussian blue analogues. The insights provide guidance for designing tilt-engineering ultimately enabling new materials with enhanced long-term electrochemical performance in battery applications.
Export citation and abstract BibTeX RIS

Original content from this work may be used under the terms of the Creative Commons Attribution 4.0 license. Any further distribution of this work must maintain attribution to the author(s) and the title of the work, journal citation and DOI.
1. Introduction
Prussian blue analogues (PBAs), ![${{\text{A}}_X}{\text{M}}{[{\text{M}}\prime {({\text{CN}})_6}]_{1 - y}} \cdot {\text{zG}}$](https://content.cld.iop.org/journals/2515-7655/4/4/044012/revision2/jpenergyac9808ieqn2.gif) , are interesting cathode materials for use in sodium-ion batteries (SIBs) due to their low cost, environmental friendliness, and electrochemical performance [1–3]. The PBA crystal structure can be described as a double perovskite structure consisting of a porous framework with corner-sharing octahedrally coordinated transition metal centers (
, are interesting cathode materials for use in sodium-ion batteries (SIBs) due to their low cost, environmental friendliness, and electrochemical performance [1–3]. The PBA crystal structure can be described as a double perovskite structure consisting of a porous framework with corner-sharing octahedrally coordinated transition metal centers ( ) linked by cyanide groups (figure 1). The porous framework allows for the inclusion of alkali cations (
 ) or neutral guest species (
 ). Further, the compositional flexibility of the framework allows for [M'(CN)6]n
− vacancies (y). A promising cathode material is the Fe-based, [Fe(CN)6]4- vacancy-free and Na-rich PBA known as Prussian white (PW),
). Further, the compositional flexibility of the framework allows for [M'(CN)6]n
− vacancies (y). A promising cathode material is the Fe-based, [Fe(CN)6]4- vacancy-free and Na-rich PBA known as Prussian white (PW), ![${\text{N}}{{\text{a}}_2}{\text{Fe}}\left[ {{\text{Fe}}{{\left( {{\text{CN}}} \right)}_6}} \right] \cdot {\text{z}}{{\text{H}}_2}{\text{O}}$](https://content.cld.iop.org/journals/2515-7655/4/4/044012/revision2/jpenergyac9808ieqn6.gif) , which has an average operating voltage of ∼3.2 V and a theoretical capacity of ∼170 mAhg−1 [3, 4].
, which has an average operating voltage of ∼3.2 V and a theoretical capacity of ∼170 mAhg−1 [3, 4].

Figure 1. The structure of PBAs consisting of metal centers  ´ linked by cyanide groups. The empty pores and faces within each subcube can accommodate guest ions (
 ) or molecules (
 ).
).
Download figure:
Standard image High-resolution imageA major challenge for using PW as a cathode material is its strong affinity to water. That is, the rapid uptake of moisture from the air to be incorporated in the bulk structure as crystal water. The crystal water can be released during charging (sodium removal) reacting with the electrolyte leading to unwanted side reactions in non-aqueous batteries. Further, water oxidizes at high potential leading to irreversible gas formation [5]. The water can be removed through drying, however, this induces an 18% volume contraction which leads to strain and particle cracking [6]. Furthermore, in the absence of water, the structure of PW changes between rhombohedral  and cubic
  symmetries during electrochemical cycling. This is accompanied by large volume changes, ±17%, and is responsible for poor cycling stability and loss of capacity over time [6, 7]. Herein lies the contrary impact of water on the electrochemical performance of PBAs. The presence of water prevents the dramatic volume changes during sodium extraction and insertion, thereby improving structural stability, reducing particle cracking and strain. If such a modification could be maintained over multiple cycles, resistance build up and capacity fade can be reduced. Understanding the origins of phase transitions in PW (and PBAs in general) could allow for chemical modifications to be designed, which suppress the phase transition without the need for water. A recent meta-study of the literature revealed that distortions in PBAs in general occur when the [M'(CN)6]n
− vacancy content is low and the A-site cation content is high [5, 8]. Unfortunately, both of these features are a prerequisite for PBAs to be used as cathode materials [6]. However, the meta-study also indicated that the presence of water does not induce phase transitions, instead it modifies the magnitude of already existing distortions [8, 9]. The presence of water also influences other aspects of PBAs performance in a battery. For example, water's presence can hinder sodium-ion transport through the framework and modulate the voltage output for redox reactions of the transitions metals [10, 11]. Thus, there is a complex interplay between the water content and electrochemical performance of PBAs.
symmetries during electrochemical cycling. This is accompanied by large volume changes, ±17%, and is responsible for poor cycling stability and loss of capacity over time [6, 7]. Herein lies the contrary impact of water on the electrochemical performance of PBAs. The presence of water prevents the dramatic volume changes during sodium extraction and insertion, thereby improving structural stability, reducing particle cracking and strain. If such a modification could be maintained over multiple cycles, resistance build up and capacity fade can be reduced. Understanding the origins of phase transitions in PW (and PBAs in general) could allow for chemical modifications to be designed, which suppress the phase transition without the need for water. A recent meta-study of the literature revealed that distortions in PBAs in general occur when the [M'(CN)6]n
− vacancy content is low and the A-site cation content is high [5, 8]. Unfortunately, both of these features are a prerequisite for PBAs to be used as cathode materials [6]. However, the meta-study also indicated that the presence of water does not induce phase transitions, instead it modifies the magnitude of already existing distortions [8, 9]. The presence of water also influences other aspects of PBAs performance in a battery. For example, water's presence can hinder sodium-ion transport through the framework and modulate the voltage output for redox reactions of the transitions metals [10, 11]. Thus, there is a complex interplay between the water content and electrochemical performance of PBAs.
To understand the various atomic and electronic structural influences, several robust structural models of hydrated and dehydrated PBAs need to be determined. Despite the large volume of research carried out on PBAs, the predominant use of x-ray diffraction (XRD) to study the structure has resulted in limited understanding of the mechanism behind the observed phase transitions [1, 8, 12]. Specifically for PW, there are inconsistencies regarding the structure of the hydrated phase. For example, Camacho et al reported a rhombohedral  structure for Na1.86Fe[Fe(CN)6]·1.92H2O with oxygen positioned on half of the faces of the subcube [13]. This paper also reported a new orthorhombic Na-rich PBA (Na1.8Fe[Fe(CN)6]·0.7H2O) [13]. On the other hand, Rudola et al reported a monoclinic
  structure for Na2Fe[Fe(CN)6]·2H2O with only a single oxygen atom at the face of the subcube [7]. Similarly, a monoclinic
  structure was determined for the compound Na1.88Fe[Fe(CN)6]·0.18H2O but with oxygen randomly distributed on the six faces of the PBA subcube with Na+ ions in the center of the subcube [6]. Moreover, a rhombohedral
  structure has been reported for Na1.76Fe[Fe(CN)6]·2.6H2O with Na+ ions distributed over three different sites indicating Na+ disorder [14]. Later, the same group carried out another study on a similar compound Na1.76Fe[Fe(CN)6]·2.6H2O and found a rhombohedral
  structure with two oxygen sites randomly distributed over the six faces of the subcube and Na+ ions located in the center of the subcube [15]. Thus, there is not yet consensus in the literature regarding the structure and, in particular, the position of water in hydrated PW. In contrast, most studies agree upon the rhombohedral
  structure for dry PW [6, 8, 13, 16].
These diffraction studies can also be compared to computational work on PBAs, which report that Na+ ions rather than water molecules occupy the faces of the subcubes due to the favorable electrostatic interaction between Na+ and the negatively charged N− and the small size of Na+ [16–19]. Consequently, each Na+ ion is coordinated by two water molecules occupying the interstitial sites within the porous framework with the negative dipole of H2O oriented towards the Na+ ion [17, 18]. The difference between computational and experimental structure as determined by XRD may originate from the similar scattering lengths of H2O and Na+, which both contain ten electrons. Thus, the structures should be reinvestigated utilizing neutron diffraction which can differentiate between both H2O and Na+ as well as more accurately determine the positions of C and N compared to XRD.
There is a considerable lack of neutron diffraction studies of PBAs compared to x-rays [20–23]. One example is Na1.89Mn[Fe(CN)6]0.97·1.87 H2O, which revealed  symmetry with a single oxygen site at the face of each subcube [20]. Upon dehydration, the monoclinic structure transforms into a rhombohedral
  structure with Na+ ions displacing along the c direction [20]. In other neutron studies of PBAs, the location of water within the structure has been included as high probability regions or clustering of oxygen atoms using computational methods [21, 22]. This indicates a disordered occupation of water in these materials. However, all neutron studies conclude that the space group symmetry, the water positions, and changes in site occupancies can be determined more accurately relative to previous x-rays studies. Thus, there is a need for neutron diffraction studies of PW, where none have been reported to date.
Here, we present the first neutron diffraction study of PW to determine accurate structures of the hydrated (H-PW) and dehydrated (D-PW) phases and follow the structural evolution between these phases from room temperature (RT, ∼25 °C) to 250 °C. The observed phase transitions were modeled by symmetry-mode Rietveld refinements and differentiated from each other using the octahedral tilt descriptions previously reported [8]. The results revealed the role that water plays in determining and driving the phase transitions in PW. This provides a structural basis for explaining the electrochemical behavior and making rational design strategies when chemically modifying PW.
2. Experimental methods
2.1. Synthesis
Synthesis of each hydrated Prussian white (H-PW) batch proceeded by preparing a solution of 0.44 M Na4[Fe(CN)6]·10H2O (Sisco Research Laboratories Pvt. Ltd; extra pure AR, 99%) in deionised and deoxygenated water and heating to 80 °C. An approximately two-fold molar excess of HCl (37%) was added over 12 h using a syringe pump to produce the acid-facilitated self-decomposition of Na4[Fe(CN)6]·10H2O. N2 was flowing during the reaction process that lasted 24 h. The obtained precipitate was filtered under inert conditions, washed four times with deionized and deoxygenated water, and finally dried under flowing N2 within the filtration setup for 12–24 h. Dehydrated Prussian White (D-PW) was prepared by drying a batch of H-PW at 160 °C for 48 h under vacuum. The resulting powders were stored in an Ar glovebox for further studies.
Synthesis of PW via co-precipitation (CP-PW) proceeded by preparing two solutions in deoxygenated water stirring for 1 h. Solution A contained 0.1 M FeSO4, 0.51 M sodium citrate, and 0.225 M ascorbic acid. Solution B contained 0.1 M Na4Fe(CN)6. The two solutions were added to a reaction bottle containing deionized and deoxygenated water heated to 80 °C at a constant rate of 4 ml h−1 over 13.5 h with stirring under flowing N2. The reaction solution was further aged for 8 h before filtration, washing with deionized and deoxygenated water, and finally drying at ambient temperature for 24 h under inert conditions. The resulting powder was stored in an Ar glovebox for further studies.
2.2. Characterization
Sample composition was determined using inductively coupled plasma-optical emission spectroscopy (ICP-OES) to determine Na and Fe contents, while elemental analysis was used to determine C, N, H content. Measurements were performed by Medac Ltd, United Kingdom. Water content and dehydration temperature of the samples were studied with thermogravimetric analysis (TGA) using TA Instruments TGA Q500 by loading ∼5 mg of powder in an Al pan in air before placing the sample into the TGA furnace under flowing N2 (60 ml min−1). The sample was heated to 500 °C with a heating rate of 5 °C min−1. Particle size and morphology were investigated using scanning electron microscopy (SEM) on a SEM/EDS-Zeiss 1550 instrument working with an acceleration voltage of 3 kV using an in-lens detector. The sample was loaded onto carbon tape in a glovebox and quickly transferred into the vacuum chamber of the microscope.
Mössbauer measurements were carried out at RT using constant acceleration type of vibrator and a 57CoRh source. The samples were enclosed in a sealed Al cover. The so-formed absorber had a sample concentration of ∼10 mg cm−2. Calibration spectra were recorded at 295 K using natural Fe metal foil as a reference absorber. The spectra were folded and fitted using the least square Mössbauer fitting program Recoil to obtain the values of the center shift CS, the magnitude of the electric quadrupole splitting IQSI, the full-width at half maxima W of the Lorentzian absorption lines, and the spectral areas A.
Samples were prepared for laboratory XRD experiments by dispersing the powder on a single crystal Si disc. Powder XRD measurements were performed on a Bruker D8 TwinTwin diffractometer (double Cu Kα radiation λ1 = 1.540600 Å, λ2 = 1.544390 Å) with a Lynx-eye XE-T position sensitive detector. The experiments were conducted between 10 and 80° in steps of 0.02°. Synchrotron powder XRD data were collected on the high-resolution powder diffraction beamline P02.1 at PETRA III, Hamburg, Germany [24]. The wavelength was determined to be 0.20734 Å from measurements of a LaB6 standard (NIST660c). The samples were filled into 0.3 mm glass capillaries in an argon-filled glovebox for high temperature measurements using a capillary spinner and Oxford hot–air blower with a variable heating rate. The diffraction patterns were collected using a Varex XRD 4343CT detector (150 × 150 µm2 pixel size, 2880 × 2880 pixel area). The obtained 2D patterns were integrated into 1D diffraction patterns using Dawn [25]. Neutron powder diffraction (ND) data were collected on the time-of-flight instrument POLARIS [26] at the ISIS Pulsed Neutron and Muon Source [27]. 1.6960 g of H-PW was loaded into an open cylindrical vanadium can and measured continously from RT to 250 °C with a heating rate of 0.4 °C min−1 with a 1 h collection time at RT, 1 h and 50 min collection time at 250 °C and a collection time of 10 min for each of the patterns during heating. Upon cooling, diffraction data was measured with a collection time of 4 min/pattern with a cooling rate of ∼1.25 °C min−1. 1.6095 g of D-PW was loaded into a open cylindrial vanadium can, cooled to 4 K, and measured for 12 h at 4 K. All refinements were performed using the Rietveld method [28] with symmetry-mode refinements using ISODISTORT [29] in the TOPAS software [30] where scale factors, cell parameters, peak shape, and atomic displacement factors (ADPs) were refined.
3. Results and discussion
3.1. Composition and initial characterization
ICP-OES analysis of H-PW revealed the composition Na2.14(7)Fe[Fe(CN)6]·zH2O indicating a successful synthesis of Na-rich, low vacancy PW (table S1). TGA measurement of H-PW (figure S1) shows a weight loss of ∼10.54(3) wt% when T < 225 °C, which corresponds to the release of surface absorbed water and interstitial water (=2.07(2) H2O per formula unit (f.u.)). Similarly, the composition of the PW sample synthesized by co-precipitation (CP-PW) was determined to be Na2.17(5)Fe[Fe(CN)6]·1.96(2)H2O from ICP-OES and TGA analysis (figure S1, table S1) and the composition of D-PW was determined to be Na2.08(7)Fe[Fe(CN)6]0.98(2) (table S1).
All samples have similar cubic morphology with H-PW and D-PW being micron-sized particles (as previous reported [6]) and CP-PW being multifaceted intergrown micron-sized particles (figure S2).
The Mössbauer spectrum at 295 K of H-PW (figure S3) shows a three-line structure, which was fitted using two quadrupole split doublets. The central unresolved line originates from low spin Fe2+ C and the well-resolved doublet originates from high spin Fe2+ N. The fitting parameters are presented in table S2. The hyperfine parameters are in good agreement with the results from earlier studies of PW [5, 6, 31]. The nominal value of Fe vacancies at the low spin site was verified from the Mössbauer spectral areas corresponding to low spin FeC and the high spin FeN. The areas were 47(3):53(3) indicating a vacancy-free structure.
Laboratory XRD was performed immediately following the synthesis of H-PW and revealed that the material adopts a monoclinic structure with space group  (figure S4).
3.2. Near room temperature octahedral tilt transition in PW
Neutron powder diffraction data were collected from RT up to 250 °C from H-PW. In the RT pattern, two phases were observed due to an incomplete phase transition which occurs between 30 to 40 °C from  to
to  . The presence of the
  phase can be seen in figure 2 by the appearance of the
  reflection between the
  and
and  reflections of the
  phase in the peak at 2.6 Å. A small amount of intensity of the
  reflections was observed at 33 °C with all the intensity gone by 40 °C. Thus, the transition is likely complete at ∼35 °C. This phase transition was also observed for a sample with similar composition Na2.17(5)Fe[Fe(CN)6]·1.96(2)H2O, CP-PW, prepared by co-precipitation. From synchrotron XRD (figures S5 and S6), CP-PW undergoes the same phase transition from
  to
to  between 30 to 40 °C. Hence, the phase transition near RT for Na-rich PW is independent of the synthesis method. The existence of both structures for the same compound near to RT has not been reported previously, although the two structures have been reported independently at RT [7, 13, 15].

Figure 2. Neutron powder diffraction data for H-PW. Green: data measured at RT. Orange: data measured at 40 °C. Inset shows the split peak (reflections  and
and  ) at 2.6 Å in the RT data.
Download figure:
Standard image High-resolution imageThe difference between the  and
and  structures relates to octahedral tilting [32]. Octahedral tilting involves either in-phase or out-of-phase rotation of the transition metal octahedra in PBAs. This is described by Glazer notation with '+' for in-phase and '−' for out-of-phase tilts with the lowercase letter denoting the relative magnitude of the tilt [32]. For PBAs with a high sodium or potassium content, the most prevalent tilt pattern is
  , which drives the monoclinic
  symmetry. This involves an in-phase tilt of the octahedra around one of the pseudo-cubic unit cell axes with out-of-phase tilts along the other two directions [33]. A tilt pattern of
  gives rise to rhombohedral
  symmetry, which is often seen for dehydrated sodium-containing PBAs. In this case, the tilting is out-of-phase for all three pseudo-cubic unit cell axes. It is the single in-phase tilt which gives rise to the split peaks in figure 2, which indicates that one of the crystallographic axes differs from the other two (
 ).
).
3.2.1. Refinements of the two near room temperature phases
Since the phase transition occurs close to RT, it is difficult to refine the pure  phase due to the presence of a second
  phase, which complicates the modeling of the neutron diffraction data. The
  phase was refined against data collected at 40 °C since the phase transition is complete at this temperature.
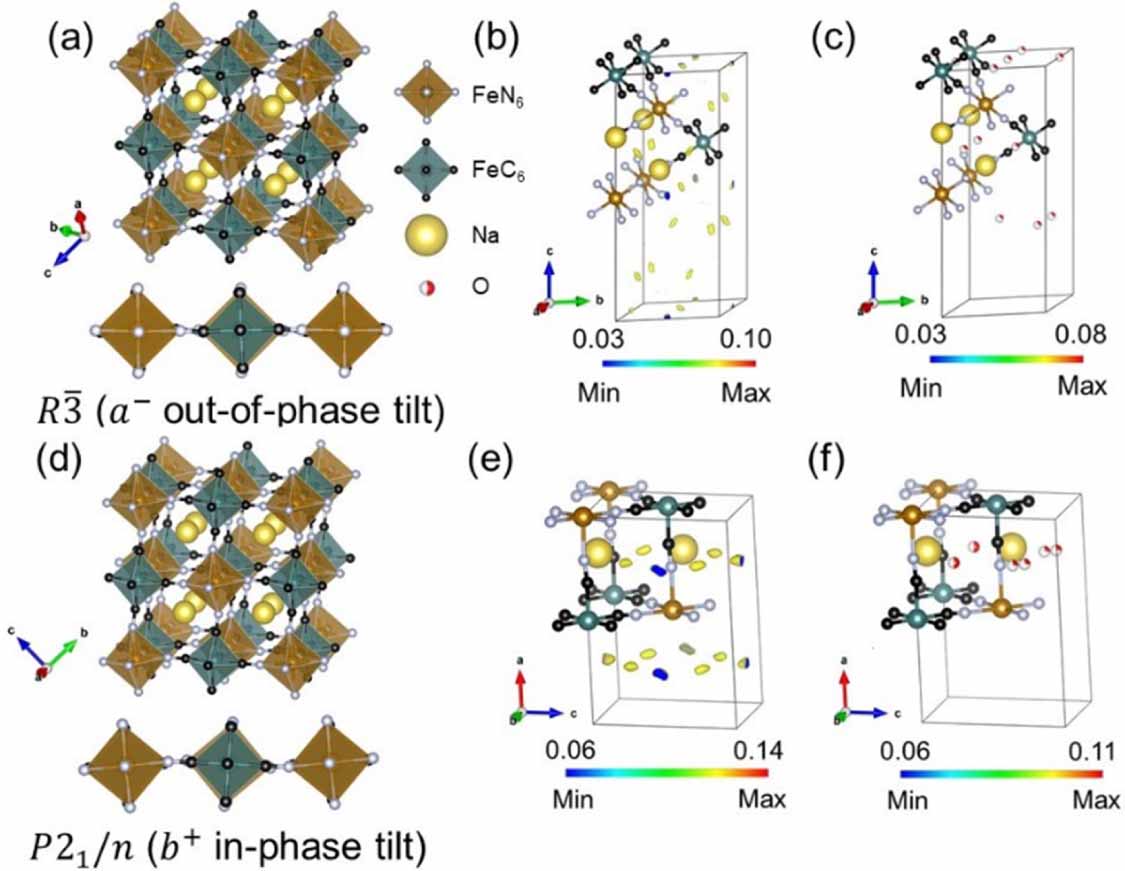
The PBA framework model with sodium included was refined prior to calculating Fourier difference maps to locate the water molecules within the structure. A  model containing Fe, C, N, and Na was fitted to the 40 °C data. The refined framework structure is shown in figure 3(a) including the out-of-phase tilt along the a direction of the pseudo-cubic unit cell. Water positions from the literature were tested to see if the scattering difference observed in the Fourier difference maps (figure 3(b)) was accounted for. The
  model from Wang et al [14] was applied by replacing two of the lower occupancy Na+ ions with oxygen atoms (located at −0.167, 0.167, 0.167 and 0.167, 0.333, 0.333 (Wyckoff position 18f)). This yielded a reasonable fit with all positive scattering difference accounted for (figure 3(c)), although with high ADPs for the oxygen atoms. Refinement of the oxygen occupancies resulted in zero occupancy of the oxygen site located at −0.167, 0.167, 0.167 (18f), which was subsequently removed from the model. This gave a stable refinement with reasonable ADPs for the oxygen site located at 0.167, 0.333, 0.333 (18f). Hydrogen atoms were not refined due to the positional and orientation disorder of the water molecules. Inclusion of hydrogen barely changes the simulated neutron diffraction pattern and subsequently does not affect the quality of the fit (figure S7). Similar results are reported in previous studies [20, 22, 23].

Figure 3. (a) Structure of the hydrated  without water (pseudo-cubic representation) and the tilt pattern. (b) Fourier difference map generated from a model containing only Fe, C, N, and Na. (c) Fourier difference map showing all positive scattering density accounted for when oxygen is included at the 0.167, 0.333, 0.333 (18f) position. (d) Structure of the
  without water (pseudo-cubic representation) and the tilt pattern. (e) Fourier difference map generated from a model containing only Fe, C, N, and Na. (f) Fourier difference map showing all positive scattering density accounted for when oxygen is included. Only part of the unit cell is shown for clarity and only positive scattering differences are shown. Fourier difference calculations were converted into 3D visualization maps using VESTA [34].
Download figure:
Standard image High-resolution imageThe established  model from the 40 °C data was fixed as the second phase in the RT data. The host framework structure of the primary
  phase containing Fe, C, N, and Na was refined from a starting model reported by Song et al [20] and is presented in figure 3(d) including the in-phase tilt along the a direction of the parent cubic unit cell. Similar to the
  model, Fourier difference maps were generated to determine the position of oxygen atoms. This revealed two possible sites (figure 3(e)), which were compared to sites reported in a previous
  model [6]. Inclusion of two oxygen sites on the 4e Wyckoff position within the bc-plane removed all the positive scattering differences (figure 3(f)), though the ADPs of the oxygen atoms were high. A closer inspection of the Fourier difference maps revealed an elongation of the observed positive scattering differences. Hence, one of the oxygen atoms was split into two sites, which reduced the ADPs and improved the stability of the refinement. The hydrogen positions were not refined for reasons outlined above.
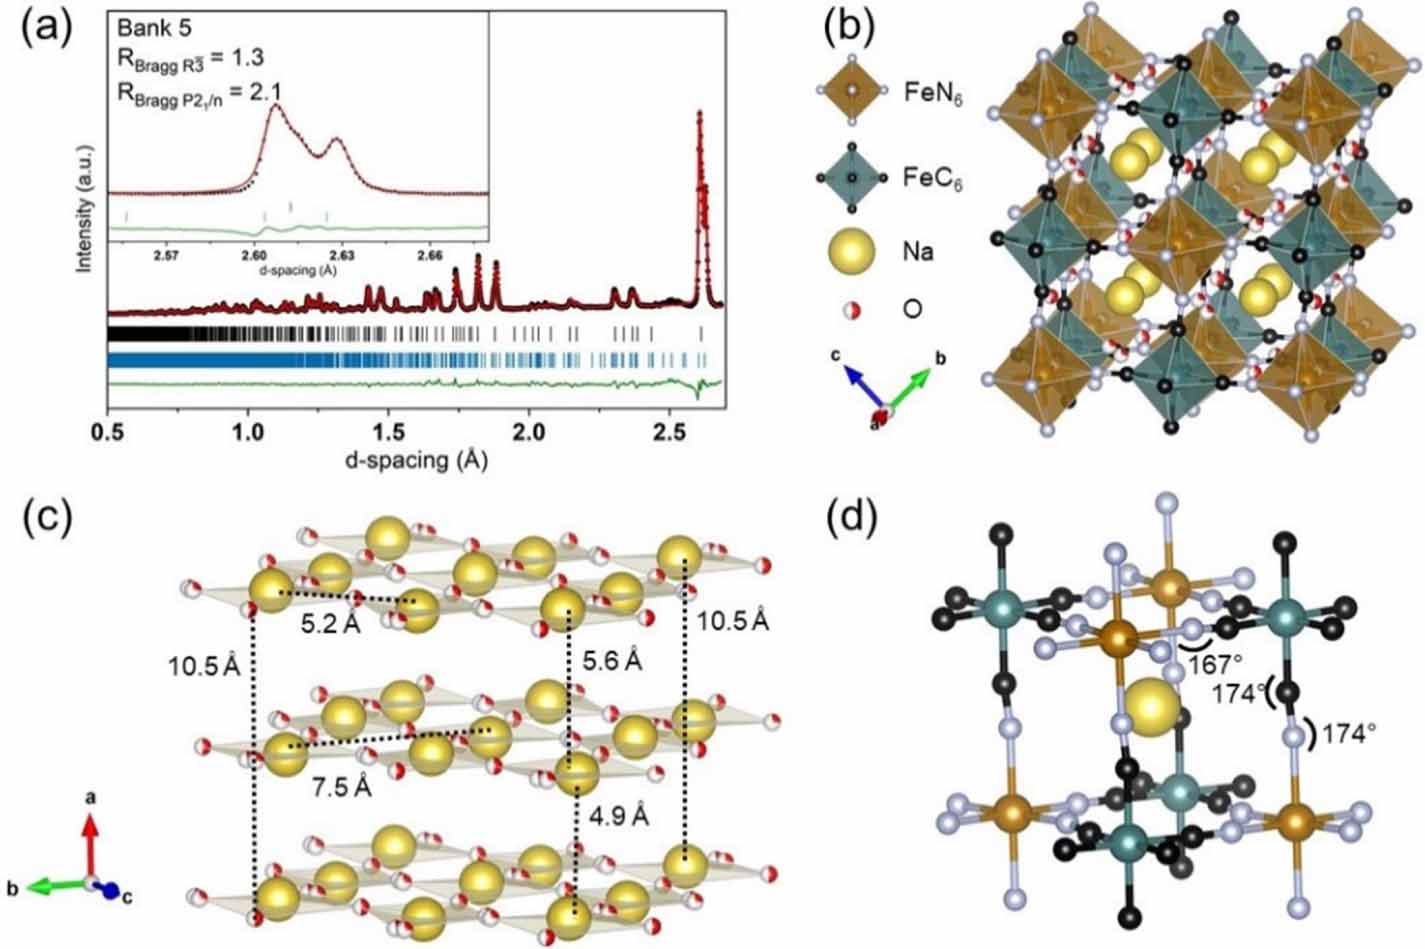
The final refined models with oxygen included are displayed in figures 4(a), (b) and S8, S9 with refinement details in tables S3 and S4. The model fitted to the RT data consists mainly of the  structure (82.8(5) %) with a minor hydrated
  phase (17.2(5) %). The data measured at 40 °C is fitted with a single hydrated
  structure.

Figure 4. (a) Neutron diffraction data measured at RT fitted with a  structure (82.8(5)%) and hydrated
  phase (17.2(5)%) with overall Rwp = 1.5% and χ2 = 2.5. Data is shown as black dots, the simulated pattern plotted in red, and the difference curve plotted in green. Allowed reflections are indicated with black vertical lines for the hydrated
  phase and blue vertical lines for the
  phase. (b) Pseudo-cubic structural representation emphasizing the degree of tilting and offset of Na+ in the
  structure. (c) Layering of Na+ and O in the bc-plane. (d) Selected bond angles within a single subcube of the
  structure.
Download figure:
Standard image High-resolution imageIn the RT  structure, Na+ is coordinated to a random distribution of O atoms within the bc-plane resulting in only four faces of each subcube occupied by O (figure 4(c)). This results in clear Na+ channels along a. Interestingly, the in-phase tilt
  also lies along the a direction implying that the positioning of water might direct the nature of tilting in PBAs. Layering of Na+ and O in the bc-plane was also found for the
  structure of Na1.89Mn[Fe(CN)6]0.97·1.87H2O [20]. For the
  model in the present study, one of the O atoms was included as a split site. This can be explained by considering the ideal Na–O bond distance for water coordinated to Na+ ions, which is 2.3 Å [7, 20]. The distance between the center of mass for the split site and a neighboring Na+ is 2.6 Å. Thus, in reality water must lie slightly closer to one of the two Na+ ions. These displacements are not long-range ordered leading to the appearance of a split site on average. The obtained bond angles for the
  structure reported here agree with those previous reported [6, 14] with the Fe–N–C bond angle being similar to or less than the Fe–C–N bond angles. This is due to the σ-bonding character of the Fe–N bond providing higher flexibility (figure 4(d)) [18, 20].
Transitioning to the hydrated  structure determined at 40 °C (figure S9), O instead appears to be randomly distributed over three faces of each subcube. Here, there are no clear Na+ channels in any direction. It should be noted, however, that several distributions of the O atoms were tested which resulted in similar ADPs and quality of fits. This can partly be explained by the short collection time (10 min) of the 40 °C data. All models provided equal quality of fits except for one model containing O atoms on both the −0.167, 0.167, 0.167 and 0.167, 0.333, 0.333 sites, which did not calculate any intensity for the
  reflection in the bank 2 data. Thus, it is difficult to draw any compelling conclusions about the arrangement of water in the
  phase, except for the higher degree of disorder compared to the
  structure. Aside from the change in the tilting system between the
  and
and  structures (figure 3) and very minor change of the offset of Na+ within a subcube (figure S10), all bond distances and angles remain similar. Insight into the local structure using total scattering techniques would unravel any local order of water in the hydrated
  structure. In summary, the
  and
and  structures can both exist for a single compound and the structures were determined with higher degree of confidence due to the use of neutron diffraction.
3.3. Dehydration of PW
Prior to use in SIBs, PW is dehydrated which results in structural collapse. To investigate the distortions driving this change in detail, neutron diffraction data were collected on a fully dehydrated sample, D-PW. These data were initially modeled using the obtained hydrated  model without the O atoms included (figures 5(a) and (b), tables S5 and S6). The structure agrees with previously reported structures of dehydrated PW from x-ray data and ab initio calculations [6, 16]. Upon dehydration, the volume reduces by 20% relative to the hydrated material, leading to loss of crystallinity (as indicated by peak broadening) in line with previous studies [6, 20]. Symmetry-mode refinement allows the causes of this phase transition to be understood more clearly. The key distortion modes identified were displacement of Na+ along c towards the FeN6 octahedra and the tilting of rigid FeN6 and FeC6 octahedra. As expected, due to the π-bonding character of the Fe–C bond, the Fe–C–N bond angle does not deviate significantly from the hydrated material (figure 5(c)) [18, 20]. Finally, Fe-C/N bond distances remain unchanged relative to the hydrated material.

Figure 5. (a) Neutron powder diffraction data for D-PW. Data fitted with  structural model with overall Rwp = 2.2% and χ2 = 3.4 (fit of banks 2–4 provided in figure S11). Data is shown as black dots, the simulated pattern plotted in red, and the difference curve plotted in green. Allowed reflections for the
  phase are indicated with black vertical lines. (b) Local structure of D-PW drawn to emphasize the degree of tilting and offset of Na+. (c) Selected bond lengths/angles within a single subcube of D-PW. The red arrow indicates the direction Na+ is displaced along.
Download figure:
Standard image High-resolution imageSummarizing the observed changes, the mechanism for the volume collapse can be described. The Na+ ions displace along the c direction due to Coulombic attraction to the higher electron density on the N-bound Fe atom. The N atoms opposite are pulled with the Na+ ion towards the same direction of displacement due to the same Coulombic attraction resulting in short Na-N distances. At the same time, the rigid octahedra are rotated. The structural collapse is also evident looking at the rotation of the octahedra (table 1). In the hydrated  structure of H-PW, the FeC6 octahedra are rotated 1.69(1)° while the FeN6 octahedra are rotated 1.52(7)°. Upon dehydration, the FeC6 octahedra rotate 17.44(6)° while the FeN6 octahedra rotate 22.60(4)°, thus, the magnitude of the tilt in the
  tilt pattern increases. It is reasonable that the FeN6 octahedra rotate to a larger degree due to the Coulomb attraction between Na+ and N− and the stronger Fe–C bond providing less flexibility [
11, 18, 35
]. Finally, the removal of water does not change the nature of distortions in PBAs, but rather modifies the magnitude of the pre-existing distortions.
tilt pattern increases. It is reasonable that the FeN6 octahedra rotate to a larger degree due to the Coulomb attraction between Na+ and N− and the stronger Fe–C bond providing less flexibility [
11, 18, 35
]. Finally, the removal of water does not change the nature of distortions in PBAs, but rather modifies the magnitude of the pre-existing distortions.
Table 1. Selected rotation angles and bond distances in H-PW and D-PW ( ).
).
| Rotation angles/bond distances | H-PW | D-PW | Difference |
|---|---|---|---|
| FeN–FeC–C | 1.52(7)° | 18.96(4)° | 17.44(6)° |
| FeC–FeN–N | 1.69(1)° | 24.29(4)° | 22.60(4)° |
| FeC–Na | 4.421(3) Å | 5.773(4) Å | 1.352(3) Å |
| FeN–Na | 4.344(3) Å | 3.722(4) Å | −0.622(3) Å |
3.4. Variable temperature studies of PW
To study the dehydration mechanism, the structural evolution of H-PW was followed during heating using x-ray and neutron diffraction (figures 6(a) and S12). Initially, PW adopts a  structure which converts to a hydrated
  structure close to 35 °C. From the synchrotron XRD data, H-PW transforms from the hydrated
  phase to a cubic
  phase at ∼120 °C as evidenced by the appearance of the 440 cubic reflection between the
  and
and  reflections of the hydrated
  . This cubic phase coexists with the dehydrated
  phase from 220 °C to 245 °C when heated at a rate of 1 °C min−1 (figure S12). Interestingly, the transition to
  begins at 176 °C in the ND data (figure 6(a)) and the transition to cubic did not go to completion before complete conversion to the dehydrated
  phase at 230 °C. Here, a heating rate of 0.4 °C min−1 was applied. In this case, the ND experiment used a larger sample volume compared to the XRD experiment (∼2 g vs ∼2 mg) potentially leading to lower heating efficiency through the whole sample. Previous work on Na1.76Fe[Fe(CN)6]·2.6H2O revealed that the cubic
  phase appears at 150 °C when heated at 3 °C min−1 and continues to coexist with a high-temperature
  phase until 300 °C [15].

Figure 6. (a) Neutron diffraction data from detector bank 5 in the region 1.6–1.8 Å. The white reference lines indicate the phase transitions temperatures. (b) The temperature dependence of lattice parameters a and c for H-PW upon heating. The black dotted lines are used as a visual guide to observe deviation from linear thermal expansion. Error bars are presented in the graph but are in the range of 10−4 Å.
Download figure:
Standard image High-resolution image
It is clear that the dehydration process is kinetically limited and thus dependent on the heating efficiency and heating rate. The sluggish kinetics of dehydration is likely due to a combination of strong bonding of water to sodium within the structure [31], large diffusion distances through the micron-sized particles, and the energy cost associated with induced strain from the phase transition to the dehydrated  structure. It has been previously shown that Na+ ion diffusion through the structure is similarly affected by the presence of water [10]. Further insight on the impact of water and the temperature at which it begins to leave the structure can be obtained from the cell parameter changes during the variable temperature experiment (figure 6(c)).
The thermal expansion of H-PW was extracted from the variable temperature data in the range 40–140 °C. The thermal expansion coefficients were calculated using PASCal [36]. In contrast to most PBAs [
37, 38
], H-PW exhibits anisotropic thermal expansion and a small positive volumetric expansion upon heating. The coefficients of thermal expansion (CTE) are  for the ab-plane and
  for the c direction. After dehydration, the sample (now called DH-PW) was cooled from 250 °C down to 35 °C. DH-PW also shows anisotropic thermal expansion with the ab-plane expanding and the c direction contracting with corresponding CTEs of
  and
and  over the temperature range measured. DH-PW also exhibits positive volumetric expansion with a higher rate compared to the hydrated phase. Most PBAs show isotropic negative thermal expansion upon heating (due to their cubic symmetry) with very low magnitudes of CTE [
37
–
40
]. The different behavior of PW is a result of the lower symmetry, however, the lack of thermal expansion studies of other distorted PBAs prevents more in-depth comparison. However, the difference between H-PW and DH-PW indicates that the presence of water has a strong influence on the sign and magnitude of the expansion.
over the temperature range measured. DH-PW also exhibits positive volumetric expansion with a higher rate compared to the hydrated phase. Most PBAs show isotropic negative thermal expansion upon heating (due to their cubic symmetry) with very low magnitudes of CTE [
37
–
40
]. The different behavior of PW is a result of the lower symmetry, however, the lack of thermal expansion studies of other distorted PBAs prevents more in-depth comparison. However, the difference between H-PW and DH-PW indicates that the presence of water has a strong influence on the sign and magnitude of the expansion.
4. Conclusions
As the presence of water has a significant effect on the material performance of PW (![${\text{N}}{{\text{a}}_2}{\text{Fe}}\left[ {{\text{Fe}}{{\left( {{\text{CN}}} \right)}_6}} \right] \cdot$](https://content.cld.iop.org/journals/2515-7655/4/4/044012/revision2/jpenergyac9808ieqn97.gif)
 ), a solid structural understanding is needed to rationalize the electrochemical properties and improve the material. This was achieved in this study using neutron diffraction. For the first time it was shown that both a monoclinic and hydrated rhombohedral structure for a single composition of PW exist near RT independently of the synthesis method. During this phase transition, the ordering of the water is lost and this ordering transition is accompanied to a change in the nature of the octahedral tilting distortions. This observation subsequently proved the previous hypothesis that water does not induce phase transitions, but rather modifies the magnitude of pre-existing distortions as the symmetry of the structure was maintained during dehydration. Therefore, the phase transition is an inherent property of cation rich PBAs and replacement of water with another small neutral molecule is a viable strategy to modifying the magnitude of volume change. Finally, the onset of dehydration occurs earlier, around 120 °C, than previously reported [15]. However, the removal of water is kinetically hindered and subsequent phase transitions, such as the appearance of the metastable cubic PW, are heavily dependent on the measurement conditions. This work provides vital insight into how water content influences phase transitions and tilting in PW. The structural models determined here will be useful for modeling of diffusion pathways as well as understanding and predicting how neutral guest species influence structural stability and electronic structure in PBAs.
Acknowledgments
This research is funded by Stiftelsen för Strategisk Forskning (SSF) within the Swedish National Graduate School in Neutron Scattering, SwedNess (GSn15–0008). The authors also gratefully acknowledge funding from the Strategic Research Area StandUp for Energy and Energimyndigheten (45517-1). We acknowledge DESY (Hamburg, Germany), a member of the Helmholtz Association HGF, for the provision of experimental facilities. Parts of this research were carried out at PETRA III using beamline P02.1 and we would like to thank Alexander Schökel and Volodymyr Baran for assistance. We acknowledge the Science and Technology Facilities Council (STFC) for access to neutron beamtime at ISIS and also for the provision of sample preparation at the POLARIS instrument.
Data availability statement
The data that support the findings of this study are openly available at the following URL/DOI: https://doi.org/10.5286/ISIS.E.RB2010290-1.
Conflict of interest
W R B is a co-founder of the company ALTRIS AB which produces Prussian white powder for sodium-ion battery applications.
Supplementary data (1.7 MB DOCX)