

Abstract
Proton-conducting ceramics (e.g. doped barium zirconates or cerates) are typically mixed ionic-electronic conductors (MIECs). The electronic conduction, typically in the form of positively charged small polarons or electron holes, leads to 'electronic leakage.' In an ideal steam-electrolysis cell, one gas-phase H2 molecule is produced from every two electrons delivered from an external power source. In other words, such ideal behavior achieves 100% faradaic efficiency. However, the electronic flux associated with MIEC membranes contributes to reduced faradaic efficiency. The present paper develops a model that predicts the behavior of faradaic efficiency as a function of electrolysis-cell operating conditions. Although the model framework is more general, the paper focuses on the behavior of a cell based upon a BaCe0.7Zr0.1Y0.1Yb0.1O (BCZYYb) membrane. The study predicts the effects of operating conditions, including temperature, pressure, and gas compositions.
Export citation and abstract BibTeX RIS
1. Introduction
Faradaic efficiency is widely used as a performance metric for protonic ceramic electrolysis cells. There is general agreement that faradaic efficiency is defined as

where  is net hydrogen molar flux (per cell area), i is the externally imposed current density, and F is the Faraday constant. Despite general, although not universal, agreement on the meaning of faradaic efficiency, there are significant qualitative and quantitative differences in published faradaic efficiencies [1, 2]. Some papers report that faradaic efficiency increases as the imposed current density increases, with vanishingly small faradaic efficiency near open-circuit conditions (cf [3–7]). Other papers report that faradaic efficiency decreases as imposed current density increases, with near-unity faradaic efficiency near open-circuit conditions (cf [8–12]). Such apparently contradictory reports potentially confuse the practical utility of faradaic efficiency as a performance metric.
In an ideal electrolysis cell, gas-phase H2O(g) is dissociated on the positrode to deliver protons  to the protonic-ceramic electrolyte membrane, electrons to the external circuit and O2(g) to the gas phase. Stated in Kröger–Vink notation,

where  is a neutral oxygen site within the protonic-ceramic membrane, (el) and (ed) denote the electrolyte and electrode phases, respectively. Following proton transport through the protonic-ceramic membrane, the role of the negatrode is to consume electrons from the external circuit to produce the desired H2. In Kröger–Vink notation,

If the membrane were a pure proton conductor (i.e. not a mixed mixed ionic and electronic conductor (MIEC)), the processes represented by equations (2) and (3) would consume two electrons from the external circuit to produce one molecular hydrogen, yielding perfect faradaic efficiency.
However, because most protonic-ceramic electrolytes are MIECs, there is some 'electronic leakage' that serves to reduce faradaic efficiency. In other words, some of the imposed electrical current can be conducted through the membrane without producing proton flux, and hence hydrogen flux. The undesired electronic flux through the membrane is typically in the form of a small polaron or an electron hole. In BCZY (BaCe Zrx
Yy
O
Zrx
Yy
O ) solid-solution electrolytes, increasing cerium content tends to increase faradaic efficiency. This is because the electrolyte electronic contributions decrease in oxygen-containing atmospheres [3, 15]. Han et al studied 20% yttrium-doped BCZY solid solutions with varying Ce content, ranging from BZY20 (BaZr0.8Y0.2O
 ) to BCY20 (BaCe0.8Y0.2O
 ) [15]. They reported an increase of the dehydration temperature with increasing the cerium content, ranging from
  ∘C to
∘C to  ∘C for BZY20 and BCY20 respectively. This result shows that the cerium component favors the stabilization of protons. Additionally, Han, et al determined transport numbers—first for the electronic contribution in oxidizing atmosphere and the ionic contribution. Increasing the cerium content leads to a decrease of the electronic transference number and an increase of the ionic one. The protonic and anionic (oxygen ions) contributions could be further distinguished. The ionic transport number is primarily protonic at 500 ∘C and 550 ∘C for all the compositions, independent of the cerium content. However, as temperature increases above 550 ∘C, the anionic contribution increases with the cerium content reaching 40% for BCY20 at 650 ∘C. Together with supporting DFT simulations, they concluded that the more favorable hydration thermodynamics for high cerium content is accompanied by reduced proton mobility. While higher cerium content is undesirable for stability in high steam environments, there is a compromise to be made. A BCZY solution with 40% of cerium on the perovskite B-site has proven to be stable in electrolysis mode [6]. An alternative approach could be to use a higher cerium containing BCZY such as BCZYYb7111 (BaCe0.7Zr0.1Y0.1Yb0.1O
 ) and add a thin protective layer on the high steam side (for example a pyrochlore [11]).
In addition to properties of the electrolyte material itself, the faradaic efficiency depends on numerous operating conditions that include current density, temperature, pressure, and gas compositions on both sides of the membrane. Table 1 summarizes aspects of reported faradaic efficiencies. Higher steam pressures and lower temperatures diminish electronic conductivity, leading to higher faradaic efficiencies [6, 10, 16]. Because increasing the current density increases Joule heating, high current density can cause the electrolyte to be significantly higher than the furnace temperature. For example, assume an area specific resistance of ASR = 1 Ω cm2 and an imposed current density of i = 1 A cm−2. The resulting heat generation (per membrane area) owing to membrane polarization and proton flux is Q ≈ 1 W cm−2 [17]. As discussed subsequently, this could explain the decrease of faradaic efficiency with increasing the current density. Chemistry on steam-side electrode also impacts the hydrogen fluxes produced, and therefore the faradaic efficiencies. Higher performance electrodes lead to increased faradaic efficiency [6, 10].
Table 1. Reported protonic-ceramic electrolysis faradaic efficiencies ηF with a variety of electrode and electrolyte materials and operating conditions.
| Electrolyte | Steam | T | H2 collection | Flow | Steam feed | Flow | Current | ηF | |
|---|---|---|---|---|---|---|---|---|---|
| membrane | electrode | (∘C) | composition | (sccm) | composition | (sccm) | (A cm−2) | (%) | Reference |
| 30 µm | BGLC | 700 | 0.5 bar H2, | — | 1.5 bar H2O | — | 0.2 | 54 | [10] |
| BCZY27 | 3 bar total | 3 bar total | |||||||
| 30 µm | BGLC | 700 | 0.5 bar H2, | — | 1.5 bar H2O | — | 0.25 | 58 | [10] |
| BCZY27 | 3 bar total | 3 bar total | |||||||
| 30 µm | BGLC | 600 | 0.5 bar H2, | — | 1.5 bar H2O | — | 0.2 | 86 | [10] |
| BCZY27 | 3 bar total | 3 bar total | |||||||
| 30 µm | BGLC | 600 | 0.5 bar H2, | — | 1.5 bar H2O | — | 0.25 | 85 | [10] |
| BCZY27 | 3 bar total | 3 bar total | |||||||
| 30 µm | BGLC | 500 | 0.5 bar H2, | — | 1.5 bar H2O | — | 0.2 | 84 | [10] |
| BCZY27 | 3 bar total | 3 bar total | |||||||
| 30 µm | BGLC | 500 | 0.5 bar H2, | — | 1.5 bar H2O | — | 0.25 | 85 | [10] |
| BCZY27 | 3 bar total | 3 bar total | |||||||
| 10 µm | PBSCF | 600 | 0.2 bar H2, | — | 0.9 bar H2O | — | 0.25 | 90 | [12] |
| BCZYYb7111 | 10−6 bar H2O | 0.1 bar O2 | |||||||
| 10 µm | PBSCF | 600 | 0.2 bar H2, | — | 0.9 bar H2O | — | 1.0 | 40 | [12] |
| BCZYYb7111 | 10−6 bar H2O | 0.1 bar O2 | |||||||
| 10 µm | PBSCF | 600 | 0.2 bar H2, | — | 0.97 bar H2O | — | 0.25 | 90 | [12] |
| BCZYYb7111 | 10−6 bar H2O | 0.03 bar O2 | |||||||
| 10 µm | PBSCF | 600 | 0.2 bar H2, | — | 0.97 bar H2O | — | 1.0 | 20 | [12] |
| BCZYYb7111 | 10−6 bar H2O | 0.03 bar O2 | |||||||
| 18 µm | SFM/BZY | 600 | H2/N2, | — | 0.03 bar H2O | — | 0.25 | 57 | [13] |
| BZY20 | balance air | ||||||||
| 85 µm | BZY/LSV | 600 | 50%H2, 47% He, | 10 | 10% H2O, 4% H2 | 10 | 0.25 | 100 | [9] |
| BZCYCu | 3% H2O | balance Ar | |||||||
| 85 µm | BZY/LSV | 600 | 50%H2, 47% He, | 10 | 10% H2O, 4% H2 | 10 | 1.0 | 84 | [9] |
| BZCYCu | 3% H2O | balance Ar | |||||||
| 15 µm | PBSCF | 600 | 5%H2, 3% H2O, | 50 | 3% H2O | 200 | 0.25 | 91 | [6] |
| BCZYYb4411 | balance Ar | balance Ar | |||||||
| 15 µm | PBSCF | 600 | 5%H2, 3% H2O, | 50 | 3% H2O | 200 | 1.0 | 91 | [6] |
| BCZYYb4411 | balance Ar | balance Ar | |||||||
| 15 µm | PBSCF | 500 | 5%H2, 3% H2O, | 50 | 3% H2O | 200 | 0.25 | 97 | [6] |
| BCZYYb4411 | balance Ar | balance Ar | |||||||
| 20 µm | PNO | 500 | Dry H2 | — | 0.6 bar H2O | — | 0.25 | 60 | [11] |
| BCZYYb7111 | |||||||||
| 20 µm | PNO | 500 | Dry H2 | — | 0.6 bar H2O | — | 1.0 | 35 | [11] |
| BCZYYb7111 | |||||||||
| 10 µm | BLC | 600 | 1% H2 | 30 | 80% H2O, 1% O2 | 30 | 0.25 | 80 | [14] |
(BCZY(45) 2) 2) | balance Ar | balance Ar | |||||||
| 10 µm | BLC | 500 | 1% H2 | 30 | 80% H2O, 1% O2 | 30 | 0.25 | 76 | [14] |
(BCZY(45) 2) 2) | balance Ar | balance Ar | |||||||
| 20 µm | BCFZY | 600 | 5% H2, 1% H2O | 60 | 80% air, | 375 | 0.25 | 35 | [5] |
| BZY20 | balance Ar | 20% H2O | |||||||
| 20 µm | BCFZY | 600 | 5% H2, 1% H2O | 60 | 80% air, | 375 | 1.0 | 50 | [5] |
| BZY20 | balance Ar | 20% H2O | |||||||
| 20 µm | BCFZY | 600 | 5% H2, 1% H2O | 60 | 80% air, | 375 | 0.25 | 35 | [5] |
| BCZYYb7111 | balance Ar | 20% H2O | |||||||
| 20 µm | BCFZY | 600 | 5% H2, 1% H2O | 60 | 80% air, | 375 | 1.0 | 95 | [5] |
| BCZYYb7111 | balance Ar | 20% H2O |
The chemical formulas defining the materials' abbreviations are as follows:BCZY27 = BaCe0.2Zr0.7Y0.1O ; BGLC = Ba
 Gd0.8La
 Co2O
Co2O , BCZYYb7111 = BaCe0.7Zr0.1Y0.1Yb0.1O
 ,PBSCF = PrBa0.5Sr0.5Co1.5Fe0.5O
 ,
BZY20 = BaZr0.8Y0.2O
,
BZY20 = BaZr0.8Y0.2O , SFM = Sr2Fe1.5Mo0.5O
 ,BZCYCu = Ba(Zr0.30Ce0.54Y0.15Cu0.01)O
 ,
LSV = (La0.7Sr0.3)V0.9O
,
LSV = (La0.7Sr0.3)V0.9O ,
BCZYYb4411 = BaCe0.4Zr0.4Y0.1Yb0.1O
,
BCZYYb4411 = BaCe0.4Zr0.4Y0.1Yb0.1O ,PNO = Pr2NiO
 , (BCZY(45)
 2) = BaCe0.36Zr0.44Y0.2O2.9, BLC = Ba0.5La0.5CoO
 , BCFZY = BaCo0.4Fe0.4Zr0.1Y0.1O
1.1. Faradaic efficiency characteristics
Figure 1 illustrates the general behavior of faradaic efficiency as a function of imposed current density. In electrolysis, by convention, the imposed current densities are negative, making a distinction from fuel-cell operation. The gas-phase composition on the hydrogen-collection side is typically moist hydrogen. The gas-phase composition on the steam-feed side is typically a mixture of H2O and O2, which is the product of the steam dissociation. The behavior shown in figure 1 is based on operating at 600 ∘C and atmospheric pressure. The hydrogen-collection side is maintained at 97% H2 and 3% H2O. The steam-feed side is maintained as a steam-depleted composition with 80% O2 and 20% H2O.
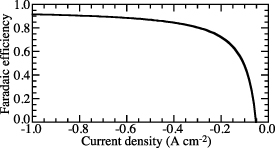
Figure 1. Characteristic functional form of electrolysis faradaic efficiency as a function of imposed electrical current density. Note that the imposed current densities are negative, indicating electrolysis polarization.
Download figure:
Standard image High-resolution imageNear open circuit, the faradaic efficiency decreases sharply, becoming negative at low current density. Based on the gas-phase compositions, there is always a high H2 concentration on the hydrogen side, providing a tendency to drive protons toward the steam side—opposite the desired behavior. At open circuit (i.e. zero imposed current), the cell behaves as a concentration cell, driving protons toward the steam side, resulting in a reverse H2 flux. At low current density (near open circuit), the imposed current retards the reverse proton flux. However, at sufficiently low current, the reverse proton flux persists and the faradaic efficiency is small and even negative. As the imposed current increases, the concentration-cell behavior diminishes and the tendency for reverse proton flux is dominated by the desired proton flux to produce H2. Thus, the faradaic efficiency increases as imposed current density increases.
Assuming defect equilibrium at the electrode-electrolyte interfaces and ideal charge-transfer kinetics at the triple-phase-boundary (TPB) regions, Zhu et al [3] reported qualitatively similar characteristics of faradaic efficiency based on the BCZYYb membrane, and also presented very detailed analysis and explanation for the trend of faradaic efficiency.
1.2. Modeling framework
It becomes difficult to compare directly the reported experimental data because materials, temperature, gas-phase partial pressures, gas flow rates, and current-density ranges vary among different studies. Additionally, in no cases are the reported experimental conditions sufficient to unambiguously interpret the results. For example, without knowing gas flow rates and chamber volumes, one cannot determine important gas depletion and dilution that affects faradaic efficiency.
The present paper develops a computational model that predicts electrolysis performance in a laboratory-scale button-cell configuration (figure 2). For the purposes of the present analysis, the gas compositions are fixed on both sides of the membrane-electrode assembly. In other words, the feed gas flows are sufficiently high as to 'flood' the cathode and anode sides of the cell. Such flooding is not necessarily the case in all reported experiments.
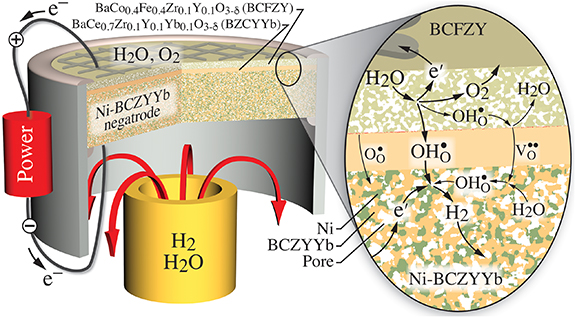
Figure 2. Illustration of an electrolysis cell configured as a laboratory-scale button cell.
Download figure:
Standard image High-resolution image2. Model formulation and parameter calibration
The underlying model formulation and implementation is documented in numerous prior publications [3–5, 18–24]. Broadly speaking, the model uses a Nernst–Planck representation of charged-defect transport within the electrolyte phase, a Dusty-Gas representation of gas-phase transport within the porous composite electrodes, and a Butler–Volmer representation of the charge-transfer kinetics. Within the electrolyte phase the effective diffusion coefficients of three charged defects (OH , V
, V , and O
 ) are fit to measured conductivities using the Nernst–Einstein relationships. With a focus on the faradaic efficiency, the following paragraphs discuss details of the defect-incorporation chemistry and charge-transfer kinetics.
To be concrete, the model is based upon a thin (15 µm) electrolyte membrane made of BaCe0.7Zr0.1Y0.1Yb0.1O (BCZYYb) [3]. The anode (steam-side electrode, positrode) is a thin (20 µm) porous triple-conducting oxide made of BaCo0.4Fe0.4Zr0.1Y0.1O
 (BCFZY) [25]. The cathode (hydrogen-production side, negatrode) is a thick (500 µm) porous Ni-BCZYYb composite. The models are developed to match published polarization data using the cell in a fuel-cell mode [26]. However, the model is exercised as an electrolysis cell, exploring the effects of operating conditions on faradaic efficiency.
Although equations (2) and (3) offer a global view of the electrolysis chemistry, many more elementary reactions and transport phenomena contribute to the actual performance. Two classes of reactions are relevant. One is charge transfer, transferring charge across phase interfaces (e.g. electrode and electrolyte phases). The other is defect-incorporation, such Stotz–Wagner hydration that dissociates H2O to produce protons in the electrolyte phase,

This is not classified as a charge-transfer reaction because all the charges remain within the electrolyte phase. In any case, electrolysis performance depends on the rates of the contributing reactions. In addition to activities of the participating species, the rates of charge-transfer reactions depend on the electrostatic-potential differences between participating phases.
Defect-incorporation reactions can proceed directly on the surfaces of the proton-conducting electrolyte. Charge-transfer reactions can proceed at triple-phase boundaries (TPBs), at interfaces between the electrode and electrolyte phases, and at the interfaces between the gas and MIEC phase. The present paper uses the Butler–Volmer formulation to represent the charge-transfer reactions at TPB regions.
2.1. Negatrode-electrolyte charge-transfer rate
The charge-transfer reaction for the reduction of protons to hydrogen in the negatrode-electrolyte TPB regions (cathode, hydrogen-collection side) can be written globally as

Note that the reaction is written with the forward rate being in the anodic direction (i.e. producing electrons). Using an activation overpotential,  , the charge-transfer rate can be expressed in a Butler–Volmer format as

The exchange current density i0 can be expressed as [24]

where βa and βc are the anodic and cathodic symmetric factors with  .
.  , and
, and  is the equilibrium constant of hydrogen adsorption on the metal surface. The temperature dependence of
  can be expressed in Arrhenius form as
  with
with  and E being fitting parameters.
2.2. Positrode-electrolyte charge-transfer rate
At the positrode-electrolyte interface (anode, steam-feed side), the overall charge-transfer reaction of water splitting to protons and oxygen can be expressed globally as

In terms of Butler–Volmer formulation for the charge-transfer rate, the exchange current density can be derived as [24]

where βa and βc are the anodic and cathodic symmetric factors with  . The parameters
  , and
, and  where
where  and
and  are the equilibrium constants for
  and
and  adsorption on the electrode surface. The temperature dependence of
  can also be expressed in Arrhenius form.
2.3. Defect chemistry
Table 2 lists the incorporation reactions of  ,
,  and
and  on the gas-ceramic interfaces and trapping reaction on the BCZYYb surface and within the membrane bulk [3]. The reactions involve three mobile defects (protons
  , oxygen vacancies
  , O-site polarons
  ) and three immobile defects (lattice oxygen
  , trapped polaron complex
  , and untrapped dopants
  ) while X = (Y,Yb). Table 2 lists the fitted net enthalpy and entropy changes for each reaction. Table 3 lists the diffusion coefficients for mobile defects. Within the Ni-BCZYYb anode microstructure, the global gas-phase reaction (
 ) is represented using the detailed heterogeneous reaction mechanism [18].
Table 2. Thermodynamics of defect reactions for BCZYYb [3].

|

| ||
|---|---|---|---|
| Reactions | (kJ mol−1) | (J mol−1 K−1) | Kp (600 ∘C) |
| −252.37 | −54.33 |

|
| +114.88 | −60.30 |

|

| −130.00 | −126.47 |

|
| −90.00 | −14.41 |

|
| −248.11 | −55.48 |

|
Table 3. Diffusion coefficients of mobile defects for BCZYYb [3].

| Ek | Dk (500 ∘C) | Dk (700 ∘C) | |
|---|---|---|---|---|
| (m2 s−1) | (kJ mol−1) | (m2 s−1) | (m2 s−1) | |

|

| 42.65 |

|

|

|

| 59.70 |

|

|

|

| 8.40 |

|

|
The defect production rates (mol m−2 s−1) on the BCZYYb surface can be represented as


where the reaction rates of progress are evaluated as


The forward and backward rate expressions are denoted as  and
and  , which are related to the equilibrium constants as
  . In other words, the reactions are microscopically reversible.
Virtually all models use rate expressions (e.g. Butler–Volmer) for charge-transfer reactions. However, there is very little understanding about defect-incorporation rates with protonic-ceramic electrolytes. Most models assume that the defect incorporation reactions are equilibrated, which enables the defect concentration as gas-electrolyte interfaces to be evaluated thermodynamically using an equilibrium constant. The needed thermodynamic properties (changes in enthalpy and entropy,  and
and  ) can be derived, or at least estimated, from measured conductivities [3]. Using the thermodynamic data shown in table 2, table 4 lists equilibrium defect concentrations for BCZYYb at 600 ∘C and atmospheric pressure for two different gas compositions.
Table 4. Selected equilibrium lattice-scale defect concentrations in BCZYYb at 600 ∘C and atmospheric pressure.
97%  , 3% , 3% 
| 80%  , 20% , 20% 
| |
|---|---|---|
![$[\textrm{OH}_{\textrm{O}}^{\bullet}]_{\textrm{L}}^{\textrm{eq}}$](https://content.cld.iop.org/journals/2515-7655/4/1/014002/revision2/jpenergyac3729ieqn93.gif)
|

|

|
![$[\textrm{V}_{\textrm{O}}^{\bullet\bullet}]_{\textrm{L}}^{\textrm{eq}}$](https://content.cld.iop.org/journals/2515-7655/4/1/014002/revision2/jpenergyac3729ieqn96.gif)
|
|

|
![$[\textrm{O}_{\textrm{O}}^{\bullet}]_{\textrm{L}}^{\textrm{eq}}$](https://content.cld.iop.org/journals/2515-7655/4/1/014002/revision2/jpenergyac3729ieqn99.gif)
|
|

|
![$[\textrm{O}_{\textrm{O}}^{\times}]_{\textrm{L}}^{\textrm{eq}}$](https://content.cld.iop.org/journals/2515-7655/4/1/014002/revision2/jpenergyac3729ieqn102.gif)
|

|

|
![$[(\textrm{X}_{\textrm{B}}^{^{\prime}}-\textrm{O}_{\textrm{O}}^{\bullet})]_{\textrm{L}}^{\textrm{eq}}$](https://content.cld.iop.org/journals/2515-7655/4/1/014002/revision2/jpenergyac3729ieqn105.gif)
|

|
|
Despite the typical equilibrium assumption, there is evidence for defect-incorporation rate limitations (cf [22]). The present study considers the potential effects of defect-incorporation kinetics on the faradaic efficiency. Unfortunately, there are no available experimental data with which to evaluate the defect incorporation rates. Thus, somewhat arbitrarily for the purposes of estimating possible effects, the same rate coefficient kf is used to express the forward rate for all the defect-incorporation reactions (i.e.  ,
,  ,
,  , and
, and  ) at the gas-BCZYYb interfaces. It should be noted that the value of kf considers both the actual defect reaction rates and the effective BCZYYb surface exposed to the gas-phase environment. Additionally, each
  may have very different units for each defect reaction. In any case, because the reactions are microscopically reversible, as kf becomes sufficiently large, the steady-state defect concentrations resulting from the defect-incorporation reactions alone will asymptotically reach the equilibrium state. Experiments such as conductivity-relaxation measurements could provide needed kinetics for the defect incorporation rates.
2.4. Reduced cerium polaron
In materials such as BCZYYb under extremely highly reducing conditions, it might be possible to form a reduced-cerium polaron  . In materials such as gadolinium-doped ceria, reduced-cerium polarons surely introduce n-type conductivity under reducing conditions [29, 30]. If this would occur in BCZYYb, some n-type electronic conductivity would likely affect the faradaic efficiency. However, based on single-atmosphere BCZYYb conductivity measurements in moist reducing conditions (figure 3), there is no evidence of n-type conductivity [3]. The present BCZYYb models are consistent with these data [3]. Moreover, because the hydrogen-collection side remains moist, the gas-phase H2O dissociation should produce sufficient oxygen so as to avoid extremely reducing conditions. Consequently, the present electrolysis models neglect the possibility that reduced-cerium polarons could be present. Nevertheless, there is some possibly contradictory evidence. Studying BZY and BCZY with 10% of cerium (BCZY18), Dippon et al [31] reported no significant electronic leakage. However, they reported that increasing the cerium content to 20% (BCZY27) was sufficient to observe electronic leakage. In principle, models could be extended to include the possible effects of reduced-cerium small polarons. However, doing so would require new experimental data from which to determine needed thermodynamic and transport parameters.
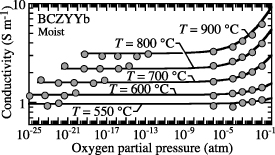
Figure 3. Comparison of model predictions (solid lines) with the measured conductivities (filled circles) at 550, 600, 700, 800, and 900 ∘C as functions of  under moist gas-phase environment (
 atm) [3]. The gas-phase environment is a mixture of
  ,
,  ,
,  , and Ar, producing a wide range of oxygen partial pressures. The measurements were reported by Somekawa et al [27, 28]. Reproduced from [3]. © 2018 The Electrochemical Society. All rights reserved.
Download figure:
Standard image High-resolution image2.5. Model tuning and validation
As in most models, there are numerous parameters that cannot be measured directly and thus demand some empiricism. The present model is calibrated against recently published data from a button cell operating under fuel-cell polarization [26]. Figure 4 illustrates the comparison between measured and modeled polarization. Table 5 lists relevant parameters that are used in the present model.
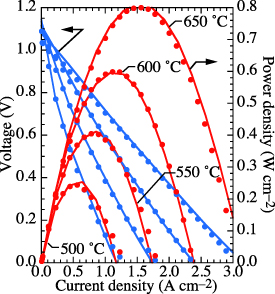
Figure 4. Comparison of measured and modeled atmospheric fuel-cell button-cell voltage and power density as functions of current density [26]. The gas-phase compositions are moist  on the negatrode (anode) side and moist air on the positrode (cathode) side.
Download figure:
Standard image High-resolution imageTable 5. Parameters for modeling the MEA structure.
| Parameters | Value | Units |
|---|---|---|
| Negatrode (fuel-cell anode, electrolysis cathode) | ||
| Thickness (La) | 500 | µm |
| Porosity (φg) | 0.35 | |
| Ni volume fraction (φNi) | 0.35 | |
| BCZYYb volume fraction (φBCZYYb) | 0.30 | |
| Tortuosity (τg) | 4.50 | |
| Ni particle radius (rNi) | 0.50 | µm |
| BCZYYb particle radius (rBCZYYb) | 0.50 | µm |
| Specific catalyst area (As) |

| cm−1 |
Exchange current factor ( ) ) |

| A cm−1 |
Exchange current activation energy ( ) ) | 82.60 | kJ mol−1 |
| Anodic symmetry factor (αa) | 0.30 | |
| Cathodic symmetry factor (αc) | 0.70 | |
| Positrode (fuel-cell cathode, electrolysis anode) | ||
| Thickness (Lc) | 20 | µm |
| Porosity (φg) | 0.35 | |
| BCFZY volume fraction (φBCFZY) | 0.65 | |
| Tortuosity (τg) | 4.50 | |
| BCFZY particle radius (rBCFZY) | 0.50 | µm |
Exchange current factor ( ) ) |

| A cm−1 |
| Exchange current activation energy (E) | 43.36 | kJ mol−1 |
| Anodic symmetry factor (αa) | 0.80 | |
| Cathodic symmetry factor (αc) | 0.20 | |
| Dense electrolyte membrane | ||
| Thickness (Lel) | 15 | µm |
3. Predicted faradaic efficiencies
The button-cell model is used to predict faradaic efficiencies for wide ranges of operating conditions.
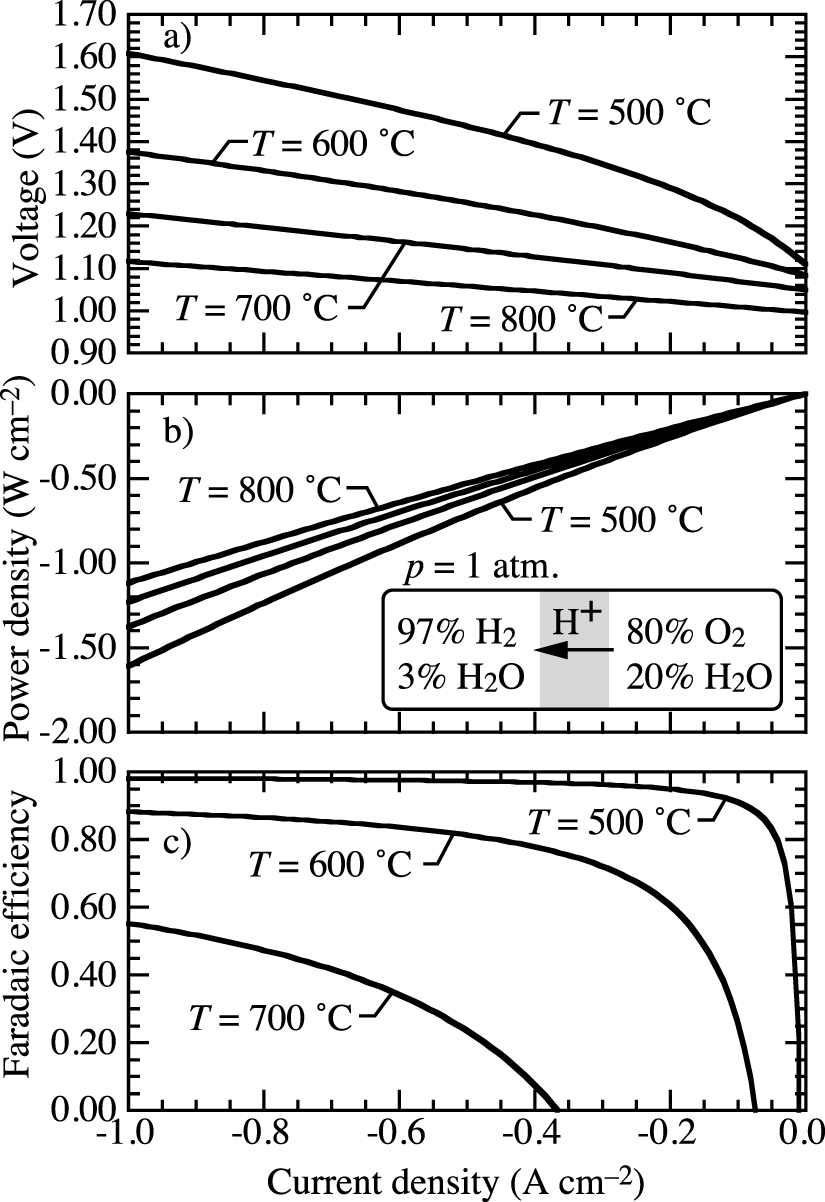
3.1. Temperature effects
Figure 5 shows predicted cell voltage, power density, and faradaic efficiency as functions of the current density at four operating temperatures (500 ∘C, 600 ∘C, 700 ∘C, and 800 ∘C). The gas-phase compositions are 97%  and 3%
  within the hydrogen-collection chamber (negatrode side) and 80%
  and 20%
  within the steam-feed chamber (positrode side). The gas-phase pressures in both chambers are maintained to be atmospheric. As the operating temperature increases, figure 5 shows that the faradaic efficiencies decrease greatly, demanding much less voltage and power to operate the cell.
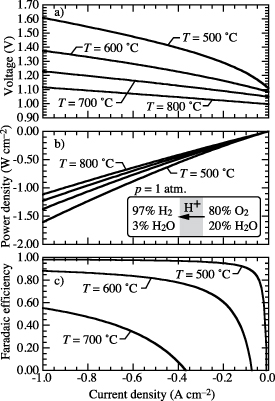
Figure 5. Predicted cell voltage, power density, and faradaic efficiency as functions of current density at four temperatures.
Download figure:
Standard image High-resolution imageAs the temperature increases, the equilibrium proton concentration ![$[\textrm{OH}_{\textrm{O}}^\bullet]$](https://content.cld.iop.org/journals/2515-7655/4/1/014002/revision2/jpenergyac3729ieqn130.gif) and transference number decrease while the concentrations and transference number of
and transference number decrease while the concentrations and transference number of  and
and  increase, both contributing to much lower faradaic efficiency. At higher temperatures the charge-transfer rates and the electrolyte membrane conductivity increase, serving to reduce the activation and ohmic polarization losses. Thus, significantly lower voltage and power are required to achieve the same defect fluxes though the cell.
3.2. Pressure effects
Figure 6 illustrates the effects of gas-phase pressure on faradaic efficiency. The cell is operating at a fixed temperature of  C, but with pressures ranging as
  atm. The gas-phase compositions are 97%
  and 3%
  within the hydrogen-collection chamber and 80%
  and 20%
  within the steam-feed chamber. Increasing pressure serves to increase faradaic efficiency. However, increased pressure requires slightly higher cell voltage and electric power. Compared to the effects of temperature, the effects of operating pressure are much weaker.

Figure 6. Predicted cell voltage, power density, and faradaic efficiency as functions of imposed current density at four operating pressures.
Download figure:
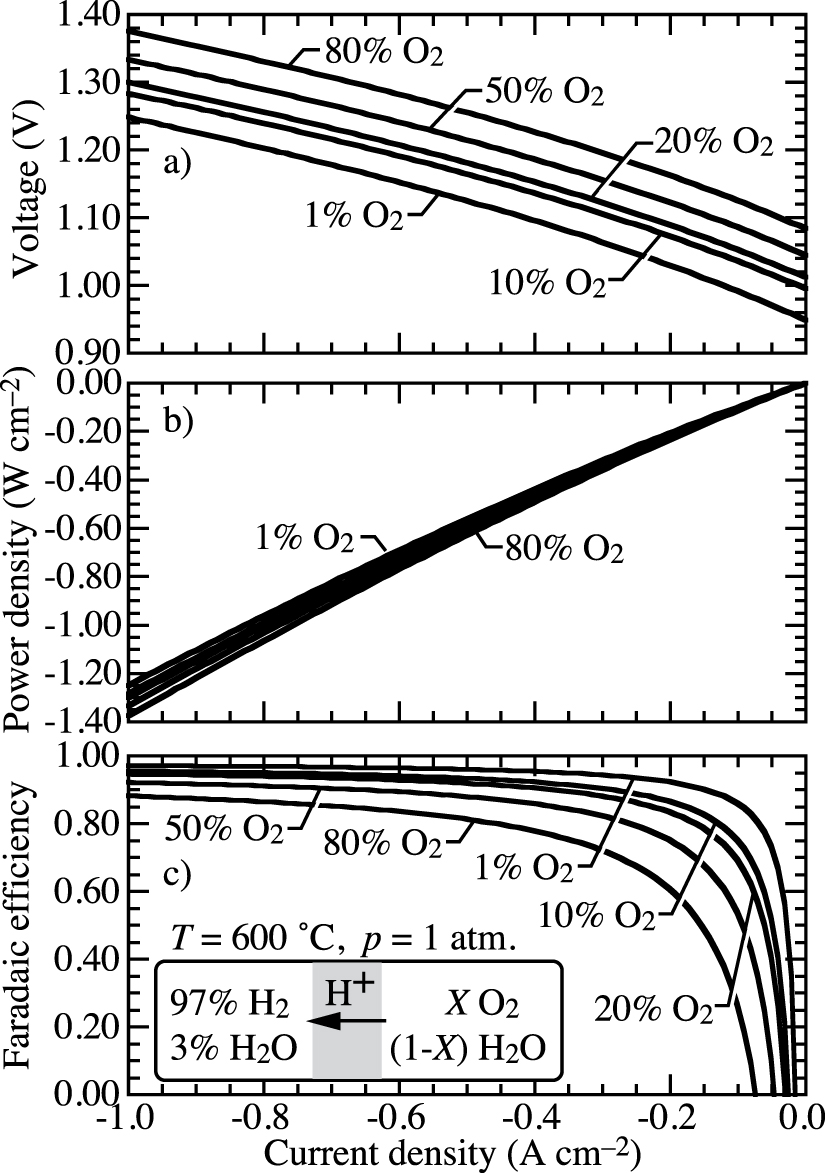
Standard image High-resolution image3.3.
 - composition


In practical electrolysis technology (e.g. planar or tubular configurations), depending on flow rates, the feed steam can be significantly diluted with the O2 product. Such dilution can significantly affect the faradaic efficiency. Figure 7 illustrates the effects of the gas-phase composition within the steam-feed chamber. In this case, the cell temperature and pressure are fixed as  C and p = 1.0 atm. The composition of the hydrogen-collection chamber is fixed as 97%
  and 3%
  . The steam-side oxygen concentration varies between 1% and 80%, with the balance being H2O.
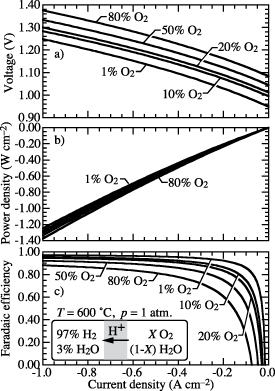
Figure 7. Predicted cell voltage, power density, and faradaic efficiency as functions of imposed current density. The gas-phase composition in the hydrogen-collection chamber is fixed at 97%  and 3%
  . Within the steam chamber, the O2 concentration varies, with the balance being H2O. The gas-phase pressures are fixed at p = 1 atm.
Download figure:
Standard image High-resolution imageAs the  concentration increases, the small-polaron concentration ([
 ]) at the positrode-electrolyte interface increases, thus increasing the
  concentration gradient through the electrolyte membrane and increasing electronic current via
  flux. This electronic leakage reduces faradaic efficiency. Figure 7 shows lower faradaic efficiency as the
  increases. Figure 7 also shows that as O2 concentration increases more power is required to maintain a certain current density.
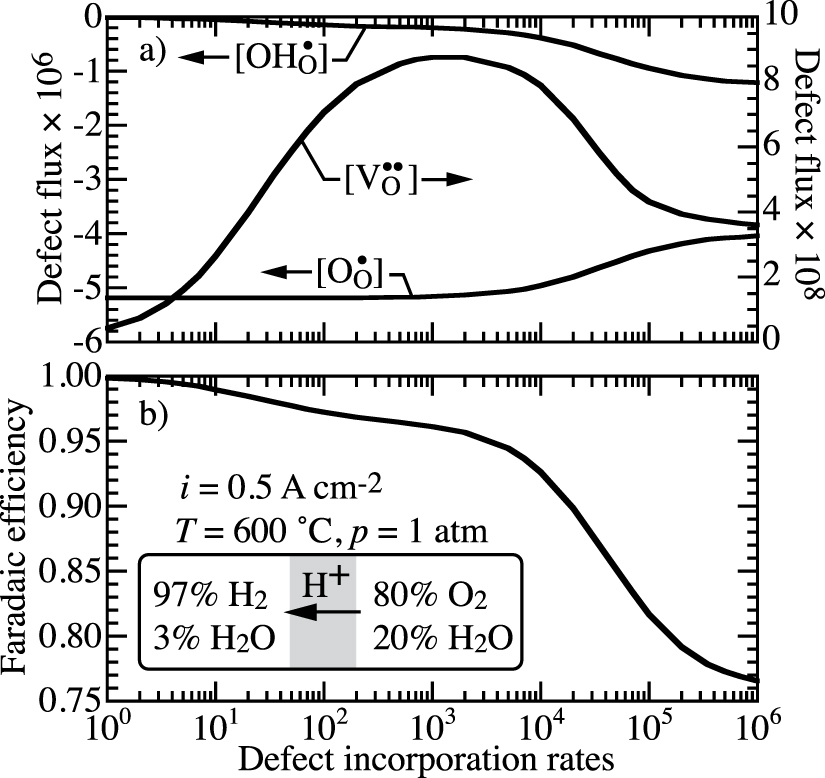
3.4. Defect incorporation rates
Figure 8 shows fluxes of three mobile defects  ,
,  and
and  through the dense BCZYYb electrolyte membrane and the faradaic efficiency as functions of the defect-incorporation rate kf at the BCZYYb surfaces. The gas composition is fixed as 97%
  and 3%
  in the hydrogen compartment and 80%
  and 20%
  in the steam compartment. The pressure is p = 1 atm and the temperature is
  C. The imposed current density is fixed as
  A cm−2. At the very low defect-incorporation rate of
  , figure 8 shows that the proton flux
  through the electrolyte membrane dominates and the polaron flux
  and oxygen vacancy flux
  are negligibly small. Thus the faradaic efficiency for
  is about 99.8% and the electrolyte membrane behaves essentially as a pure proton-conducting membrane. As kf increases, the proton flux
  decreases, but the polaron flux
  increases. Thus, the faradaic efficiency decreases. At the highest rate
  , the faradaic efficiency drops to about 76.6%.

Figure 8. Defect fluxes (mol cm−2 s−1) through the electrolyte membrane and faradaic efficiency as functions of the defect-incorporation reaction rates. The current density is fixed at 0.5 A cm−2.
Download figure:
Standard image High-resolution imageAs indicated in equations (5) and (8), the charge-transfer reaction at the positrode-electrolyte interface in the electrolysis mode acts to split  to produce
  into the electrolyte, while the charge-transfer reaction at the negatrode-electrolyte interface (i.e. equation (5)) consumes
  from the electrolyte to produce
  into the negatrode. Thus, the current charge-transfer models only involve the
  entering (producing) or leaving (consuming) the electrolyte membrane (at the electrode-electrolyte interfaces), and
  and
and  can only be produced on the surface of the BCZYYb electrolyte membrane exposed to the gas environment through the defect reactions. As long as the surface area of the dense electrolyte membrane is small or the defect reaction rate is small (i.e. low value of kf) , the transport of
  and
and  through the electrolyte membrane is blocked at the electrode-electrolyte interfaces, leading to almost pure proton conduction through the electrolyte membrane, and therefore, high faradaic efficiency of the cell.
On the BCZYYb electrolyte membrane surface exposed to  -
- environment (positrode side), the
  incorporation reaction (
 ) produces
  into the BCZYYb electrolyte membrane. The
  incorporation reaction (
 ) and
) and  incorporation reaction (
 ) consume
  within the electrolyte to produce
  and
and  into the gas environment within the positrode. It should be noted that the net rate of
  incorporation is small compared to the
  and
and  incorporation rates as kf increases. Figure 9 shows that the defect-incorporation reactions lead to decreasing
 ![$[\textrm{OH}_{\textrm{O}}^\bullet]$](https://content.cld.iop.org/journals/2515-7655/4/1/014002/revision2/jpenergyac3729ieqn192.gif) and increasing
and increasing ![$[\textrm{O}_{\textrm{O}}^\bullet]$](https://content.cld.iop.org/journals/2515-7655/4/1/014002/revision2/jpenergyac3729ieqn193.gif) and
and ![$[\textrm{V}_{\textrm{O}}^{\bullet\bullet}]$](https://content.cld.iop.org/journals/2515-7655/4/1/014002/revision2/jpenergyac3729ieqn194.gif) on the positrode side.
on the positrode side.
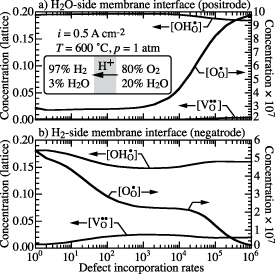
Figure 9. Defect concentrations in the BCZYYb electrolyte membrane at the positrode-electrolyte and negatrode-electrolyte interfaces as functions of defect-incorporation rates. The imposed current density is fixed at i = 0.5 A cm−2.
Download figure:
Standard image High-resolution imageOn the BCZYYb electrolyte membrane surface exposed to  -
- environment (hydrogen collection, negatrode side), the
  incorporation reaction is reversed to consume
  in the BCZYYb electrolyte membrane to produce
  into the negatrode pore volume. The
  reacts with
  to produce
  , and the
  incorporation reaction is reversed to produce
  . The
. The  produced from reversing the
  incorporation reaction can react with
  to make
  on the Ni surface within the negatrode microstructure. Figure 9 shows that
 ![$[\textrm{O}_{\textrm{O}}^\bullet]$](https://content.cld.iop.org/journals/2515-7655/4/1/014002/revision2/jpenergyac3729ieqn209.gif) decreases as kf increases, but
decreases as kf increases, but ![$[\textrm{OH}_{\textrm{O}}^\bullet]$](https://content.cld.iop.org/journals/2515-7655/4/1/014002/revision2/jpenergyac3729ieqn210.gif) and
and ![$[\textrm{V}_{\textrm{O}}^{\bullet\bullet}]$](https://content.cld.iop.org/journals/2515-7655/4/1/014002/revision2/jpenergyac3729ieqn211.gif) do not vary monotonically because of competition among the defect-incorporation reactions.
do not vary monotonically because of competition among the defect-incorporation reactions.
As illustrated in figure 9, it is clear that ![$[\textrm{O}_{\textrm{O}}^\bullet]$](https://content.cld.iop.org/journals/2515-7655/4/1/014002/revision2/jpenergyac3729ieqn212.gif) increases at the steam side, but decreases at the hydrogen side as kf increases. Thus the
increases at the steam side, but decreases at the hydrogen side as kf increases. Thus the ![$[\textrm{O}_{\textrm{O}}^\bullet]$](https://content.cld.iop.org/journals/2515-7655/4/1/014002/revision2/jpenergyac3729ieqn213.gif) gradient across the BCZYYb membrane increases, leading to increasing
gradient across the BCZYYb membrane increases, leading to increasing  flux
flux  , but lower proton flux
  , decreasing faradaic efficiency as illustrated in figure 8.
Figure 10 shows faradaic efficiency as a function of current density with fixed defect-incorporation reaction rates on the BCZYYb surfaces. As the current density increases in electrolysis mode, the proton fluxes from the charge-transfer processes increase while the defect reaction rates on the BCZYYb surface are fixed. Thus, the faradaic efficiency increases as the current density increases. Figure 10 also compares the faradaic efficiency with defect-incorporation forward rates specified as  , and 106. Consistent with figure 8, the faradaic efficiency decreases as kf increases at the same current density.
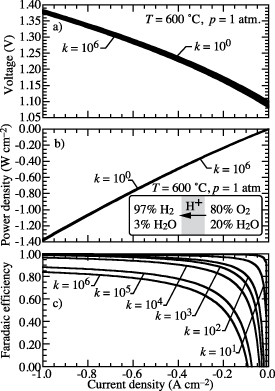
Figure 10. Predicted cell voltage, power density, and faradaic efficiency as functions of current density. The defect-incorporation forward rate constant is specified as  , and 106. The gas-phase composition is 97%
  and 3%
  on the hydrogen-collection side and 80%
  and 20%
  on the steam-feed side. The operating temperature is fixed at 600 ∘C and the pressure is atmospheric.
Download figure:
Standard image High-resolution imageFigure 10 shows that the cell voltage and power drop slightly at the same current density as kf increases. Since the small polaron  has higher mobility than that of the proton
  , the higher
  flux at higher kf leads generally to higher electronic conductivity through the BCZYYb membrane, and hence lower cell voltage.
3.5. Energy efficiency
Faradaic efficiency is certainly a valuable measure of electrolysis performance. But it is not the only useful measure. The energy efficiency is a more useful measure of economic effectiveness. Energy efficiency is evaluated as

where  is the lower heating value of the produced H2 and
  is the thermal-neutral voltage. As equation (19) shows, the faradaic efficiency and energy efficiency are related through the thermal-neutral voltage. In practice the energy efficiency provides a measure of the electricity cost compared to the value of the produced hydrogen.
Especially at low temperature the energy efficiency is qualitatively different from the faradaic efficiency (figure 11). Figures 5–10 show the cell voltage Ecell required to maintain a certain current density depends on operating conditions. Equation (19) shows how the cell voltage affects the relationship between energy efficiency and faradaic efficiency.
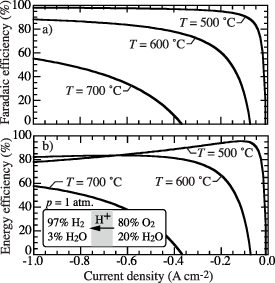
Figure 11. Comparison of faradaic and energy efficiencies as functions of current density and temperature.
Download figure:
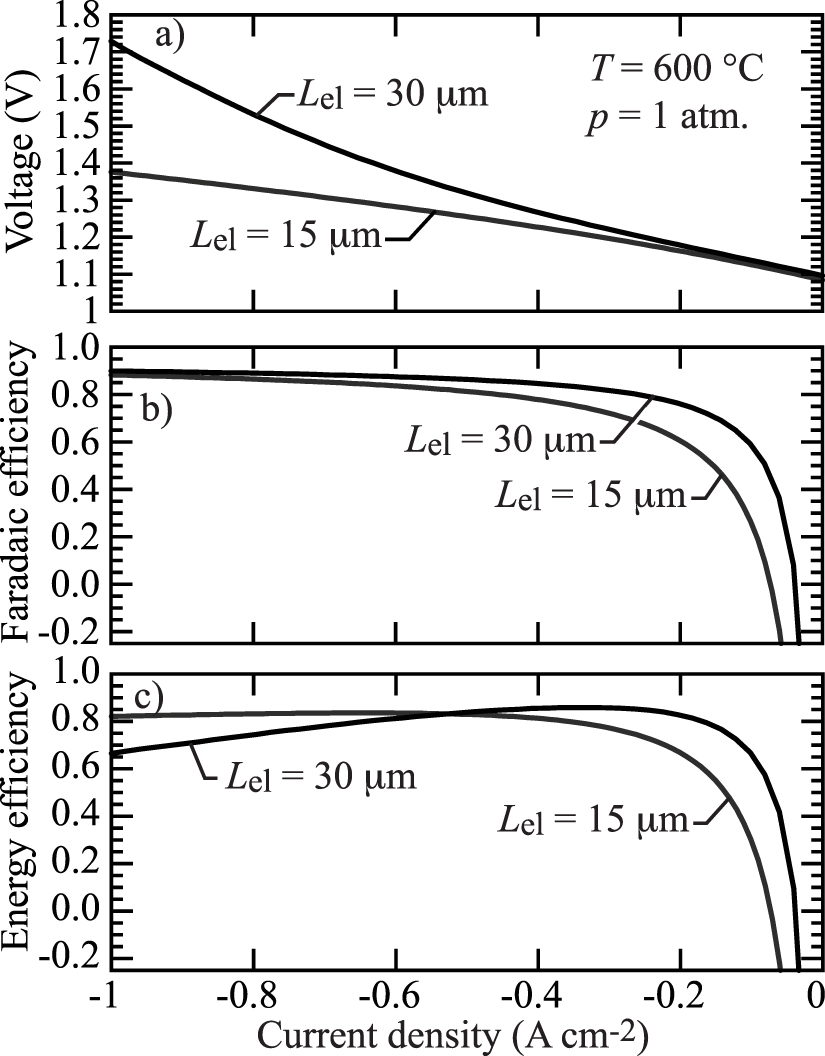
Standard image High-resolution image3.6. Effects of the electrolyte membrane thickness
Figure 12 illustrates the predicted effects of electrolyte membrane thickness on the operating cell voltage, faradaic efficiency, and energy efficiency. The gas compositions are fixed at 97%  and 3%
  in the hydrogen compartment and 80%
  and 20%
  in the steam compartment. The gas-phase pressure is atmospheric and the temperature is 600 ∘C. Two electrolyte membrane thicknesses are considered:
  m and
m and  m .
m .
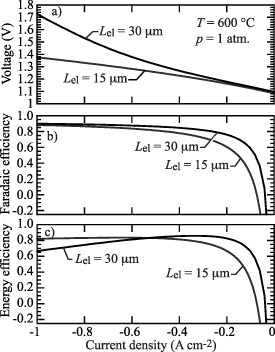
Figure 12. Comparison of cell voltage, faradaic and energy efficiencies as functions of current density at two electrolyte membrane thicknesses:  m and
m and  m.
m.
Download figure:
Standard image High-resolution imageFigure 12(a) shows that the operating cell potentials for  m are substantially greater than those for
  m, especially at high current density. Increasing the electrolyte membrane thickness affects the defect concentration profiles and transport through the membrane, thus affecting the ohmic polarization and also the charge-transfer rates at the electrode-electrolyte interfaces.
Figure 12(b) also shows that increasing the membrane thickness tends to increase the faradaic efficiency, particularly at low current density. At high current density the faradaic efficiency improvement is small. As illustrated in figure 12(c), the energy efficiency is qualitatively different from the faradaic efficiency. At low current density, the energy efficiency is higher for the thicker membrane. At higher current density, the thinner membrane has higher energy efficiency.
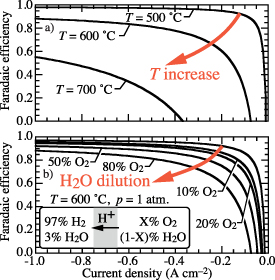
4. Current-density dependencies
Based on the definition of faradaic efficiency and the electrochemical properties of mixed-conducting electrolytes, the functional form of the faradaic efficiency, especially at low current density, must behave qualitatively as illustrated in figure 1. That is, faradaic efficiency increases as electrolysis current density increases. Nevertheless, there are published experimental observations that show the opposite [8–12].
Vøllestad et al [10] discuss the possibility that high overpotentials may tend to reduce faradaic efficiency at high current density. The present model assumes that gas-phase partial pressures represent the activities in the evaluation of reaction rates in mass-action kinetics. If, however, as Vøllestad et al suggest, high overpotentials increased the effective activity of O2, then the incorporation rate of O-site polarons would be greater than that predicted if the O2 activity were based on gas-phase oxygen partial pressure alone, leading to increased leakage current and decreased faradaic efficiency. Such behavior would depend on the electrocatalytic behavior of the positrode, with different positrode compositions leading to different observed faradaic efficiencies. Vøllestad et al call particular attention to the oxidation of Co in their Ba Gd0.8La
 Co2O
Co2O positrode. Duan et al [7] reported that higher
  and lower
  at positrode-electrolyte interfaces serve to decrease faradaic efficiency. If the effective O2 activity were higher than its partial pressure, the decreasing faradaic efficiency would be consistent with the trend shown in figure 13.
Figure 13. Possible effects on faradaic efficiency if operating conditions depend on current density.
Download figure:
Standard image High-resolution image
The present model suggests that observed faradaic efficiencies could be caused by unmeasured variations in cell operating conditions as functions of current density. Figure 13 shows the possible effects of temperature (figure 5) and steam-side dilution (figure 7) on predicted faradaic efficiency. The overlaid red arrows indicate the possibility that as temperature increases or steam dilution increases, faradaic efficiency decreases. As current density increases, the ohmic heating within the electrolysis cell certainly increases, tending to raise temperature. Similarly, as current density increases, the tendency to increase steam-side dilution with O2 increases. There are essentially no published papers that report sufficient information about experimental conditions to determine the extent of cell-temperature of steam-dilution variations. Thus, it is certainly plausible that reports of faradaic efficiency decreasing as a function of increasing imposed current are the result of unobserved operating conditions changing. To confirm, or refute, this behavior, the actual cell temperature (not the furnace temperature) must be measured. Similarly, the gas-phase compositions must be measured at the interfaces with the cell.
5. Summary and conclusions
This paper develops and exercises a physics-based model to characterize the behavior of electrolysis-cell faradaic efficiency as functions of temperature, pressure, gas compositions, etc. To be concrete, the model is based upon a Ni-BCZYYb BCZYYb
 BCFZY membrane-electrode structure. The model assumes that the electronic flux through the membrane is in the form of a positively charged small polaron. The model is developed and calibrated using measured material properties and polarization behavior,
The faradaic efficiency has a characteristic shape as a function of applied current density. Near open circuit, the faradaic efficiency is low, even negative. As the imposed current density increases the faradaic efficiency also increases. Although the qualitative behavior remains, the quantitative behavior of the faradaic efficiency depends on temperature, pressure, and gas-phase compositions.
Although the model predicts and interprets the behavior of faradaic efficiency, there is conflicting literature on the functional behavior. Even for the same, or very similar materials, some researchers report that faradaic efficiency increases as imposed current density increases [3–7]. This is consistent with the present model. However, other papers report just the opposite behavior. That is, the faradaic efficiency is high near open circuit and decreases as imposed current density increases [8–12]. For the same materials and operating conditions, these opposite behaviors cannot both be correct.
The model suggests a possible explanation for the apparently contradictory behavior of measured faradaic efficiency. As imposed current density increases, the ohmic heating within the membrane and charge-transfer polarizations at the electrode-electrolyte interfaces increase, tending to increase the cell temperature. As temperature increases, faradaic efficiency decreases (cf figures 5 and 13). If the cell temperature was not directly measured it could be significantly higher than the furnace setpoint temperature. If this was the case and the cell temperature was assumed to be the furnace temperature, the faradaic efficiency would appear to decrease as current density increased. Similar misinterpretations could occur if the gas-phase compositions were changing as functions of current density. If gas feed flow rates were small, composition variations would be possible. No published papers provide sufficient experimental and operational details from which these possible behaviors can be quantitatively assessed. Thus, although the model-based interpretations are reasonable, they cannot be independently confirmed.
The present model neglects the possibility that n-type electronic conductivity can be induced in the form of reduced-cerium polarons under extremely reducing conditions. Based on measured conductivity for BCZYYb, there is no evidence to suggest any n-type conductivity even a oxygen pressures as low as  atm (cf figure 3). However, Dippon et al [31] find that cerium content in BCZY materials can introduce electronic conductivity. Thus, the possibility of reduced-cerium polarons remains an open issue, with potentially significant impact on faradaic efficiency.
Inasmuch as faradaic efficiency is a practically useful and widely reported measure of electrolysis performance, its qualitative and quantitative interpretation is important. For a particular electrolysis cell using the same materials, cell architecture, and operating conditions, the behavior of the faradaic efficiency must be unique. The present model provides quantitative insight that assists interpretation of faradaic efficiency.
Acknowledgments
This research was supported by the Colorado School of Mines Foundation via the Angel Research Fund and by ARPA-E via the REFUEL program. Mr Joshua Persky (Low-Emissions Resources Corp., LERC) provided insightful observations about measured temperature variations associated with current density in tubular electrolysis cells. We gratefully acknowledge insightful discussions with Dr Einar Vøllestad (SINTEF, Oslo) on alternative interpretations of faradaic-efficiency behaviors. We also gratefully acknowledge insightful and ongoing discussions about protonic ceramics materials and electrolysis with our colleagues Dr Grover Coors (Hydrogène Hélix, SAS) and Profs. Robert Braun and Ryan O'Hayre.
Data availability statement
All data that support the findings of this study are included within the article (and any supplementary files).