

Abstract
An important challenge when attempting to identify the role of microstructure on the properties of doped energy materials is to distinguish the behaviour of each grain boundary. In this paper we describe our recent work using atomistic simulations to investigate the structure, composition and oxygen transport of gadolinium doped cerium dioxide tilt grain boundaries. We find that energy minimisation can be systematically employed to screen grain boundary structures and dopant segregation. When dopants are distributed equally across grains, molecular dynamics simulations reveal oxygen vacancies reside near dopants, resulting in higher oxygen diffusivity. Once the dopants accumulate at the grain boundaries these grain boundaries become saturated with oxygen vacancies. We see fast oxygen diffusion within the grain boundary plane, although the depletion layer, as shown via the electrostatic potential appears to block transport across the grain boundary. However, this is highly dependent on the grain boundary structure as we find striking differences of the electrostatic potential and the segregation behaviour between each of interface studied.
Export citation and abstract BibTeX RIS

Original content from this work may be used under the terms of the Creative Commons Attribution 3.0 licence. Any further distribution of this work must maintain attribution to the author(s) and the title of the work, journal citation and DOI.
1. Introduction
Fluorite structured ceramic materials, including ceria (CeO2) and doped zirconia (ZrO2), have attracted considerable attention for energy applications in the last three decades due to their high ionic conductivity [1, 2]. These ionic conductors find use as solid electrolytes in solid state electrochemical devices such as solid oxide fuel cells (SOFC) [3–5]. However the widespread use of such devices is hindered by material issues relating to high operating temperatures [6]. Lanthanide doped ceria materials, i.e. Ln3+ ions like gadolinium, exhibit excellent oxygen conductivity due to the introduction of excess ionic carriers (oxygen vacancies). These doped materials, particularly gadolinium doped ceria (GDC), allow for slower material degradation as the diffusion of oxygen occurs at lower operating temperatures (600 °C–800 °C) [6–8], with further improvement obtained through a reduction of particle size [9, 10]. Thus demonstrating that the microstructure plays a key role in the material properties.
Polycrystalline GDC, similar to other doped oxides, shows defect segregation to the grain boundaries (GBs), which has been observed experimentally and is detrimental to material properties [11, 12]. As defects, particularly dopants, segregate and accumulate at the GBs, they may contribute to an increase in GB resistance to the transport of oxygen. This results in a reduction in the conductivity of polycrystals compared to single crystals [12–15]. It is therefore critically important to understand and ultimately control the processes that occur at these interfaces and how they affect the materials properties.
The degradation associated with dopant segregation at GBs in GDC has been studied theoretically to elucidate the atomistic details relating to the mechanism [16]. A hybrid Monte Carlo-molecular dynamics (MD) revealed that Gd3+ segregation to the GBs is a thermodynamically favourable process [17], and driven by a high oxygen vacancy concentration at the GBs. However, this study was only limited to the Σ5(310)/[001] tilt GB in GDC. Dholabhai et al combined MD and density functional theory to study three symmetric GDC GBs, namely the Σ3(111)/[110] tilt GB, Σ5(310)/[001] tilt GB and Σ5(001) θ = 36.87◦ twist GB [18], finding that GBs have different segregation behaviour, and that the stability of dopant-vacancy clusters at GBs was heavily dependent on the local structure and dopant arrangements at the GBs.
This work builds on our previous work on dopants in UO2 [19] but has been expanded to consider the effects of dopant distribution, dopant concentration and given the importance of space charge effects in CeO2 [9, 14, 20, 21], the change in electrostatic potential at GBs. We present a survey of different coincidence site lattice (CSL) GBs in stoichiometric ceria and GDC with gadolinium concentration between 10% and 30%. We have considered multiple dopant distribution schemes, specifically, a uniform distribution symptomatic of freshly made devices, and a configuration with full Gd3+ segregation at the GB symptomatic of degraded devices. The stability, dopant and oxygen vacancy segregations, electrostatic potential along with the oxygen diffusivity of these GBs are evaluated as a function of temperature and dopant concentration.
2. Methodology
Six low index tilt grain boundaries of CeO2 were constructed using the METADISE code [22] with a classical potential model based on rigid ions and partial charges according to

where  is the depth of the potential energy well,
  is the a function of the slope of the potential energy well,
  is the distance of separation,
  is the equilibrium distance between species i and j, and
  relates to the potential energy well and describes the repulsion at very short distances between species i and j. The parameters used for each species, reported in Sayle et al, are shown in table 1 [23].
Table 1. Potential model parameters.
| Species |
 (eV) (eV) |
 (Å−2) (Å−2) |
 (Å) (Å) |
 (eV Å12) (eV Å12)
|
|---|---|---|---|---|
| Ce2.4-O−1.2 | 0.098 352 | 1.848 592 | 2.930 147 | 1 |
| Gd1.8-O−1.2 | 0.028 451 | 2.057 296 | 3.074 956 | 3 |
| O−1.2-O−1.2 | 0.041 730 | 1.886 824 | 3.189 367 | 22 |
This model has been shown to accurately reproduce the structural and elastic properties of CeO2 and UO2 [24, 25]. GB structures were generated initially by taking each possible surface termination comprised of surface unit cells with no dipole perpendicular to the surface and scanning one surface relative to the other [26]. At each grid point in this scan a full surface relaxation is performed and as an extension to earlier approaches the lowest energy structures were then annealed across a wide temperature range using MD.
GB formation energies without taking temperature effects into account, were calculated according to

where EGB and EBulk are the energies of the GB and bulk simulations cells respectively and A is the area of the GB plane.
Defect incorporation energies were investigated for the six GBs using the CHAOS code [27], namely Gd3+ substitution at Ce4+ sites and oxygen vacancies (Vo). This approach employs the Mott–Littleton method to evaluate point defect energy at every site in the simulation cell. It has the advantage of including both the electrostatic and steric contributions by including a full relaxation. Defects were incorporated at every site into each boundary, which corresponds to the GB plane and extended to a depth of approximately 30 Å perpendicular to the boundary, in order to map the energetics of the defect as a function of their distance from the GB. Defects were considered to be point defects. The energies are presented with reference to the bulk defect energy which is set to 0 eV.
All MD simulations were performed using the DL_POLY code [28]. Simulations of 4 ns employed 3 dimensional periodic boundary conditions, a timestep of 1 fs, an 8.5 Å cut-off, within a temperature range of 900–3000 K, at intervals of 300 K. Equilibration was performed for 1 ns using the NPT ensemble until unit cell volume was converged. Production simulations were carried out for 3 ns using the NVT ensemble with a Nose–Hoover thermostat. All GB structures were annealed at high temperature and then cooled down to low temperature using the NPT MD ensemble. The annealing allowed for the most stable structure across the wide temperature range of each GB to form.
Figure 1 shows a schematic representation of the simulation cells and table S2 presents the size of the simulation cells for MD simulations, typically 7500 atoms. The GB is sandwiched between grain interiors (GIs) forming a layered structure and GBs are far apart to avoid interaction. The GB widths, represent the GB region either side of the GB core. The GB width is the region of the structure that contains the GB and extends until the diffusivity returns to the bulk value.
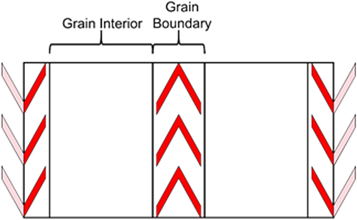
Figure 1. Schematic illustration of the model configuration for grain boundary configuration. Two grain boundaries run parallel in opposite directions.
Download figure:
Standard image High-resolution imageWe generated configurations with fully segregated Gd3+ (representing a degraded SOFC device) and configurations with Gd3+ distributed randomly (representing a freshly prepared device) for investigation with MD. Stoichiometric structures were also simulated as a control, referred to as CO. Three concentrations of Gd3+, 10%, 16% and 30% were substituted for Ce4+ cations. These percentages represent the concentration of dopants considering all Ce4+ cations in the simulation cell. Different doping schemes where studied; N_GB—Gd3+ doped CeO2 nanolayered structures with N% random substitution of Gd3+ localized within the GB regions; e.g. 10_GB represents a configuration with 10% Gd3+ randomly distributed within the GB regions. N_Rand—Gd3+ doped CeO2 nanolayered structures with N% substitution of Gd3+ randomly distributed through the entire structure, i.e. GI and GB region; e.g. 10_Rand represents a configuration with 10% Gd3+ randomly distributed within the entire structure. We note that 30_GB cannot be formed within our model as there are not enough Ce4+ cations within the GB regions to accommodate 30% Gd3+ substitution. Oxygen vacancies were introduced randomly to maintain charge neutrality throughout the entire structure, however their distribution is not a concern as their mobility is such that they reached their equilibrium distribution within the NPT MD simulation. This was confirmed by examining the evolution of the oxygen stoichiometry over time. Oxygen vacancies segregated during the early stages of the NPT simulation and this distribution persisted for the duration of the simulation. Diffusion data for O within a specified region was obtained from a regional mean squared displacement (MSD) within the region of interest according to

where  is the MSD,
  is the diffusion coefficient for oxygen, and t is time. The calculation of the MSD only takes into account those segments of atom trajectories for oxygen species that pass within the region of interest e.g. the GB.
We use the residence time τ to evaluate the average time that an oxygen atom spends in contact with each cation (Ce4+ and Gd3+) [29]. The τ was calculated from the residence time correlations function, which is defined as

where N is the number of oxygen atoms within a 3 Å radius of the cation and  is the heavyside function, which is 1 if the ith oxygen atom is in the 3 Å radius at t and 0 otherwise. An oxygen atom was only considered to have left the 3 Å radius if it did so for at least 2 ps, which allowed molecules that temporarily left then re-entered to be included in τ. Equation (2.4) is integrated to calculate τ

The electrostatic potential in one dimension across the GB was calculated according to

where  is the electric field and given by

where  is the total charge density perpendicular to the interface and
  is the permittivity of free space [30].
3. Results
3.1. Stoichiometric GB structures and potential energy surfaces
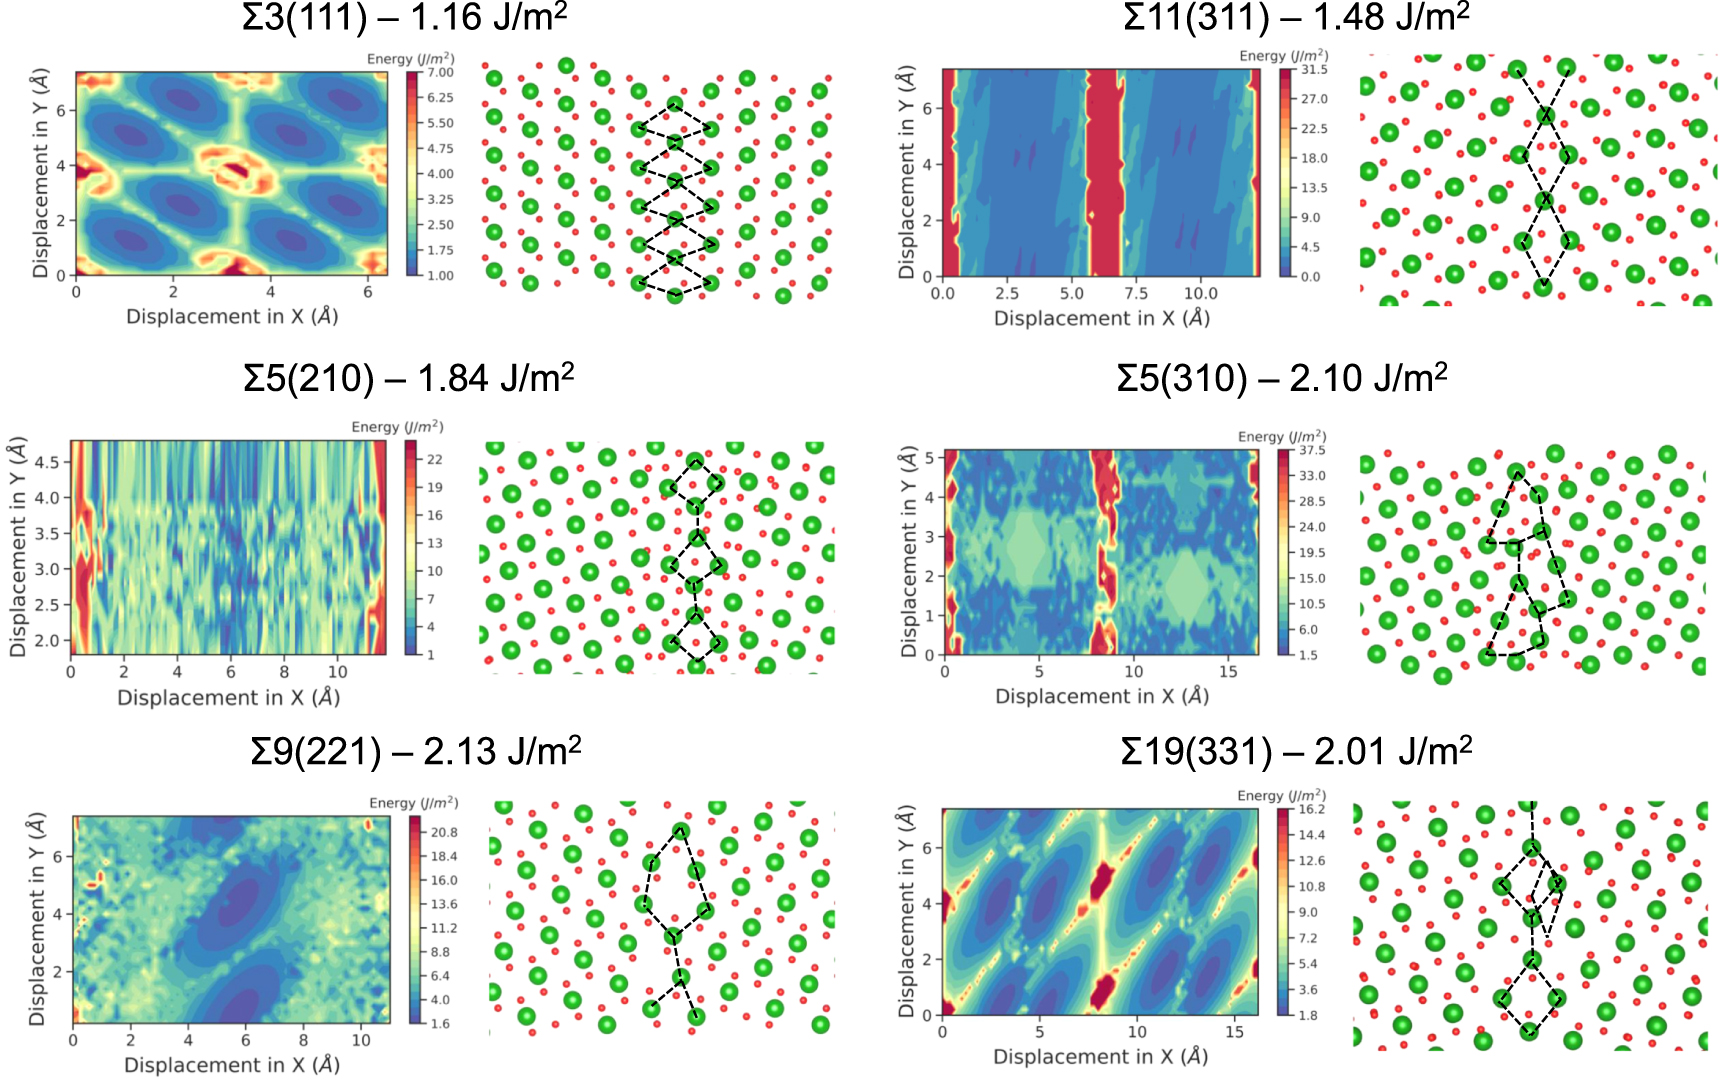
The GB structures used in this study and their scans are presented in figure 2. These were chosen from a database of different tilt GB scans generated during this study (figure 3). These six tilt GBs are low Miller index surfaces with low formation energies. The Σ3(111), Σ5(210), Σ5(310), Σ9(221), Σ11(311) and Σ19(331) boundaries have all been observed experimentally, suggesting they are low energy and are present in significant concentrations within polycrystalline fluorite samples [31–34]. The scans relate to the symmetry of the surfaces and enables us to infer the energy barriers to processes such as GB sliding and also the depth of the energy well, which reflects the likelihood of the boundary forming.

Figure 2. Potential energy surfaces and the lowest energy grain boundary configurations for each grain boundary studied. Red and green regions on the energy surface correspond to regions of high and low GB formation energy. In the structures, oxygen and cerium atoms are shown in red and green. Grain boundary energies are also shown.
Download figure:
Standard image High-resolution image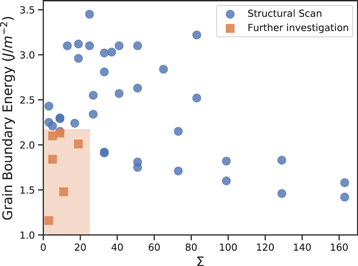
Figure 3. Grain boundary energies calculated from the grain boundary scan method outlined above. For clarity, blue dots denote GB energies calculated during the structural scan and orange dots denote the GB energies of the boundaries investigated further in this study. The high Σ values refer to (hkl) where h ≤ 9.
Download figure:
Standard image High-resolution image3.2. Dopant segregation energy at GB
Once the most stable structure of a specific GB is found, point defect segregation energies were calculated. Figure 4 shows the defect segregation energy profiles for the Σ19(331) GB as example, with the rest being included in the SI (figure S1 is available online at stacks.iop.org/JPENERGY/1/042005/mmedia). In all cases, the GB regions (defined from −15 to 15 Å with the GB core at 0 Å ) were found to be energetically favourable to accommodate both Gd3+ and oxygen vacancies (Vo) (0.15–0.2 eV per defect) , which is in agreement with previous computational work on specific GB structures [17, 18]. Although most sites are energetically favourable for a defect to segregate, some specific sites within the GB region were calculated to have slightly higher energies with respect to energies of defects located in the bulk regions outside of the GB. This behaviour implies that segregation of dopants is site dependent within a specific structure and will be missed if considering only average properties of each plane of atoms.

Figure 4. Relative defect energy profile for the Σ19(331)(A) grain boundary in CeO2 with a single point defect. The grain boundary region exists between −15 and +15 Å and the grain boundary core is at 0 Å.
Download figure:
Standard image High-resolution imageWe have also used MD simulations to evaluate the impact of temperature and dopant concentration on the energetics of Gd segregation.
In this case by comparing the N_GB models where all the dopants are in the GBs, to the N_Rand models where Gd3+ dopants are randomly distributed throughout the entire structure. The difference in configurational energy between the two N_GB and N_Rand configurations (10% and 16% concentrations) is shown in figure 5. The data indicates that the energetic contribution favours Gd3+ segregation at the GBs rather than random distribution in all models evaluated. This is in line with experimental evidence [32, 35] and is supported by our defect segregation energies, which neglect temperature (figures 4 and S1). Increasing temperature increases segregation energies until about 2700 K, beyond which the GBs start to melt.
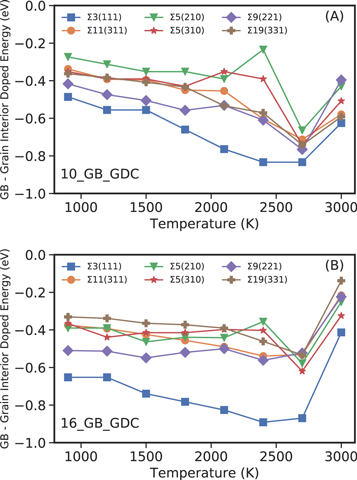
Figure 5. Energy difference between the 10_Rand and 10_GB (A) configurations and 16_Rand and 16_GB (B) configurations per Gd3+ ion.
Download figure:
Standard image High-resolution image3.3. Doped GB structure
On random introduction of Gd3+ ions over the entire simulation cell (N_Rand) the stoichiometric GB structures are retained. However, when Gd3+ was segregated within the GB regions (N_GB), there are significant structural rearrangements during the annealing (figure 6). The Σ3(111) GB undergoes a shift parallel to the GB plane with the cation arrays converging into the middle of the GB pipes. The presence of impurities promotes an alteration to the structure of the Σ5(210) with similar structural changes previously reported for stoichiometric UO2 [25], but not yet for GDC. However previous studies on Gd3+ segregation in GDC GBs are based on a static model of un-doped CeO2 [17, 18], where the composition of GDC is considered to be a dilute solution of point defects and temperature is neglected. We recognise that the concentration of Gd in the N_GB models is relatively high, thus may not be representative of many experimental studies. However our results are the first that show that high concentrations of Gd can cause an alteration in GB structure, which may impact those experimental sample of doped nanoceria with high concentration of Gd [10].

Figure 6. Time averaged 2D density profiles of the centre of mass of the cations (Ce4+/Gd3+ ) displayed every 0.5 ps at 2100 K for the stoichiometric and 16 GB Σ3(111) and Σ5(210) structures. The white dots denote the cation arrays parallel to the grain boundary plane. Patterns have been drawn to aid visibility.
Download figure:
Standard image High-resolution imageA possible explanation for these structural rearrangements is that the dopants stabilise metastable GB configurations at higher temperatures, which may be energetically inaccessible under stoichiometric conditions, although these structures may be present in the potential energy surfaces presented in figure 3. It is worth noting that the GDC material is used at relatively high temperatures (600–1000 K or higher) [36] in thermochemical devices, thus the GB structures are likely to change over time. Therefore, the segregation triggered structural transformations is likely to be important in the study of the long-term degradation behaviour of GDC.
3.4. Oxygen vacancy segregation at GBs
We have quantified the distribution of oxygen vacancies (Vo) within the doped configurations as the Vo concentration within the two regions per Å3 i.e. the GI and the GB regions (figure 7). In the N_GB, there is almost complete depletion of Vo in the GI region and complete segregation of Vo to the GB region. In all N_Rand configurations, where the Gd3+ concentration is constant with depth, there is still a small increase in the concentration of Vo per Å3 at the GBs. Thus indicating that while the dopants strongly attract oxygen vacancies, there is still a contribution from the GB. If the GB structure was not a driving force for Vo segregation, then we would have seen an equal or greater concentration of Vo in the GI region of the N_Rand configurations. In effect, in the N_Rand configurations, the GB and the dopant Gd3+ in the GI are in competition for oxygen vacancies.

Figure 7. Oxygen vacancy distribution within the grain interior (GI) and GB regions of each configuration at a representative temperature of 2100 K. The full dataset across the temperature range studied can be found in the SI.
Download figure:
Standard image High-resolution imageThe average cation-oxygen coordination number (CN) within the first coordination shell (3 Å from the cation) as a function of temperature (figures 8(C), (D)) show that Ce4+ is surrounded by a greater number of oxygen ions on average compared to Gd3+ . This is a common feature within the GB structures, doping schemes and configurations studied. This is evidence that there is a stronger interaction between Gd3+ and Vo compared to Ce4+ and Vo.

Figure 8. Residence time for oxygen with Gd and Ce cations as a function of temperature for the GB (A) and intergrain regions (B). Coordination number as a function of temperature for the GB (A) and intergrain regions (B). Data is presented for the Σ3(111) grain boundary.
Download figure:
Standard image High-resolution imageThe formation of this first nearest neighbour Gd3+ − Vo clustering has been reported in the literature [37] for bulk cerium dioxide. For the N_Rand configurations, the oxygen CN of Ce4+ , either in the GI or in the GB, decreases as the concentration of Gd3+ increases from 10 to 30%. The oxygen CN of Ce4+ in the GB region of N_GB configurations follows the same trend, although the difference between 10% and 16% Gd3+ doping is less prominent. The same pattern applies to the oxygen CN of Gd3+ in both N_Rand and N_GB configurations, which is due to the decrease of the total oxygen ions available in the simulation cells.
We also used residence time analysis, i.e. the average time spent by an oxygen atom within the first coordination sphere of a cation, to define the preferential affinity to oxygen with Ce4+ or Gd3+ . On average, we find that oxygen resides longest closer to Ce4+ than Gd3+ (figures 8(A), (B)). This supports the stronger interaction between oxygen vacancies and Gd3+. The residence time decreases with increasing temperature as the diffusion of oxygen becomes more predominant. At high temperature the residence time for both Ce4+ and Gd3+ converge to the same value. It is also evident from our data that all the GBs, i.e. extended defects, behave in a similar way, and have a marginal effect on the time oxygen resides close to a cation, i.e. for Gd3+ a point defect. Based upon these observations and our defect segregation energies (figure 4), we infer two key points. First, there is a strong interaction between Gd3+ and Vo, which causes oxygen vacancies to distribute partially due to the distribution of the Gd3+. This is not surprising given that the effective charges of Gd3+ and Vo are −1 and +2 respectively. Secondly, GBs themselves have a strong interaction with oxygen vacancies and cause some Vo to segregate to the boundary despite uniform distributions of Gd3+.
3.5. Oxygen diffusion at GBs
The presence of dopants was found to significantly increase the oxygen transport along the GB. We illustrate this by showing a typical 1 ns trajectory of 3 oxygen atoms (1 in the GB and two in the GI) for three different GB simulations, for example a time averaged density of diffusing species (oxygen) shows that in N_GB configurations, enhanced diffusion is localised to the GB, with no change in diffusion in the GI when compared with the stoichiometric structure (figures 9(A) and (B)). In contrast, in N_Rand configurations there is significant diffusion in both the GB and GI (figure 9(C)). Both observations can be rationalised by examining the oxygen vacancy distribution. N_Rand configurations have a more uniform distribution of Vo, albeit with a higher concentration in the GB, throughout the structure. This more even distribution of charge carriers facilitates diffusion throughout. In N_GB configurations Vo have all localised in the GB leaving few hopping sites in the GI, as it is for stoichiometric configurations.

Figure 9. Shows the superimposition of a snapshot of the grain boundary and the grain interior regions of (A) stoichiometric (CO), (B) 10_GB and (C) 30_Rand Σ3(111) configurations. For clarity Oxygen, Cerium and Gadolinium are shown in red, green and blue. To illustrate the effect of the grain boundary on diffusion, the full trajectory across 1 ns for a single oxygen atom has been shown for one oxygen in the grain boundary region (purple) and one in the grain interior either side of the boundary (grey and orange).
Download figure:
Standard image High-resolution imageAs the GI and the GB regions display such different behaviour, we treated the two regions separately. Considering the GB regions for all the GB configurations, our data does not show significant variation in the magnitude of the diffusivity (i.e. diffusion coefficient figures S6 and S7). As the concentration of Gd3+ increases, the diffusivity increases for all configurations.
In the N_GB configurations (where all Gd3+ are located in the GB) there is only a small concentration of oxygen vacancies in the GI. For this reason, the activation energies for Vo diffusion could not be reliably calculated in the GI regions for these configurations due to a lack of statistics. However, activation energies were able to be calculated in the GI regions of the 10, 16 and 30 N_Rand configurations, and are 0.8, 0.9 and 1.0 eV respectively. GB regions generally have a slightly increased activation energy compared with the GI (figure 10). The Σ3(111), Σ11(311), Σ5(210) and Σ9(221) N_Rand configurations have a similar but slightly larger activation energy at the GB compared with the GI regions whereas the Σ5(310) and Σ19(331) N_Rand configurations have a much larger activation energy in the GI regions compared with the GB. With the exception of the Σ19(331) GB the N_Rand configurations have lower activation energies that the N_GB configurations. This highlights that the specific local microstructure of these materials can have a large effect on transport properties. This is in line with experimental predictions that GB regions reduce the conductivity of the material.
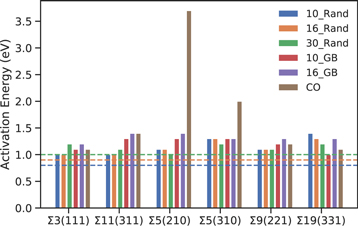
Figure 10. Activation energies for oxygen diffusion in the grain boundary regions for all the nanolayer configurations. The calculated GI activation energies for the 10_Rand, 16_Rand and 30_Rand are denoted by blue, orange and green horizontal lines.
Download figure:
Standard image High-resolution imageThe stoichiometric Σ5(210) has the highest activation energy, followed by the stoichiometric Σ5(310), indicating that these GBs may be strongly blocking oxygen transport. However upon the introduction of dopants there is a large decrease in the Ea for both GBs to values similar to all other GBs.
A possible explanation for the low diffusivity in the Σ5 boundaries relates to the cation density at the boundary compared with the interboundary region. We find in the stoichiometric Σ3, Σ9, Σ11 and Σ19 boundaries there is a slight decrease in cation density, whereas in the Σ5 boundaries there is an increase in cation density (figure 11). Upon introduction of impurities there is a decrease in the cation density at the boundary due to a slight widening of the boundary region (figures 11(b), (c)). The contribution of the cation density at the GB to the transport properties of boundaries provides a possible explanation for the strong blocking nature of the stoichiometric Σ5.
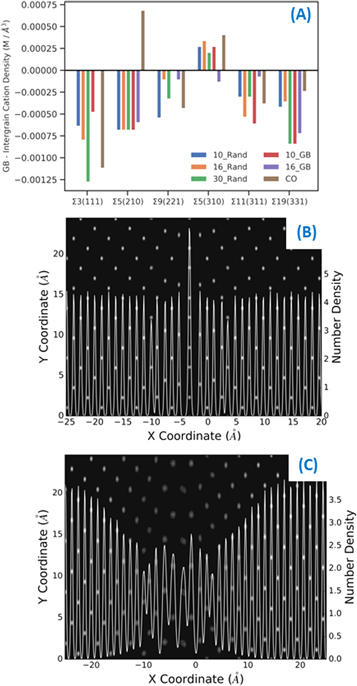
Figure 11. Cation density difference between the grain interior region and the grain boundary region for all configurations studied (A). Time averaged two dimensional density profiles of the centre of mass of both Ce4+ and Gd3+ displayed every 0.5 ps at different temperatures, overlaid with the one dimensional cation density profile for the stoichiometric (B) and 16_GB GDC (C) Σ5 (210).
Download figure:
Standard image High-resolution image3.6. Electrostatic potential at GBs
We have calculated the electrostatic potential as a function of distance either side (−15 to +15 Å) of the GB core positioned at 0 Å (figures 12, 13), for each GB within each scheme (stoichiometric CO, doped GB region (N_GB) and randomly doped GB and GI regions (N_Rand)). The lattice polarization is illustrated by the X projection of the mean electrostatic potential (figure 12—red dashed line). The sharp oscillations along X are due to the oppositely charged planes of Ce4+/Gd3+ and O2−. The polarization field is seen more clearly from a running average of the electrostatic potential, calculated across a distance equal to one lattice spacing (figure 12—blue solid line). Generally there are quite substantial differences between the profiles of different GBs. Some structures show disruption of the electrostatic potential at the core of the GB that extend into the GI; this is hardly visible in the Σ3(111) whereas it is significant in the Σ5(310).
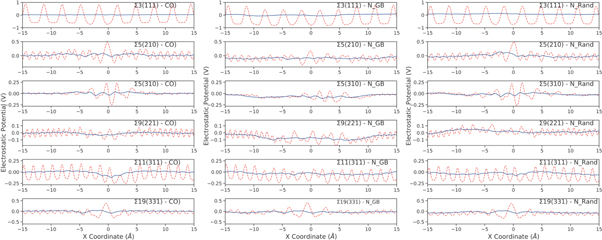
Figure 12. Red dashed lines: Poisson potentials calculated from molecular dynamics simulations as a function of distance from the grain boundary plane (−15 - + 15 Å) at 2100 K for the stoichiometric, 10_GB and 10_Rand configurations. Blue solid lines: running average potentials over one lattice spacing.
Download figure:
Standard image High-resolution imageWe find that N_GB configurations have a slightly lower potential at the boundary relative to the stoichiometric structures (figure 13), which is in contrast with the N_Rand configurations, which generally have a slightly larger potential. This is due to the distribution of oxygen vacancies within the systems. The N_Rand configurations have an constant distribution of Gd3+ throughout but an uneven distribution of Vo (i.e. the average Vo density is greater in the GI compared to the GB regions, figure 7), thus there is a greater net positive charge at the GB relative to the GI. In contrast the N_GB configurations display segregation of both Gd3+ and almost all Vo at the GBs, thus there is a reduction in charge density at the GB region relative to the GI and so the potential is smaller (figure 13).

Figure 13. Difference between the average electrostatic Poisson potential at the grain interior and at the grain boundary core for the stoichiometric CO (Blue), N_Rand (Orange) and N_GB (Green) configurations for all grain boundary structures.
Download figure:
Standard image High-resolution image
4. Discussion
We have demonstrated that we have a simple, robust approach for generating GB structures, with a high throughput computational approach by putting together all possible surface terminations, scanning each surface relative to the other and at each site performing an energy minimisation. In this way we have generated realistic models of ceria CSL tilt GBs, which are characteristic of the fluorite structure [31–34, 38–43].
All calculations, both molecular mechanics and MD, show that GBs are sinks for gadolinium and oxygen vacancy segregation (figures 4, 5 and 7), although the oxygen vacancies (Vo), segregation depends on GBs local structure. For example the Σ3(111) shows a small (0.06 eV) driving force for Vo segregation, whereas the Σ5(310) has a larger segregation energy for Vo (up to 0.5 eV). This observation agrees with the findings of Dholabhai et al, where the defect energy is found to be sensitive to the local environment, i.e. the GB [18]. The segregation of Vo was also found to be dependent on distance from the GB core by Allen et al [44] to a depth of approximately 1.5 nm. This is similar to that found from EELS, which revealed an enhanced oxygen vacancy and gadolinium concentration in first 2–4 nm from the GB and is assumed to be the effective width of the space charge layer [13]. For a information the reader can refer to more detailed papers [12, 20].
A key result is that although GBs are sinks for oxygen vacancies, dopant segregation may play a much greater role in their segregation. All N_GB configurations, where all Gd3+ was segregated in the GB regions see a complete depletion of Vo in their GI regions (figure 4), which is in line with previous experimental reports [12, 45–47]. Whereas in N_Rand configurations, where there is an equal amount of Gd3+ in the GI, a significant amount of oxygen vacancies do not segregate to the GB. We therefore speculate that as devices degrade over time and the Gd3+ concentration decreases in the GI and increases in the GBs, there will be a depletion of charge carriers in the GIs and thus an overall decrease in conductivity.
As there is accumulation of Vo in the GB, oxygen diffusion increases due to the increase of charge carriers. However, visual inspection has shown that this is limited to the GB region, hence the high oxygen diffusion remains parallel to the GB plane (figure 9). Although the oxygen diffusion in GB regions is much higher than in the GI regions, the activation energies are higher due to the energy required for an oxygen to leave the coordination sphere of an already undercoordinated cation atom. A higher activation energy for oxygen diffusion in GB was measured by Avila-Paredes et al, for heavily Gd doped [48]. The activation energies for oxygen in our GI regions (figure 9) are in line with experiments with heavily doped Gd samples (30%) having the highest Ea. As the dopant concentration decreases so does Ea [49–52]. We can comment on the blocking effect of GBs in GDC within the context of our results. Generally this blocking behaviour has been quantitatively described using the space charge layer model, which sees a positive electrostatic potential at the GB core due to segregation of oxygen vacancies and oxygen vacancy depletion (space charge layers SCL) adjacent to the core; this induces a reduction in ionic conductivity [21, 52–54]. It is energetically favourable for large quantities of Gd3+ to segregate to the GB, along with the majority of charge carriers (Vo). This depletion of charge carriers in the GIs results in the blocking effect of GBs as diffusion is limited to the GB planes (i.e. parallel to the GB plane). The simulated potential maps show this same behaviour for a number of GBs, i.e. with a positive core potential along with depletion zones.
Positive space charge potentials of 0.3 V have been obtained for polycrystalline ceria which is in good agreement with some of those calculated for our GBs [55]. Furthermore the blocking GB effects depend also on temperature and the dopant content and type [56–58]. When the temperature is high enough, the GB resistance appears to become negligible in comparison to the grain resistance, although this behaviour varies with dopant types and concentrations (usually 15 mol% regardless of the dopant type). Samples of heavily doped cerium oxides, prepared by Spark Plasma Sintering in the form of a high density (>98%) body with grain size of ∼15 nm, showed no GB blocking effect and moreover the conductivity was demonstrated to be purely ionic [10].
5. Conclusions
We have conducted simulations on two different GDC systems, namely N_GB (i.e. dopants segregated at the GBs) which is an analogue for a degraded solid electrolyte of a SOFC device, and N_Rand (i.e. dopants randomly distributed between GBs and GIs) which is an analogue for a freshly made material. We find that segregation of Gd3+ to the GBs is a thermodynamically favourable process and thus the N_Rand configurations will degrade into the N_GB configurations over time. Furthermore, as the oxygen vacancies are strongly attracted to Gd3+ the resulting high concentrations of Gd2O3 at the N_GB GBs lead to a reduction in GI oxygen transport and this transport is limited to the GBs. Counter to this, we find that a more uniform distribution of Gd3+ allows transport to occur in the GIs as well as in the GBs as oxygen vacancies can also reside close to Gd3+ dopants in the GI. Thus segregation of dopants over time is a significant factor in the blocking effect of GBs in GDC, which we evaluated in terms of electrostatic potential.
Acknowledgments
We would like acknowledge AWE and EPSRC (EP/P007821/1, EP/R010366/1, EP/R023603/1) for funding and Benjamin Morgan for useful conversations on this topic. Computations were run on Balena HPC facility at the University of Bath, the Orion computing facility at the University of Huddersfield and the ARCHER UK National Supercomputing Service (http://www.archer.ac.uk) via our membership of the UK's HEC Materials Chemistry Consortium (HEC MCC) funded by EPSRC (EP/L000202, EP/R029431).
Author contributions
ARS and MM carried out the simulations, ARS performed the data analysis, MM and SCP designed the study, ARS and MM wrote the manuscript with contributions from all authors.
Footnotes
- *
The data supporting the findings of this study are openly available at https://doi.org/10.5281/zenodo.3366185.