

Abstract
We describe the first use of range-resolved interferometric signal processing for measurement of spectral transmission. This was applied to gas sensing using tunable diode laser spectroscopy, allowing the simultaneous and independent measurement of methane concentrations in multiple gas cells. The system uses a single injection-current modulated diode laser and a single photodetector. For three gas cells, we show the ability of the system to measure methane at noise equivalent concentrations of less than 200 ppm for a 0.5 s measurement period and a potential noise equivalent concentration (1σ) of <20 ppm with 150 s averaging time. We further show that cross-talk between cells is below the experimental uncertainty for the system.
Export citation and abstract BibTeX RIS

Original content from this work may be used under the terms of the Creative Commons Attribution 4.0 license. Any further distribution of this work must maintain attribution to the author(s) and the title of the work, journal citation and DOI.
1. Introduction
The detection of methane is important in both environmental and safety contexts [1], but often requires the use of multiple individual sensors, each of which is a possible point of failure and requires individual monitoring and calibration. For example, guidelines require the placement of methane detectors on off-shore oil and gas installations at spacings of no more than 5 m [2], which can lead to the need for hundreds of individual sensors, unless sensors are carefully targeted to high risk locations. It is important to both locate and quantify gas emissions, to allow action to be taken to ensure safety of personnel and leaks to be fixed. In order to be useful in explosion prevention regimes, methane detection systems need to be able to detect methane at relevant action points such as 20% of the lower explosion limit (LEL) for the gas under test. For example, methane has an LEL of 4.9% (by volume [3]), and so a common action point in methane detection is approximately 1% by volume or 10 000 ppm (by volume) [1].
Tunable diode laser spectroscopy (TDLS) is a powerful tool for gas detection [1]. TDLS uses measurement of the optical absorption of gases such as methane across a narrow wavelength range. The injection current of a laser is ramped to produce a concomitant change in the emission wavelength of the laser. The emission wavelength is scanned across an absorption feature of a gas line and the resulting absorbance is measured. The Beer–Lambert Law [1] is then used to calculate the concentration of the gas present. At low concentrations, the Beer–Lambert Law  can be approximated using a first-order Taylor expansion as shown in equation (1), where I0 is light intensity transmitted through the cell in the absence of absorption, I is the light intensity transmitted through the cell after absorption,
  is the specific absorptivity of the gas at a given wavelength of light, L is the path length over which the light and gas interact and c is the gas concentration. The quantity cL is unitless; units are referred to as absorbance units (AU).

TDLS offers high gas specificity in wavelength regions with no overlapping absorption features, and high signal-to-noise ratios (SNRs) due to the ability to fully resolve a single gas absorption line. By choosing different central laser wavelengths, TDLS allows the measurement of various gas species, including for example methane, carbon dioxide and carbon monoxide and others [1]. Compared to other gas detection techniques, TDLS is immune to the effect of other gases such as water vapour (humidity), provided that the absorption feature is chosen with care to be separated from those of other species [1]. For example, the wavelength used in this work is known to be the location of an absorption feature of methane, well-separated from nearby transitions of water and CO2, as well as from other alkanes. In addition, the influence of temperature and pressure on the shape of the absorption feature are well understood and predictable [4]. Single-cell implementations of TDLS have been developed and commercialised but the laser and photodetection hardware make these more complex and expensive than other detection methods, such as non-dispersive infrared detection [1] or the use of pellistors for flammable gases [5].
A system that operates on the principles of TDLS but that could simultaneously measure at multiple locations using fewer or even a single laser source and/or detector would be attractive, allowing the cost and complexity of such systems to be shared across the number of sensing points needed for explosion prevention systems. Stewart et al [6] and Wei et al [7] demonstrated systems that multiplex a number of cells (demonstrated with three cells, but proposed for up to 20) illuminated by the same laser source, but each cell required its own photodetector and return fibre. Other work has been done to combine TDLS and time-division multiplexing (TDM) to interrogate three gas cells allowing measurement of 1000 ppm methane with L = 2 cm [8]. TDM allows the use of a single laser source and detector, but the performance of such systems can be limited by the quality of the pulse extinction ratio of the optical switches used in the pulse amplitude modulation [8, 9] and by the high signal bandwidths required to adequately resolve pulses. Amplitude modulated carrier wave and frequency modulated carrier wave (FMCW) [10] techniques have been developed for gas sensing. These allow higher average light intensity than pulsed systems and therefore better signal to noise ratios, yielding detection of 165 ppm of methane with L = 2.5 cm [10]. However, published implementations involving two sensing regions have used fibre delay lines of the order of 50 m in length. In addition, photoacoustic techniques using fibre optics have been used successfully to detect gas (2 ppb acetylene over L = 10 m) in multiple locations [11] but these techniques require lasers of a power too great for use in potentially explosive environments [12]. Unlike pulsed techniques, continuous-wave interferometric techniques allow multiplexing of multiple gas cells using a single laser and photo detector, while using lower peak powers that are not safety critical. Furthermore, interferometric techniques can use the heterodyne gain resulting from the interference with a strong reference to improve SNRs. Ye et al [13] modulated the frequency of acousto-optic modulators to interferometrically multiplex gas absorption measurements, achieving a sensitivity of 230 ppm acetylene with L = 3 cm, however, requiring very long fibre delay lines (>50 m) between gas cells.
Other fibre linked gas sensing techniques include those that react to changes in refractive indexes in materials coating the fibre itself as the coating reacts to the presence of the gas under test. This change in refractive index can be translated into changes in the reflective properties of Bragg gratings [14], or long period gratings [15]. Such methods could allow wide sensor deployment, where multiple locations must be simultaneously monitored, but their lack of species specificity due to the ability of other gas species to react with the coating material can be a drawback.
Here, we report the use of a lower power single mode laser of the type conventionally used in TDLS based gas sensing to measure gas intensity in three gas cells independently, using short (1–5 m) lengths of fibre as effective delay lines. Range-resolved interferometry (RRI), a recently developed interferometric technique, is used to separate the signals from each of the gas cells based on differing optical path difference (OPD) in a fibre interferometer. RRI has previously been used to monitor displacement, strain and shape via measurement of optical phase and OPD in up to 20 independent locations in fibre [16]. Here, we have developed a novel adaptation of the RRI process to allow the measurement of RRI amplitude signals as the laser centre wavelength is swept across a gas absorption feature. This enables the use of RRI for measurement of absorption intensity and thereby gas concentration in multiple locations for the first time.
2. Methods
In this letter, we combine TDLS with RRI [17], which is an interferometric signal processing technique that has previously been used in applications such as position sensing [18], vibrometry [19] and fibre optic strain [20] or shape sensing [16]. RRI is related to linear (saw tooth or triangular) frequency modulation techniques, such as frequency modulated continuous-wave LIDAR [21, 22], optical frequency domain reflectometry [23, 24] or swept-source optical coherence tomography [25, 26], but uses a sinusoidal wavelength modulation waveform that contains only a single modulation frequency component. This significantly eases the modulation requirements, removing the need for a separate sweep calibration interferometer [27] or sweep stabilization techniques [28] commonly required for linear frequency modulation, and simplifies the use of injection current modulation diode lasers, such as distributed feedback (DFB) lasers. Similar to other frequency modulated interferometry techniques, RRI can separate signals from multiple constituent interferometers that differ in their OPDs. This permits the measurement of the amplitude of the interferometric signal for each constituent interferometer. By adapting this technique, combining a slow TDLS ramp sweep with rapid sinusoidal RRI signal processing that provides the spatial multiplexing, we have been able to perform TDLS on a number of gas cells simultaneously using path length differences of the order of metres using a single laser source and single photo detector in a very simple optical setup.
We have applied RRI to three gas cells arranged in a Mach–Zehnder configuration as shown in figure 1 and used an additional wavelength scan in order to measure the absorption spectrum across the gas line for each gas cell. In these experiments we used a single mode laser diode (Eblana EP1653-7-DM) operating at a centre wavelength of 1653.7 nm with a linewidth of ≈1 MHz with a bias current of 125 mA provided by a current driver (Profile LDC 202) producing an average power of approximately 2 mW. This laser was injection-current modulated by a 49 kHz, 7 mA p–p sinusoidal waveform, resulting in a wavelength modulation of approximately 8 pm peak-to-peak (measured using a Yokogawa AQ6370C Optical Spectrum Analyser). The modulation waveform was generated by the RRI System, controlled using an Altera Cyclone IV Field programmable gate array (FPGA) processor that ensured strict synchronicity between the modulation and demodulation signals. A slower (2 Hz) saw tooth modulation of 77 mA peak-to-peak amplitude was added to the sinusoidal modulation to sweep the centre wavelength of the laser with a peak-to-peak amplitude of 0.5 nm across a methane absorption feature located at 1653.7 nm. The light from the laser was split by a 1 × 4 fibre coupler; with the light from three fibres expanded using collimators to direct beams through each of three 109 cm length gas cells (tubes 1–3). The fourth output of the coupler acted as an interferometric reference arm. The light passing through the tubes was then coupled into further lengths of single mode fibre using similar collimators and then recombined with each other and the reference arm by another 1 × 4 coupler. Lengths of fibre were added such that the paths containing the gas cells had 0.5, 2.5 and 4.5 m excess fibre compared with the reference arm. This, in addition to the 1.2 m of free space (equivalent to  0.8 m in fibre of refractive index n = 1.45) in each measurement arm, gives three relevant interferometers between the measurement arms and the reference arms with fibre-equivalent OPDs of 1.3 m, 3.3 m and 5.3 m Measures to modify the polarization states within the interferometers, to avoid polarisation fading were not found necessary for this proof of concept experiment as the measurement principle is inherently self-referencing and the visibility of this setup was found to be sufficiently stable during the 0.5 s measurement time. Future implementations could, however, use polarization-maintaining fibre or polarization-diversity detection techniques to mitigate unbalanced polarisation changes [29].

Figure 1. Schematic diagram of experimental layout.
Download figure:
Standard image High-resolution imageThe RRI signal processing has been comprehensively described elsewhere [17], where in RRI an interferogram is recorded over the course of a sinusoidal wavelength modulation cycle and a smooth window function is applied to extract the central portion (see figure 2(a)). A complex version of the expected interferogram, precalculated for a given OPD, is then used to digitally demodulate the recorded interferogram, in the manner related to a lock-in amplifier. Changing the OPD of the demodulation interferogram over a range of values then provides a scan of RRI quadrature signal amplitudes as a function of OPD (see figure 2(b)). Each of the constituent interferometers is represented in this scan as a Gaussian peak in the RRI signal amplitude centred on the OPD of the interferometer in question ((i), (ii), (iii), (iv) and (v) in figure 2(b)). In this experiment, the RRI quadrature amplitude signal peaks indicated by the (i), (iii) and (v) in figure 2(b) are the desired interferences between each of the three sensing arms with the common reference arms, while (ii) and (iv) are the parasitic interferences between each of the sensing arms and each other without contribution from the reference arm.

Figure 2. (a) The intensity of a raw interferogram (left axis) over one RRI modulation period as well as the window function used (right axis). (b) The signal amplitude as a function of equivalent OPDs in fibre derived from the same interferogram shown in (a). Here (i), (iii) and (v) are the interferometers created by each sensing arm with the common reference arm, while (ii) and (iv) are combinations of the sensing arms interfering with each other.
Download figure:
Standard image High-resolution imageFigure 2(a) shows a typical RRI interferogram over one modulation period along with the RRI window function used. Figure 2(b) then shows the resulting RRI signal amplitude as a function of equivalent OPD in fibre, showing both the desired range peaks (i), (iii) and (v) interfering with the reference arm as well as undesired, mutual interferometers (ii) and (iv), that are, however, spatially offset from the desired interferometers due to the fibre path length configuration used. With a constant reference intensity  , for each constituent interferometer, the time-varying part of the photo detector signal U(t) is then proportional to the square root of the light intensity
  from each sensing arm [30] as shown in equation (2)

Rather than evaluating the phase component  , in this technique only the amplitudes of the interferometric quadrature signals after demodulation, themselves proportional to
  are evaluated. Therefore, after the RRI quadrature signals are calculated [14] for each gas cell, the square of the RRI quadrature signal amplitude is a measure that is proportional to the transmitted light intensity independent of the phase difference
  .
.
In the instrument itself, instead of a continuous OPD scan, a limited number of notional OPDs, or range channels, are chosen and their amplitudes recorded simultaneously, making real-time data acquisition practical within the FPGA. Examples of OPDs monitored are shown in figure 3.

Figure 3. The effect of current ramping on laser diode modulation and the apparent shift in OPD it causes. The dashed lines represent the locations of the interrogated range channels. The peaks shown in this diagram are a zoomed-in example of one of the peaks from figure 2(b).
Download figure:
Standard image High-resolution imageCompared to standard RRI [14], the addition of a slow ramp signal on the laser injection current provided a wavelength scan that enabled spectroscopic measurements. However, because the wavelength modulation response to injection current modulation is weakly dependent on the laser bias current, the amplitude of the sinusoidal wavelength modulation was not constant across the ramp but gradually increased with higher ramp currents. This variation in the sinusoidal wavelength modulation amplitude results in an apparent movement of the peaks in figure 2(b), along the OPD axis. The apparent motion of the range peaks was as high as 10 cm for the longest OPD. This is illustrated in figure 3. To compensate for this, as the laser wavelength was swept across the absorption feature, the amplitude of the RRI signal was measured at seven notional OPD range channels for each of interferometer of interest as shown by the dashed lines in figure 3.
Using this information, the RRI quadrature signal amplitudes of seven notional OPDs for each interferometer of interest, at any given instant, were fitted to Gaussian functions [17] using the Levenberg–Marquardt algorithm in post processing, in order to reconstruct the RRI signal quadrature amplitude peaks of interest ((i), (iii) and (v) in figure 2(b)) at each instant in the scan and determine its height, and thus the associated light intensity within that interferometer. The process was repeated across the entire 2 Hz wavelength scan, to build up a transmission spectrum for each gas cell. An illustrative example of the measured signal intensity as the laser wavelength is swept is shown in figure 4.
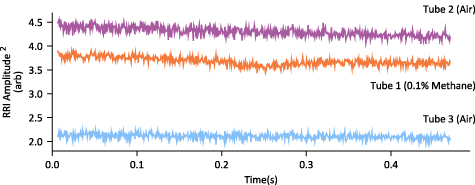
Figure 4. Examples of the spectra calculated for three tubes over a single 0.5 s wavelength sweep. Tube 1 contains 0.1% methane, while tubes 2 and 3 contained hydrocarbon free air.
Download figure:
Standard image High-resolution imageThe squared quadrature signal amplitude produces a signal analogous to the signal of a TDLS instrument measuring across a methane gas line recording the change in light intensity transmission. Using the behaviour of the light intensity in regions outside the methane absorption line, a baseline was fitted for use as I0 in equation (1). Using the Levenberg–Marquardt algorithm, the normalized absorbance was fitted to a Lorentzian absorption line, the height of which is measured in AU and is used as a measure of gas concentration. This was considered a suitable measure due to the relatively constant air pressure in the system over the course of the experiments.
3. Results
To test the response of the measurement system to different methane concentrations, the three gas cells shown in figure 1 were filled with different concentrations of methane. Each cell was isolated using valves, so that different concentrations could be applied to each cell independently. The concentration of methane was controlled by mixing gas from two cylinders, one containing hydrocarbon (HC) free air the other containing a mixture of HC free air and 1000 ppm methane. The mixing was controlled by mass flow controllers (Brooks GF100), producing methane concentrations in the range 0–1000 ppm by volume, calculated from flow rates of each gas, with an repeatability of <0.5%. In a first experiment, all cells were simultaneously filled with the same concentration of methane. At each concentration, ten measurements were taken and then the intensity plots were processed to produce normalised absorption curves. The mean heights of the absorption curves from each gas cell at each concentration are plotted against the methane concentration in figure 5.

Figure 5. Plot of methane absorption peak height against the actual methane concentration for each of the three gas cells, with an averaging period of 0.5 s.
Download figure:
Standard image High-resolution imageFigure 5 shows that at concentrations above the noise level there is an approximately linear relationship between the methane concentration and the absorption peak height while below appoximately 200 ppm, noise within the system dominates. At concentrations below approximately 100 ppm, the line fit algorithm used to calculate peak height will find spurious peaks within the noise that will not be indicative of the presence of methane and that are sometimes negative in amplitude. In future, we expect that improvements to the fitting algorithm such as constraining the fitted line to reasonable centre wavelengths and line widths would reduce errors at low concentration Raw data showed small offsets for the measurements from each tube from the absorption peak heights predicted by theory, but this was calibrated out by using a least squares method to find the straight-line equation for each data set and subtracting the corresponding y-intercept value for each data point. In order to assess the stability of the instrument, methane at a constant concentration of 1000 ppm by volume was passed through the cells, and a single measurement of 0.5 s duration as described above, was taken every 5 s.
Repeated measurements were taken over a period of 5 h and the fitted heights of the absorption curves at each measurement were used to plot an Allan–Werle deviation as shown in figure 6, using the method described by Werle et al [31]. Figure 6 shows that the optimum averaging period was approximately 150 s, at which point the Allan–Werle deviation for tubes 1, 2 and 3 are 2 × 10⁻⁴, 4 × 10⁻⁴ and 6 × 10⁻⁴ AU, respectively, which, by reference to the calibration curve in figure 5, gives a potential noise equivalent concentration (1σ) of the system in the range of 4–15 ppm (12–45 ppm at 3σ). Allan–Werle deviation measurements show that measurement of concentrations of gas of less than 20 ppm by volume (1σ, equivalent to a 60 ppm limit of detection at 3σ) can be achieved using a 150 s averaging time and at 10 s averaging time (equivalent to the response time of many pelistor sensors), 50 ppm at 1σ (150 ppm at 3σ) can be achieved which is below that required for use in most safety critical environments. Figure 6 also supports a noise-equivalent concentration (1σ) of 200 ppm for a 0.5 s averaging period, which supports the conclusion drawn from inspection of figure 5.

Figure 6. Allan–Werle deviation of fitted absorbance peak height in AU.
Download figure:
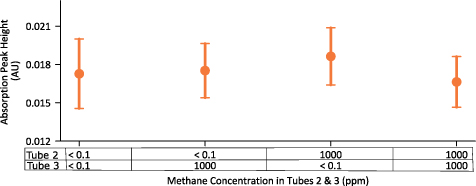
Standard image High-resolution imageTo measure the possible effect of cross-talk in which the presence of gas in one cell might cause a change in the reading from another gas cell, tube 1, the tube under test, was filled with 500 ppm methane, while the other two tubes, tubes 2 and 3, were alternatively filled with HC free air or 1000 ppm methane. In each case the absorption coefficient of tube 1 was measured ten times. The results are shown in figure 7. In each case, the mean value of the absorption peak heights measured in tube 1 when gas was present in tubes 2 and/or 3 was within one standard deviation of the values measured when tubes 2 and 3 were filled with HC free air. This shows that the measurement of the gas concentration in tube 1 is independent of the presence of gas in the other sensing locations to within experimental error.
Figure 7. The measured absorption peak height (mean and standard error) measured in tube 1 for a constant methane concentration of 500 ppm while tubes 2 and 3 were filled with either 1000 ppm methane or air. In each case, the mean and the standard deviations of the absorption peak height in tube 1 are plotted.
Download figure:
Standard image High-resolution image
4. Conclusion
In conclusion, a proof-of-principle experiment has demonstrated the first use of RRI as a method for the simultaneous measurement of methane gas concentration of three spatially separate gas cells using only a single DFB laser diode and a single photodetector. The technique allows the production of TDLS-like spectra for different gas concentrations being tested in the range 0–1000 ppm methane in air. Single point measurements with a 2 Hz TDLS scan have shown the ability to measure 200 ppm concentrations of methane. Allan–Werle deviation measurements show that measurement of concentrations of gas of less than 20 ppm by volume (1σ, equivalent to a 60 ppm limit of detection at 3σ) can be achieved using a 150 s averaging time and at 10 s averaging time, 50 ppm (1σ, equivalent to 150 ppm LOD at 3σ) measurements can be achieved which is well below a commonly applied safety alarm level of 1% by volume for use in safety critical environments. We have also demonstrated that the system is robust against cross-talk, with high or low concentrations of methane in the cells having no measurable effect on the readings from the other cells. The most significant drawback of the instrument in its current configuration is caused by the variation of wavelength modulation depth at different laser bias currents. This means that additional processing must be used to extract the peak height at each instant of time, and that the spacing of constituent interferometers must remain sparse. Future work will include adaptations to the laser modulation waveform over the ramp sweep to compensate for the effect of the variation in laser modulation response, allowing the multiplexing of a larger number of gas cells (for example, previous implementations of RRI have involved 20 interferometers [16]), making this approach a powerful and cost-effective technique for the multiplexing of optical gas cells that could be used to detect the presence of a variety of gas species.
Acknowledgments
This work was partially funded by EPSRC Grants EP/N509450/1 and EP/N002520/1. T K acknowledges a Royal Academy of Engineering Research Fellowship RF\201718\1745.
Data access statement
The underlying data can be accessed at https://doi.org/10.17862/cranfield.rd.11829723.v1 from the Cranfield Online Research Data Repository.