

Abstract
Super-resolution fluorescence microscopy has become a powerful tool in cell biology to observe sub-cellular organization and molecular details below the diffraction limit of light. Super-resolution methods are generally classified into three main concepts: stimulated emission depletion (STED), single molecule localization microscopy (SMLM) and structured illumination microscopy (SIM). Here, we highlight the novel concept of modulation-enhanced localization microscopy (meLM) which we designate as the 4th super-resolution method. Recently, a series of modulation-enhanced localization microscopy methods have emerged, namely MINFLUX, SIMPLE, SIMFLUX, ModLoc and ROSE. Although meLM combines key ideas from STED, SIM and SMLM, the main concept of meLM relies on a different idea: isolated emitters are localized by measuring their modulated fluorescence intensities in a precisely shifted structured illumination pattern. To position meLM alongside state-of-the-art super-resolution methods we first highlight the basic principles of existing techniques and show which parts of these principles are utilized by the meLM method. We then present the overall novel super-resolution principle of meLM that can theoretically reach unlimited localization precision whenever illumination patterns are translated by an arbitrarily small distance.
Export citation and abstract BibTeX RIS

Original content from this work may be used under the terms of the Creative Commons Attribution 4.0 license. Any further distribution of this work must maintain attribution to the author(s) and the title of the work, journal citation and DOI.
1. Introduction
Cell biology and microscopy are closely intertwined since the invention of light microscopy in the late 1600s, attributed to Antonie van Leeuwenhoek who was the first to observe bacteria and protozoa. Fluorescence microscopy—pioneered in the early 1900s—is based on substances which absorb light that is reemitted as fluorescence at a longer wavelength determined by the Stokes shift [1, 2]. Nowadays, fluorescence microscopists in state-of-the-art biolabs can specifically tag and image molecular components of cells and tissues (such as proteins, lipids, DNA, RNA) in various biological systems with minimal invasiveness [2–4]. One of the key developments has been the advent of genetically encoded fluorescent proteins, which enabled to study protein localization, dynamics and function in cells [5, 6]. Over the last two decades, this approach generated fundamental knowledge about cellular processes and profoundly advanced life science research.
Despite the advantages of optical microscopy, both brightfield microscopes (using visible light passing through the sample) and fluorescence-based microscopes are fundamentally limited in spatial resolution by the wave nature of light. Specifically, the optical resolution is set by the diffraction limit of light to around  , where
  is the wavelength of the collected light [7]. For example, considering the emission of a green fluorescent protein (GFP,
  nm), no structure below 250 nm would be resolvable.
Pioneering steps in the direction of super-resolution fluorescence microscopy were set in the late 1980's, with the recording of tracks of single light-scattering objects and fluorescent particles [8–10]. First described by Heisenberg around 1930, this approach used the fact that sparse point emitters can be detected with high precision: each recorded photon carries information about the true location of its—well separated—emitter [11, 12]. The precision of localization is then given by the spreading, called point spread function (PSF), of the photons around the emitter position in the image plane. The PSF of the imaging system is characterized by a standard deviation  set by the numerical aperture (NA) and
  , the fluorescence emission wavelength, by
  . Collecting
  photons is equivalent to repeating
  independent measurement of the emitter's position, leading to an uncertainty given by the standard error of the mean [13]
  . A precision of about 1 nm in the localization of a particle would therefore be achievable with around 104 photons detected, assuming a very low background noise.
In 1995, Eric Betzig published a first rough idea for how super-resolution optical microscopy based on the localization of single fluorescent molecules could be realized [12]. It did, however, take yet another 10 years, before he and colleagues were able to truly demonstrate this concept in 2006 by consecutively photo-activating and localizing single photo-activatable fluorescent proteins and by superimposing all detected single molecule locations to create one pointillistic image [14]. This was the starting point for single molecule localization microcopy (SMLM) methods such as (F)PALM, (d)STORM and µPAINT [15–18].
In a different attempt to overcome the diffraction limit of light, in the late 1990's Stefan Hell proposed stimulated emission depletion (STED) of fluorophores [19, 20]. In 2000, Klar et al showed a 5 to 6-fold increase in the axial resolution of a modified confocal microscope using depletion spots above and below the focused excitation spot. This depletion pattern was generated by placing a phased plate in the beam path of the depletion laser (called STED beam), resulting in a non-linear inhibition of active fluorescence to narrow the effective PSF of the microscope. Even though both the excitation and depletion laser spots are diffraction-limited, their combination results in a non-linear depletion of the fluorophore's emission, which reduces the effective PSF of the excitation volume. After its initial realization, the concept was immediately extended to multiple colors, 2D/3D versions, cell applications and was generalized to reversibly photo-switchable fluorescent labels (RESOLFT) [21–24].
Around the year 2000, another super-resolution microscopy (SRM) concept was introduced by Gustafsson and Heintzmann based on the use of interference patterns in structured illumination microscopy (SIM) [25, 26]. In contrast to PALM, where typically more than 104 raw-images are used to create a super-resolved image, SIM relies on 9 or 15 raw-images to create one super-resolved image. The physical principle of SIM is based on illuminating a sample with a striped pattern that will shift high-frequency image information below the diffraction limit into the lower frequency domain that can be captured by the objective lens [27, 28]. This is highlighted by the so-called Moiré patterns, which carry information about previously inaccessible details of the sample. The advantage of SIM is that super-resolved images are created without the need of special fluorophores since super-resolution linear SIM is not dependent on specific photo-physical dye characteristics, required in methods such as PALM, STORM or STED. The disadvantage of linear SIM is that it is limited to a resolution gain by a factor of two, down to approximately 100 nm. SIM has also been extended to non-linear SIM using photo-switchable dyes, which allows improving the image resolution, achieving about 50 nm lateral resolution [29–31].
In 2017, Balzarotti et al introduced MINFLUX—minimal photon fluxes—in which a radically new concept of SRM was presented with the potential to virtually reach unlimited resolution with minimal photo-damage to the fluorophore [32]. MINFLUX reached 2 nm localization precision by using less than  photons. Although the technical setup uses a doughnut-shaped laser beam, the method is drastically different from STED microscopy. In MINFLUX, single fluorescent emitters are kept close to the center of a doughnut-shaped illumination profile. The idea is to use the well-known doughnut shaped illumination profile as a ruler for probing the emitter's position. The position of the emitter is retrieved by a triangulation localization approach as outlined further below. MINFLUX can achieve better localization than the theoretical limit of SMLM methods and was extended to isotropic 3D localization precision [33, 34].
In 2019, the parallelization of the MINFLUX method was first described by Reymond et al using the acronym SIMPLE [35] and followed by similar approaches [36–38] named ROSE, SIMFLUX and ModLoc. In a recent paper [33], Hell et al also extended the field of view (FOV) of MINFLUX from initially around 100 × 100 nm2 to a size of about 10 × 10 µm2. In this perspective, we will describe the novel concept of these modulation-enhanced localization microscopies (meLM), its relation to STED, SMLM and SIM, and outline current technical realizations, limitations, and future perspectives of the approach.
2. Current concepts of super-resolution microscopy
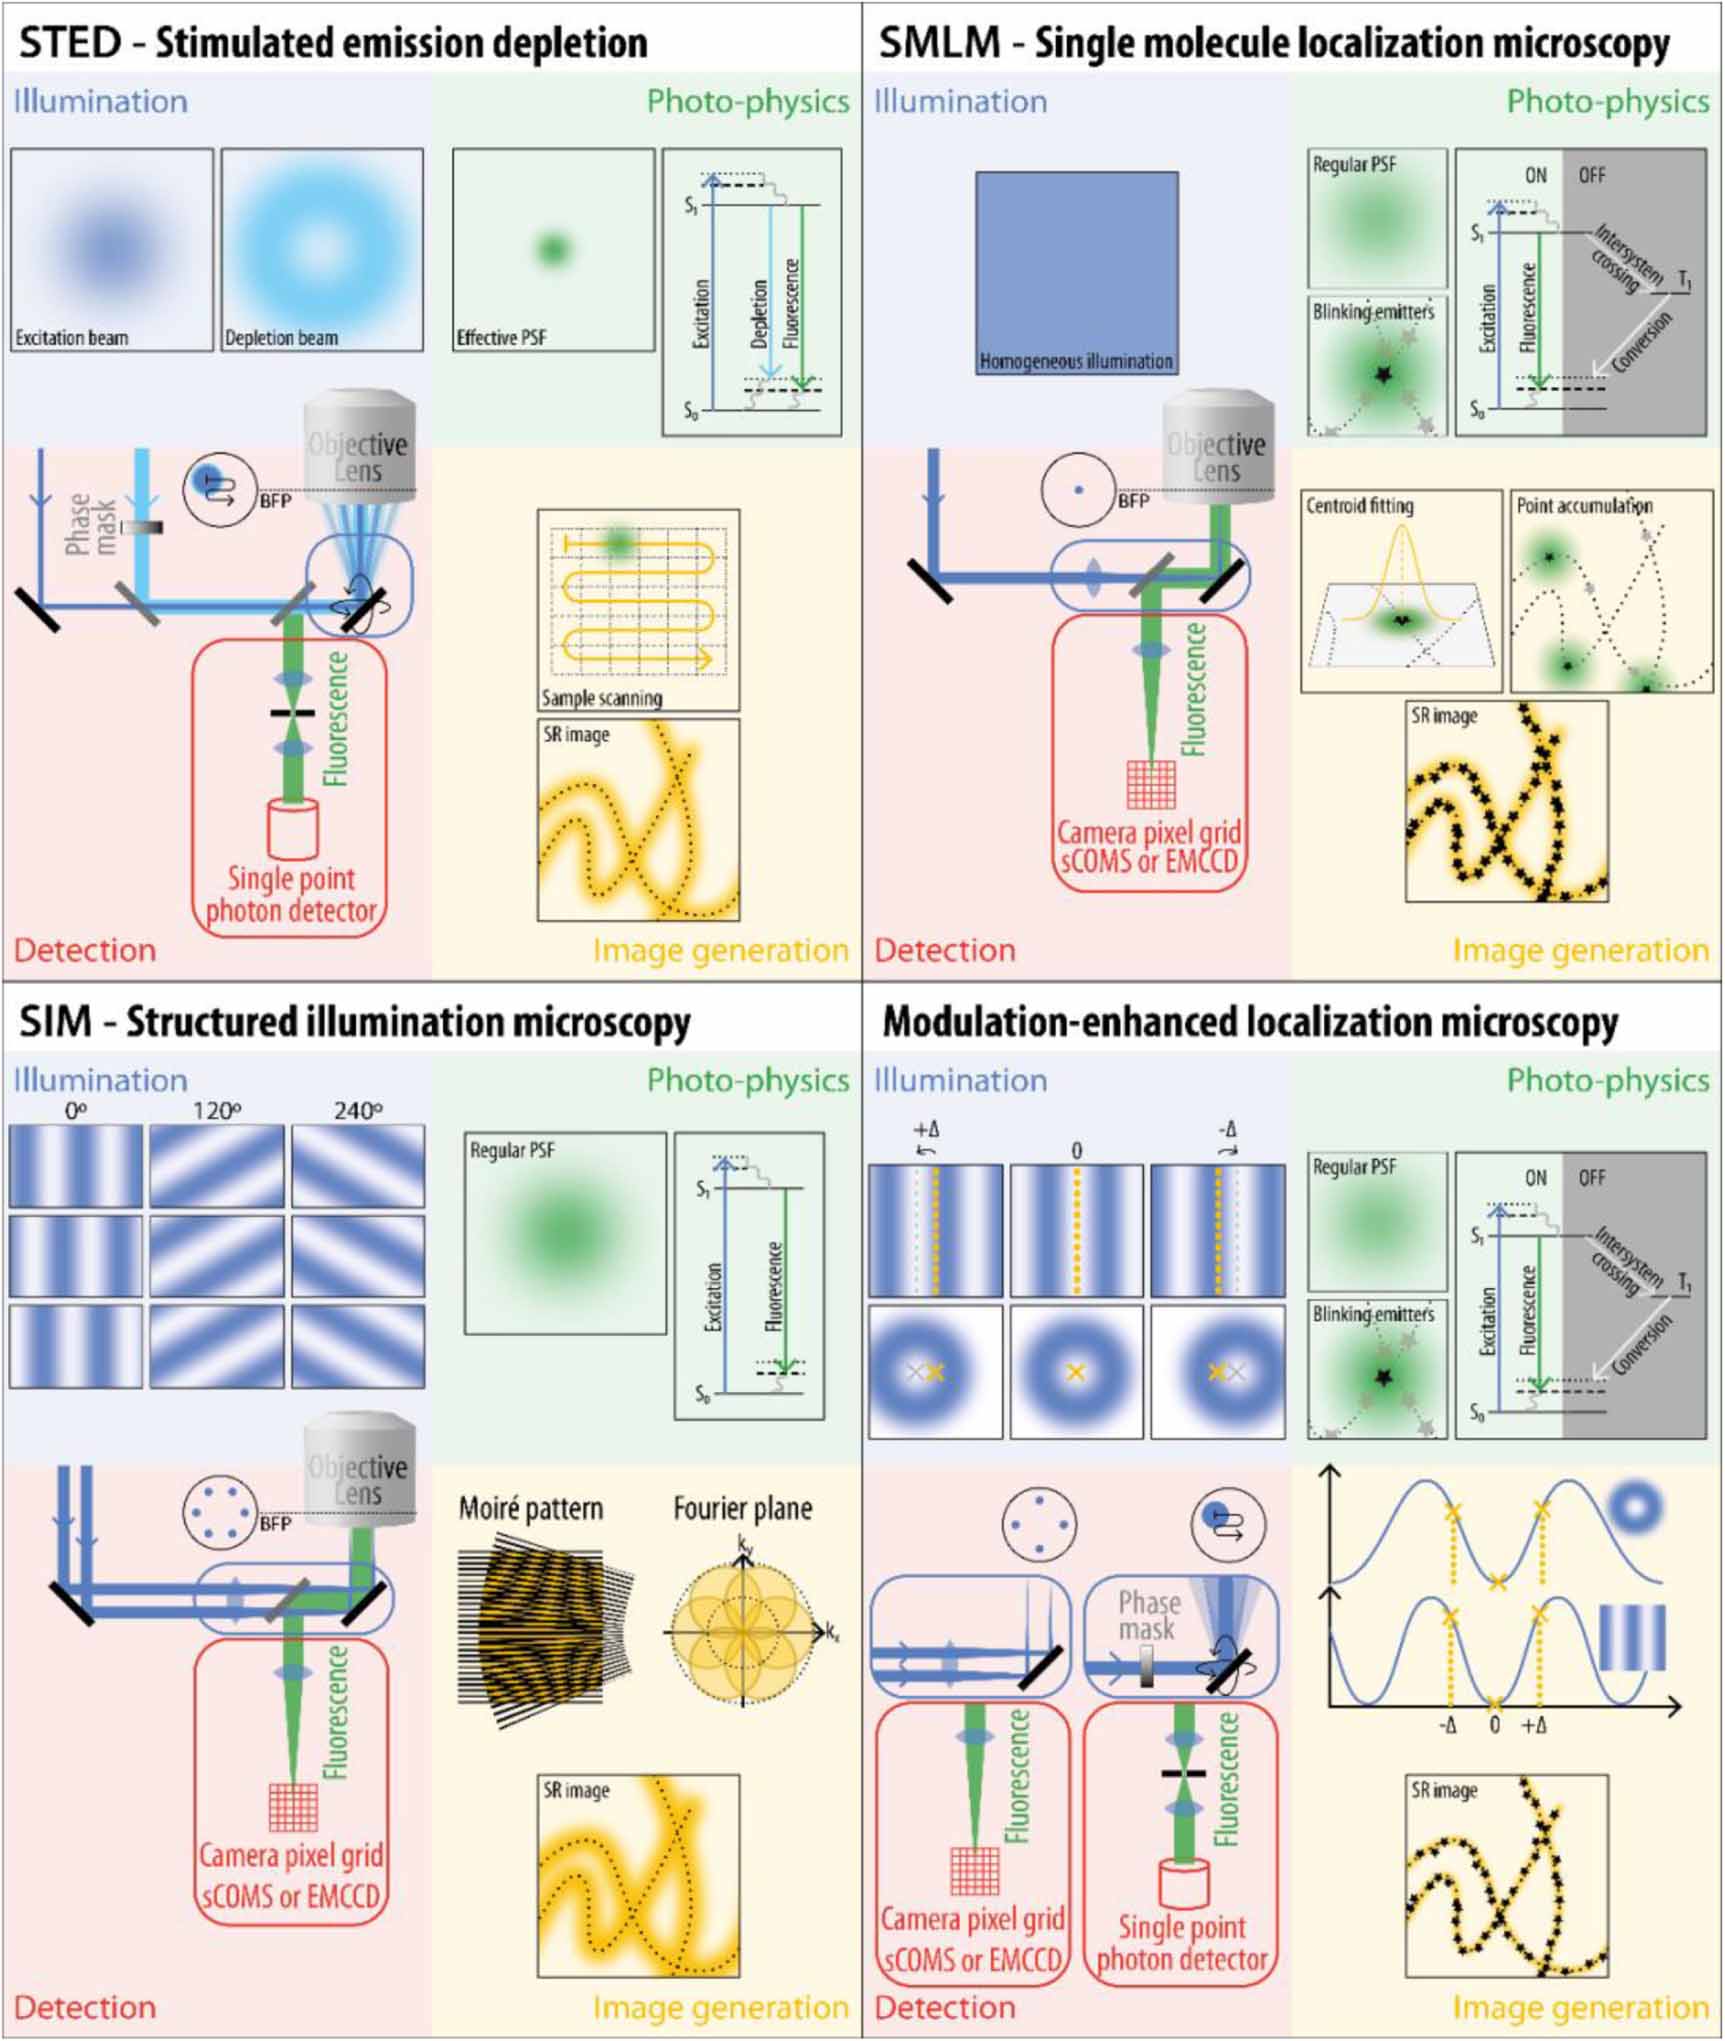
In order to demonstrate how meLM is positioned within the field of super-resolution microscopy, we will split the current super-resolution (SR) methods into three main principles: stimulated emission depletion microscopy (STED), single molecule localization microscopy (SMLM) and structured illumination microscopy (SIM) [39–41]. To get an overview over the current SR methods and the novelty and relation of meLM to these three methods (STED, SMLM and SIM), we classify and structure all four approaches as shown in figure 1. Despite some shared features between meLM and the existing SR techniques (such as structured illumination profile or on/off switching of the fluorophores to ensure sample's sparsity), meLM relies on a fundamentally different principle as described below, therefore justifying it to be named a fourth SR microscopy technique. In figure 1, all four SR methods are further split into four quadrants highlighting their specific requirements: (1) Illumination (blue), (2) photo-physics of the fluorophore (green), (3) setup and detection method (red) and (4) image generation, necessary to create the super-resolved image (yellow). Control of illumination and photo-physical properties in each method enable spatial excitation and fluorescence emission control prior to signal detection by the objective lens (blue and green). Detection type and signal analysis in each method describes the handling of emitted photons after passing the objective lens (red and yellow). Note that machine-learning approaches can be combined with existing techniques such as SMLM [42, 43] and SIM [44, 45] for better and faster reconstructions, and we believe meLM will benefit from it too.

Figure 1. Overview of super-resolution microscopy concepts: STED—Stimulated emission depletion microscopy uses two illumination laser beams (STED-blue), one to excite fluorophores and one to deplete fluorescence in a doughnut shaped ring around the center of the excitation laser spot. The generated effective point spread function (STED-green) is scanned across the sample to create super-resolved images (STED-yellow). SMLM—Single Molecule Localization Microscopy is based on localizing single molecules with high precision (SMLM-yellow) by creating sparse active emitters in individual images. To generate sparsity, a very small subset of emitters is fluorescently activated (ON) at one single time point, whereas all the other fluorescent dyes are kept in an OFF state (SMLM-green). Point accumulation of thousands of isolated emitters into one image leads to a super-resolved image. SIM—Structured Illumination Microscopy is based on illuminating the sample with patterned light (SIM-blue, sinusoidal wave pattern) to generate the Moiré effect. Moiré patterns contain higher frequency information (SIM-yellow), which is algebraically decoded to allow for super-resolution microscopy. meLM—modulation-enhanced Localization Microscopy uses the illumination features of SIM or the doughnut spot in STED in the illumination path (meLM-blue). Instead of imaging the entire fluorescently labeled sample as done in SIM, meLM uses the idea of imaging single emitters as performed in SMLM by putting most of the fluorophores into an inactive state (meLM-green). By shifting the illumination pattern (meLM-blue) to modulate the fluorescence response (meLM-red), the single molecule position can be inferred from recorded photon counts with highest precision resulting in SR images at lowest photon budget (meLM-yellow).
Download figure:
Standard image High-resolution image2.1. STED
To bypass the classical resolution-limit, STED uses a specific photo-physical concept, which is based on combining the excitation beam with a doughnut-shaped fluorescence depletion beam in the illumination path (see figure 1(a)). The non-linear dependence of the fluorescence depletion process on the power used for depleting fluorescence, together with the specific illumination configuration generate an effective point spread function (PSF) smaller than the diffraction-limited PSF, the size of which can be tuned with the power of the depletion beam. This sub-PSF-sized excitation volume is then scanned across the sample—identical to a confocal setup—and the corresponding fluorescence is collected with single point photodetectors, e.g. an avalanche photodiode. Scanning the sample with a sub-diffraction size PSF will result in super-resolved images [21].
2.2. SMLM
In contrast to STED, a homogenous illumination of the sample is used in SMLM (see figure 1(b)). To achieve a super-resolved image, technical efforts have been put in the development of excitation schemes that ensure sparsity of the fluorophores at each time point such as photo-activation or fluorescent dye switching. The detection is typically achieved with sensitive, high-speed cameras (sCMOS, EMCCD) to capture individual single molecules, frame by frame, with minimal read-out noise. Localization microscopy techniques such as PALM/STORM extract the molecular position of a single molecule by calculating the centroid position of the diffraction-limited signal spread across the pixelated frame of the camera. The reconstruction of structures of interest is then possible by superimposing the molecules' centroid coordinates obtained from a large number of processed images, each of them featuring localizations of a sparse sub-set of the tagged fluorescent molecule of interest. Even though the localization precision of each emitter is high (2–20 nm), the effective resolution of the SR image is typically around 20–50 nm not only depending on the single molecule localization precision but further on the density of collected single molecule positions, structural sample parameters and true positive localizations [46–49]. Altogether, SMLM achieves super-resolution by controlling the sparsity of fluorophores and using image post-processing algorithms for centroid fitting and pointillistic image reconstruction [50].
2.3. SIM
Structured illumination microscopy (SIM) creates high resolution via patterned illumination (see figure 1(c)). SIM can be used with standard fluorophores and does not require specific photo-physical operations, making it broadly accessible to a large range of genetically encoded and commercially available fluorescent tags. In a typical SIM setup, a sinusoidal patterned illumination is rotated 3 times and shifted 3 (5) times resulting in 9 (15) raw—diffraction limited—images for 2D (3D) SIM [51]. Each of the raw images contains high frequency information (higher than given by the optical diffraction limit of the microscope), visible as low frequency features of Moiré patterns. These raw images then have to be mathematically decoded resulting in a reconstructed super-resolved image [28, 52].
2.4. meLM
Modulation-enhanced localization microscopy (meLM see figure 1(d)) takes advantage of both the structured illumination (sine-wave pattern from SIM or doughnut-shaped pattern from STED) and the sparsity of emitters used in SMLM to improve localization precision. The well-defined illumination pattern and, more importantly, its precise displacement, lead to a predictable modulated response of the fluorescence intensity from which extra information can be harvested. Even though any high-contrast structured illumination would theoretically work, until now only sinusoidal patterns and doughnut profiles have been used. Note that in this application the doughnut-shaped illumination inherited from STED is used solely as an excitation source and not as a depletion beam.
3. Principle of modulation-enhanced localization microscopy (meLM)
The fundamental requirements of modulation-enhanced localization microscopy are the following:
- a.A well-characterized structured illumination pattern (e.g. sinusoidal wave or doughnut-shaped beam)
- b.The possibility to shift this pattern with high accuracy (sub-nanometric precision achievable with spatial light modulators (SLMs) or electro-optical deflectors (EODs))
- c.A sparse sampling of fluorescently labelled molecules
- d.Single photon counting with high precision and sensitivity
Even though not strictly necessary, one assumes, for simplicity, a linear response of the fluorophore to the excitation; this assumption is reasonable for most of the fluorophores and for laser powers below the saturation intensity for most standard fluorophores. In the case of a sinusoidal illumination pattern, a series of three measurements are performed along the direction of the pattern, each of them corresponding to a different translational position of the pattern [35]. The collected fluorescence intensity, response of the emitter to the excitation, directly depending on its relative position with respect to the illumination pattern, will therefore be modulated as the illumination is shifted. From this series of three images, one can extract three different numbers of emitted photons  , which follow the shape of the illumination profile (in the case of a non-linear response, one simply has to combine the response with the excitation pattern). It is important to assume a stable photo-physical behavior during the measurement time. From these modulated emission intensities
  , one retrieves the position of the emitter through fitting of the illumination's shape; a sinusoidal function in this case. As x-y positions can be determined independently, using two orthogonal illumination patterns is sufficient for 2D localization of a single particle. The procedure is therefore repeated after a 90º rotation of the illumination pattern. MINFLUX works in a similar way, using a doughnut-shaped illumination and consecutive measurements at four positions to retrieve a x-y localization. This approach is radically different from SIM and SMLM as it relies neither on image reconstruction of Moiré patterns in Fourier space, nor on centroid fitting of diffraction-limited photon distributions.
The localization precision of meLM can be evaluated using error propagation and the Cramer–Rao Lower Bound (CRLB) as derived for sinusoidal, Gaussian and quadratic functions [32]. In the next section, we will describe the resulting localization precision by using either large or small pattern shifts, where we achieve a homogeneous  2-fold localization improvement or higher localization gains, respectively.
Altogether, the concept relies on phase-shifting of the otherwise stable illumination pattern which can be performed with nanometer precision ( 1 nm) to probe the actual particle position through photon number variations for different phase shifts. The measured photon counts can be fitted to the known illumination pattern to derive the actual particle location leading to higher localization precisions compared to centroid fitting in classical SMLM.
The power of the newly developed meLM technique comes from the extra information one can extract from the structured nature of the previously well-characterized illumination pattern. In other words, by putting into the system more knowledge—in this case the illumination’s spatial shape and spatial shifts—one can achieve higher localization precision. The requirement is that there is a technology to control illumination patterns and shifts at precisions significantly smaller than the wavelength of the emitted light. This, however, can be achieved easily e.g. by displacing the sample underneath a stationary pattern using high-precision piezo-position stages, or by displacing the pattern. MINFLUX, which opened the path for this class of techniques, directly exemplifies an extreme case, where the emitters are localized in the minimum of the doughnut-shaped illumination profile using sub-nanometer shifts. However, this is only possible at the expense of the size of the field of view, as only the particles resting at the center of the doughnut will be localized with higher precision (see below). In comparison, other techniques such as SIMPLE, ROSE, SIMFLUX and iterative MINFLUX have the advantage of providing a localization precision improvement over large fields of view and have been shown to yield an improvement factor of around two.
The key difference between meLM and other SR techniques is that information about the actual emitter’s position can be extracted even in the complete absence of any detected photons in an image. Indeed, by considering a region of the FOV, where nothing but noise is visible on a camera frame, only two plausible conclusions can be drawn:
- (1)There is no emitter at this location.
- (2)The emitter is located in a trough with a zero value of the illumination intensity.
The latter hypothesis is then answered to with the next acquired image where the illumination is shifted: a brightness increase will be observed if there is an emitter present. This Gedankenexperiment shows that after a full measurement cycle, i.e. successive phase shifts of the illumination, both the ‘absence of’ and the actual collected photons contributed to defining the position of the emitter. This contrasts with standard SMLM that would only employ the directly captured photon information.
In the following subsections, we will describe how this homogeneous two-fold increase in localization precision is achieved, as well as the more specific regimes where the gain becomes virtually infinite using small pattern shifts.
3.1. Homogeneous two-fold localization precision gain
Whenever (1) the average illumination intensity is equal, and (2) the ‘modulation efficiency’ (defined further below) is constant over the FOV, a homogeneous resolution gain over the whole FOV will be reached:
- (1)Assuming a sinusoidal illumination described by:
with  the amplitude,
  the phase and
  the modulation depth. Taking
  equally spaced sampling points on the illumination, i.e.
  , one obtains an expression for the average total number of photons:
R represents the response function of the fluorophore to a given excitation, generalizing the approach to any illumination pattern and linear/non-linear response of the fluorophore. In the following, this response is assumed to be linear, without loss of generality  , leading to:
Please note that the resulting expression does not depend on  , and is therefore constant over the FOV whenever
 .
.
- (2)Next, we introduce a 'modulation efficiency'
 , defined as the normalized standard deviation of the recorded number of photons:


If the number of sampling points is below three, the modulation efficiency will exhibit a spatial dependence. For three or more frames per pattern orientation, a homogeneous modulation can be achieved, necessary for a homogeneous precision gain. Even though demonstrated for the specific case of a sinusoidal illumination pattern, this reasoning will hold for any arbitrary illumination pattern.
A two-fold localization precision gain over the field of view has been verified both in silico and experimentally by different groups [35–38]. The localization gain is defined by comparing the localization precision of meLM to SMLM for a given number of photons. Figure 2 shows one measurement to determine the position of a single emitter using the SIMPLE method. First, three intensities are recorded at three illumination pattern positions and second, a fit to the illumination pattern retrieves the actual single molecule position. Figure 3 shows the repetition of this process to get information about the statistical behavior of the three fit parameters: the amplitude, phase and offset. The photon spreading, shot-noise and read-out noise are included in these simulations showing a Poissonian-like distributed variability of photon counts [53] matching  . We assume that the phase shift of the pattern is infinitely accurate, there is no movement or drift of the emitter and the laser has no intensity variation during the time scale of the measurement. The crucial parameter is the phase φ, as it corresponds to the position of the emitter on the sinusoidal wave pattern, i.e. its location. The spreading of the recovered phase
  directly gives the localization precision. Figure 3(b) shows the comparison of the theoretical limit of SMLM as derived by Mortensen et al 2010 (revised formula from Thompson et al 2002) [13, 54]. The SIM based localization techniques, such as SIMPLE, provide a two-fold improvement in localization precision, homogeneously over the FOV and regardless of the number of recorded photons.

Figure 2. Principle of meLM. (a) A single emitter is illuminated with the same sinusoidal pattern sequentially shifted along the horizontal direction by a third of the wavelength (equidistant lateral displacements). (b) The modulated intensity response is then recorded on a camera. (c) The number of detected photons for each position of the illumination pattern is fitted with a function identical to the illumination profile, i.e. a sinusoidal wave function. The retrieved phase of the sine corresponds to the relative position of the emitter in the illumination pattern.
Download figure:
Standard image High-resolution image
Figure 3. Localization precision of meLM compared to SMLM (a) Triplets of modulated intensities are repeatedly fitted with a sinusoidal function in order to retrieve the emitter's position. The histogram, normalized to the maximum, represents the dispersion of each parameter of the fit: the amplitude, the background offset and the phase. (b) Comparison between the theoretical limit of SMLM derived by Mortensen et al [54] and SIMPLE at various detected numbers of photons. SIMPLE reaches a 2-fold improvement of the localization precision, regardless of the number of detected photons. The parameter b is the standard deviation of the noise in photons/pixel.
Download figure:
Standard image High-resolution image3.2. Extreme localization precision gain: minimal photon flux
In the previous section, we described a shift of the excitation pattern by a third of the illumination pattern's wavelength, resulting in a high modulation of the emitter's fluorescence response following the full excitation amplitude. As previously mentioned, by reducing the displacement of the illumination pattern, one can reach even greater gain in localization precision: the fluorescent emitters present in the valley of the excitation will be precisely localized even in near-absence of photon emission. In such a case, the precision arises from the fact that an emitter can be kept in the zero-intensity region of the illumination pattern by shifting and registering its displacements with sub-nanometric precision.
Where SMLM uses the fluorescence signal to statistically retrieve the position of the centroid, for each photon collected, meLM extracts the information about the likelihood of an emitter to be present at a certain distance from the excitation's valley. In short, the paradigm changes from 'Where is the emitter in the FOV?' to 'Is it located in the valley?'. By narrowing down the scope of the question, each individual answer (photon counted) gives rise to a more accurate information. This enhanced precision comes at the expanse of the covered surface, as this gain exists only within the dark regions of the illumination.
By adding a certain background noise level on top of the emitted fluorescence, the principle can still be applied, and a high localization precision can be envisioned. In addition, reduced modulation contrast due to limitations in real setup configurations can be accounted for with an increased background noise as described in Reymond et al [35].
Therefore, for smaller translations  , of the pattern with a shift amplitude
  , one can obtain the number of collected photons as a function of the relative position with respect to the illumination
  :
:
For  , the modulation efficiency can be analytically expressed as:
As previously stated, a spatial dependence arises for  . The effect of varying the pattern shift's size onto the modulation efficiency is shown in figure 4. If the modulation efficiency is negligible—the illumination intensity does not change between frames—meLM cannot provide extra information compared to SMLM.

Figure 4. Spatial map of the 'modulation efficiency'  for various step sizes of the illumination pattern's shift. For a pattern shift of a third of the illumination wavelength,
  is homogeneous whereas for smaller shifts, the modulation becomes dependent on the relative position of the emitter with respect to the illumination. The regions with high modulation efficiency, located at each trough of the pattern (highlighted by colored circles) scale with the size of the illumination shift.
Download figure:
Standard image High-resolution imageFollowing the same principle as described in figure 3, the triplet of emitter intensities, recorded close to the illumination minimum, is fitted with the illumination profile to obtain the particle location. Comparing figure 3(a) with figure 5(a) highlights the resulting higher localization precision at the same number of photons ( ) set in this simulation (see specifically the standard deviation of the fitted phase
  ). Reducing the pattern shift will increase the localization precision gain regardless of the number of photons (see figure 5(b)).

Figure 5. Smaller phase shifts increase the localization precision for molecules located in the valley of the illumination pattern: (a) Triplets of intensities collected in the illumination's valley are repeatedly fit, providing a high precision localization of the emitter. The illumination pattern is shifted by a ninth of its wavelength between each point centered on zero. The distribution of the fitted phase, at equivalent numbers of detected photons, is much narrower than for the case described in figure 3(a). (b) Localization gain compared to the theoretical limit of SMLM (Mortensen et al) obtained for different magnitude of pattern-shifts. The obtained gain at low background noise is nearly independent of the number of photons collected.
Download figure:
Standard image High-resolution imageWhen we consider emitters residing outside of the illumination minimum, the effect of having a gain in localization precision compared to SMLM will be lost. The farther the particle climbs up towards the peak of the illumination pattern, the less of an advantage is created by the smaller phase shift mode, eventually removing all information encoded in the phase. The observed localization precision gain with respect to the position of the emitter relative to the illumination pattern is shown in figure 6(a). Balzarotti et al showed that the localization precision scales with  when a single molecule emitter is scanned with pattern shifts of size
  . However, as illustrated in figure 6(b), this comparison for a fixed number of detected photons implies a strong increase of the fluorescence whenever the fluorophore is located outside of the illumination minimum. Specifically, to keep the same number of photons, an increasing laser power is necessary, thereby creating a larger amplitude of the illumination pattern (see figure 6(b)). If on the other hand the emitter resides close to the peak of the illumination pattern, the localization precision will be low, and the high laser power will eventually bleach the fluorophore. To quantify this increased intensity required, we represent the achievable localization gain alongside the square root of the relative illumination amplitude (figure 6(c)).

Figure 6. High-gain meLM. Extreme localization precision gains are created using small phase shifts of the illumination pattern (a) Localization precision gain as a function of the relative position of the emitter in the illumination pattern. The high gain of the 'valley mode' (red/yellow/green) only works close to the minimum of the illumination pattern. Phase shifts of a third of the wavelength (λ/3) result in approximately 2 to 3-fold improvement regardless of the position of the emitter (blue). (b) Illustration of the increase in amplitude necessary to keep the photon number constant while decreasing the size of phase shifts (λ/3, blue, λ/6, red and λ/9 yellow). The three blue points on the blue curve represent an overall number of N1/3 photons used to determine the emitter's position. If we keep the number of photons constant (N1/3 = N1/6) while creating a smaller phase shift (λ/6 instead of λ/3) we must follow a horizontal line indicated by the black arrow. This now has two important consequences: (1) the amplitude has to be increased and (2) the red points on the red curve are positioned deeper in the valley of the red curve. The two red points allow for a better estimation of the relative single molecule position compared to the blue ones. (c) Localization precision gain as a function of the pattern shift (blue), scaling linearly for small shifts. The increase in amplitude (emitter's response or illumination intensity) to preserve the number of photons while changing the size of the shift (red).
Download figure:
Standard image High-resolution image3.3. Experimental results
In order to demonstrate experimentally the results obtained through computer simulations, a variety of samples have been tested by different research groups. We show in figure 7 a comparison of localization precision between classical SMLM techniques (ThunderSTORM [55]) and SIMPLE. This comparison is carried out on single Alexa488 dyes on glass, both in regular and high-gain regimes, validating a 2 and 6.5-fold improvement in localization precision (figures 7(b)–(d)). The illumination pattern and the fitting procedure effectively provide a doubling in localization precision over the whole field of view, whereas smaller pattern translation give rise to higher gain in regions restricted to the trough of the illumination, similarly to MINFLUX. The datasets are acquired on a modified custom-built TIRF-SIM setup with a high NA objective (NA 1.49).

Figure 7. Illustration of the fitting procedure and obtained localization precision gain with respect to ThunderSTORM. (a) Exemplary data from a single Alexa488 dye with repeated fitting of recorded intensities. (b) Comparison of the localization position's distribution obtained using SIMPLE (blue) and ThunderSTORM (gray), featuring a 2-fold improvement in localization precision. (c) Example of high-gain regime, where reduced illumination shift results in higher localization precision. (d) Comparison of the localization precision obtained using SIMPLE (red) and ThunderSTORM (gray), with a 6.5-fold improvement. Note the difference of localization's counts, resulting from some discarded failed ThunderSTORM detections.
Download figure:
Standard image High-resolution image
4. Setup configurations
All the meLM techniques require the precise measurement of the induced intensity changes in the fluorescence as well as the generation and translation of a well-defined illumination pattern. A range of recently introduced meLM techniques each feature slightly different implementations achieving those goals, and are summarized thereafter.
4.1. Illumination
SIM-based meLM requires the interference of two pairs of identical laser beams, responsible for creating the sinusoidal illumination patterns, which can be achieved using standard diffraction gratings, spatial light modulators (SLMs), beam-splitters, Pockel-cells or digital micro-mirror devices (DMDs), see table 1.
Table 1. Implementation's comparison of the existing meLM techniques.
| Pattern | ||||||
|---|---|---|---|---|---|---|
| Generation | Shifting | Shape | Lateral/axial | Detection path | Detector | |
| MINFLUX | Vortex phase plate | EOD & galvos | Doughnut | x,y,z | 'STED' Scan | APD |
| SIMPLE | Diffraction on DMD | DMD | Sine | x,y | Direct | sCMOS |
| ROSE | Beam splitters | EOM | Sine | x,y | Galvo (split) | sCMOS |
| SIMFLUX | Diffraction grating | Transl. grating | Sine | x,y | Direct | sCMOS |
| ModLoc | Beam splitters | EOM | Sine | z | Pockel cells | sCMOS |
The maximum achievable localization precision of the technique is limited by the modulation depth and the precision of the pattern shifts. Therefore, it is crucial to calibrate and to control the system precisely. In the case of MINFLUX, this is achieved with galvo-mirrors and electro-optic deflectors (EODs), respectively, for large scale and precise positioning of the doughnut beam profile.
The first MINFLUX approach was developed for a limited area of about 100 × 100 nm2 but meanwhile it has been extended to FOVs of about 10 × 10 µm2 using an iterative fluorophore targeting feedback loop. In brief, the iterative MINFLUX setup consists of a beam scanning confocal fluorescence microscope where the excitation beam is co-aligned with a UV beam to activate single emitters in a region of about 400 × 400 nm2. Whenever a single fluorophore appears in the activated area, the doughnut-shaped illumination pattern shift is subsequently reduced from 150 nm to 40 nm while keeping the actual calculated position in the respective minimum. On this basis Gwosch et al [33] could show that they were able to detect  100 single emitters in about 1 min leading to an overall recording time for the FOV of
  60 min. As a consequence of using iterative steps for locating the fluorophore of interest, more photons are needed, leading to a reduced localization precision compared to using a single minimum target search.
ModLoc, ROSE, and SIMFLUX use electro-optic modulators (EOMs) and the translation of a diffraction grating to modify the phase of one of the two interfering beams. In SIMPLE, the DMD is used both to switch between the perpendicular orientations of the pattern and to modify the relative phase between the interfering beams. The discrete nature of the array of mirrors constituting the DMD allows a theoretically error-free repeatability of the illumination pattern shift.
4.2. Detection
SIMPLE, ROSE, SIMFLUX, and ModLoc cover the entire x-y region of interest using a sCMOS camera. Complementarily, based on a STED-like excitation and detection scheme, MINFLUX uses an avalanche photodiode (APD) to detect the emission gathered from a scanned volume on the sample. APDs have the advantage to have very low noise-levels and to be extremely fast, enabling the extreme localization precision gains demonstrated with MINFLUX. Despite the limiting read-out time, the camera-based techniques benefit from the parallelization of the approach, which removes the need to scan the sample. SIMPLE and SIMFLUX both record the signal directly on a sCMOS camera, whereas ROSE takes advantage of the use of a resonant mirror, splitting the emitted fluorescence into six sub-regions spread over two cameras: this allows multiple repetitions of each measurements within a single read-out time. ModLoc is based on using a series of Pockel cells and splits the fluorescence into four quadrants in the emission path to allow for 'phase unwrapping' and high precision axial localization.
5. Discussion and conclusions
Currently, the original MINFLUX implementation of meLM still achieves the highest spatial resolution with minimal photobleaching. This implementation based on a doughnut-shaped excitation pattern readily enables a variety of modalities, such as nanoscale imaging and tracking of single fluorophores. The parallelization of the meLM scheme has the advantage of increasing the achievable spatial resolution relative to SMLM, which is the current 'gold standard' for super-resolution microscopy, based on its simplicity and low cost of components to realize it. With the 'simple' addition of a well-characterized illumination pattern and by acquiring a few more images relative to SMLM, the wide-field implementations of meLM—SIMPLE, ROSE, SIMFLUX, and ModLoc—provide enhanced precision over large FOVs, making these approaches very powerful. However, to enable the high-gain capabilities across the entire field of view, allowing virtually unlimited resolution, the use of photo-switchable probes is required.
For practical purposes, a combination of both an initial localization of molecules, by peak finding or SMLM, followed by a meLM procedure, will likely be necessary in order to utilize the full potential of this new class of techniques. By combining meLM with machine learning to allow high-throughput data analysis [42–45] one can anticipate further improvements in quality and applicability of meLM for future life-science research. This should then enable true wide-field imaging of a large number of structures with extensions of less than 10 nm, which will open up new perspectives in the characterization of local macromolecular interactions within single cells. This could be particularly powerful in our on-going quest of unraveling the nanoscale structure of interphase chromatin. Based on these exciting prospects, we believe that it is well deserved to call meLM, in its various implementations, the fourth super-resolution method.
Acknowledgments
L R acknowledges support of a fellowship from 'la Caixa' Foundation (ID 100010434, LCF/BQ/IN18/11660032) and funding from the European Union´s Horizon 2020 research and innovation programme under the Marie Skłodowska-Curie grant agreement No 713673. V R acknowledges support from the Spanish Ministry of Economy and Competitiveness through the Program 'Centro de Excelencia Severo Ochoa 2013-2017', the CERCA Programme/Generalitat de Catalunya, MINECO's Plan Nacional (BFU2017-86296-P) and support from the CRG Advanced Light Microscopy Facility. S W acknowledges support from the Spanish Ministry of Economy and Competitiveness through the 'Severo Ochoa' program for Centres of Excellence in R&D (SEV-2015-0522), from Fundació Privada Cellex, and from Generalitat de Catalunya through the CERCA program.