

Abstract
Fiber Bragg grating (FBG) sensors are typically bonded on the surface of a structure using an adhesive to collect ultrasonic waves for damage detection in structural health monitoring applications. However, the ultrasonic wave transfer from structure to optical fiber suffers signal attenuation due to the adhesive bond layer, which has a significantly different acoustic impedance than the optical fiber. Therefore, this paper develops a systematic procedure to fabricate an aligned carbon nanotube (CNT)-wrapped FBGs for acoustic impedance matching. Specifically, we first develop an automated CNT winding system to fabricate CNT-wrapped FBGs with varying CNT layer thickness, which are bonded to an aluminum plate for ultrasonic sensitivity testing. We demonstrate that CNT wrapped FBGs do not necessarily produce an increased sensitivity as compared to a reference polyimide-coated FBG, however some outliers are observed with a significant improvement. Using a scanning electron microscopy we examine the cross-section of CNT/adhesive layers, identifying a unique CNT/adhesive bonding morphology with a stiff exterior shell and a relatively compliant inner layer. Finite element simulation validates that this two-layered bonding geometry is most likely the source of the increased FBG ultrasonic sensitivity for the outliers.
Export citation and abstract BibTeX RIS
Introduction
Fiber Bragg gratings (FBGs), have been widely applied for the detection of Lamb waves for structural health monitoring applications [1]. There are many advantages to using FBG sensors, as compared to conventional piezo-ceramic (PZT) sensors, for the detection of Lamb waves. These include the fact that a large number of FBGs can be multiplexed in a single optical fiber, the durability of silica in corrosive environments, and the immunity of FBGs to electromagnetic interference [1]. Further, FBG sensors can be closely spaced, allowing the separation of acoustic modes in the detected signals [2]. The signal-to-noise ratio of the Lamb wave detection remains a challenge for these sensors, however, primarily due to the need to couple a cylindrical optical fiber to the flat surface of the structure to be monitored. In addition the amplitude of the Lamb waves themselves are very low, making the extraction of relevant features from the measured signals challenging.
Previous approaches to improve the signal-to-noise ratio can be grouped into two categories; the first is to maximize the sensitivity of the FBG to strain in the optical fiber [3–7] and the second is to maximize the strain coupled to the optical fiber from Lamb waves in the structure by changing the bonding conditions [8, 9]. Both approaches can also be applied simultaneously. Examples of the first category include producing narrow bandwidth [3] or π-phase-shifted FBG designs to produce high spectral slopes for edge filtering [4, 5]. Another example is the use of ring laser resonance configurations to amplify the measured signal in the optical fiber [6]. Tuning the length of the FBG to maximize the Lamb wavelength-to-FBG length ratio can also increase the sensitivity of detection [7].
In this article we will focus on the second approach. A fundamental challenge to the measurement of acoustic emission or ultrasonic waves propagating through a structure with surface mounted FBG sensors is that the wave must be transmitted through an adhesive layer with low acoustic impedance to the silica optical fiber. Therefore we attempt to better match the acoustic impedance of the adhesive to the optical fiber and structure. A similar strategy was demonstrated by Moccia et al [9] who increased the sensitivity of FBG sensors to acoustic signals by reducing the acoustic impedance of the optical fiber coating for submerged hydrophone applications.
One recent method to increase the mechanical properties of adhesives is through the addition of carbon-nanotubes (CNTs). Previous authors have demonstrated CNT coatings on optical fibers, to create nonlinear optical interactions, however not at sufficient densities to significantly change their mechanical properties [10–16]. Typically, adding CNTs to bulk polymers or coatings results in a maximum performance gain at around a few percent weight addition [17, 18]. This is primarily due to the fact that the CNTs are typically short and randomly coiled and that CNT agglomeration occurs at a few percent volume fraction. Further the small size of the optical fiber creates a challenge to produce a uniform coating layer with highly oriented CNTs in the adhesive. Methods such as spin casting [19], layer by layer deposition [20], and dip coating [21] can create CNT enhanced layers with controlled thicknesses and some orientation of the CNTs, however not at sufficient levels to provide a significant increase in properties. The low aspect ratio of micron long CNTs also requires them to be heavily functionalized to achieve good load transfer between the matrix and the CNT. However this functionalization can weaken CNTs and lead to variability in the properties of the final coating [22].
In this article, we develop a conformal CNT coating on optical fibers by dry processing CNTs without functionalization and wrapping them onto the optical fiber using a filament winding approach. The coating thickness is controlled by the number of layers and the orientation of the CNTs is controlled by changing the winding speed and carriage velocity. The dry CNT coating is then impregnated with adhesive and the sensor bonded to a structure. We then measure the amplitude of ultrasonic waves coupled to the FBG from the same Lamb wave in the structure, for different coating parameters. The experimental and finite element (FE) simulation results indicate that increasing the bonding stiffness through CNT wrapping for acoustic impedance matching does not necessarily improve the FBG ultrasonic sensitivity, however some outliers show a significant improvement due to a unique two-layered geometry of the CNT/adhesive bonding layer.
Experimental methods
Filament winding of CNT coatings
Vertically aligned, spinnable CNTs arrays with a height of approximately 2 mm were synthesized using the floating catalyst chemical vapor deposition method described in Yildiz and Bradford [25]. Carbon nanotubes were grown in a low pressure, Iron (II) chloride catalyzed environment. Acetylene, argon, and chlorine gas were flowed through the furnace chamber at 760 °C. The CNTs were deposited onto quartz slides 2.54 cm wide by 7.62 cm long and 1 mm thick. The growth process occurred for 20 min, after which the furnace was cooled to room temperature under a flow or argon. As shown in figure 1(a), the substrate was then removed from the furnace and a spinnable CNT sheet was formed by teasing a CNT ribbon from the edge of the array.
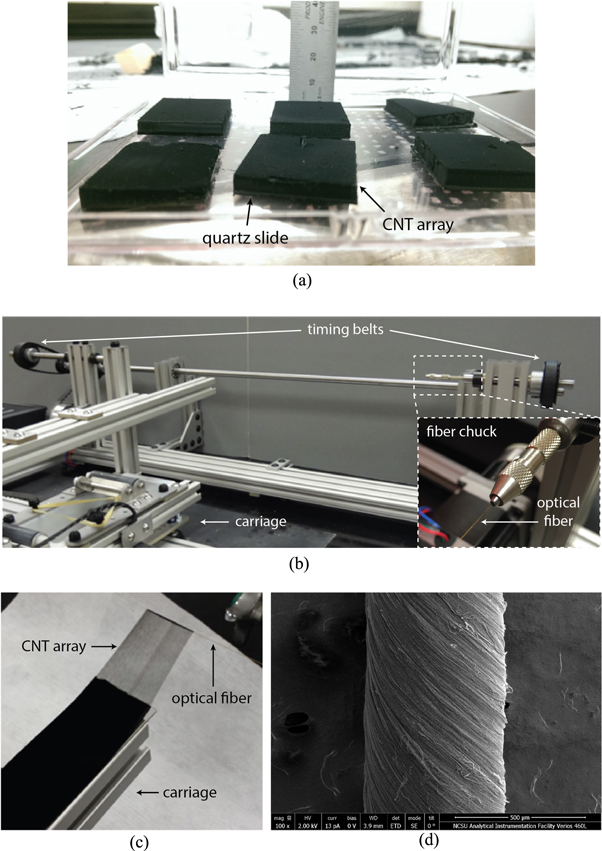
Figure 1. (a) Photograph of the CNT array grown on quartz slides (b) Filament winding machine. (c) Detail of CNT sheet wrapped onto an optical fiber. (d) CNTs wrapped around a polyimide coated optical fiber with 45° orientation relative to the fiber axis.
Download figure:
Standard image High-resolution imageThe CNT coatings were drawn from the CNT arrays using a modified filament winding apparatus, X-Winder, shown in figure 1(b). The mandrel of the original filament winding machine was replaced with a 125 μm diameter fused-silica optical fiber with 15 μm polyimide coating. The simultaneous rotation of both chucks allowed the optical fiber to be kept under tension without creating torsion of the optical fiber. The polyimide coating was left on the optical fiber to permit handling of the fiber and to protect the fiber from moisture ingress, known to weaken optical fibers. A conventional filament winding process could not be used because too much slack formed in the ribbon when transitioning the winding direction. The carriage velocity was kept constant at 0.762 mm s−1 for all samples and the angular velocity was 50 rpm for the samples used in these experiments.
The CNT ribbon was initiated by dragging a razor blade over the array and then transferred to the optical fiber, as shown in figure 1(c). As the filament began to wind, the van der Waals forces between the CNTs drew the subsequent CNTs from the array onto the optical fiber. These aligned CNT coatings were approximately 20 μm thick for a single layer. Winding angles from 45° to 90° could be obtained using this procedure. The angle of 45° was the minimum angle that achieved smooth winding on the small diameter optical fiber. A scanning electron microscope (SEM) image of a sample with 45° winding angle is shown in figure 1(d). For the experiments in this paper, commercially available SMF-28e polyimide-coated single mode optical fibers containing FBGs (Micron Optics) were wrapped with 10, 50, and 100 layers of dry CNTs at a 90° orientation with respect to the optical fiber axis. The wrapped section had a length of approximately 25 mm, to fully cover the FBG. The 10 layers of CNTs were determined to be the minimum number that could be applied while maintaining an even distribution along the length of the FBG. Due to their overall length each CNT wrapped the optical fiber approximately four times. The coating process was quick, with even the thickest coatings taking only two minutes to complete. The coatings were stable, but care was taken not to touch the CNT coatings on the optical fibers until they were ready for mounting.
Sensor mounting
Once the CNT arrays were wrapped around the optical fiber at the location of the FBG, the next challenge was to adhere the optical fiber to the structure, without damaging or distorting the CNT array. For these experiments the FBGs were mounted to 6061 aluminum flat plates. Figure 2 shows the mounting process using M-Bond 200 (cyanoacrylate) adhesive. The technique was modified from a standard technique used to mount foil strain gages.
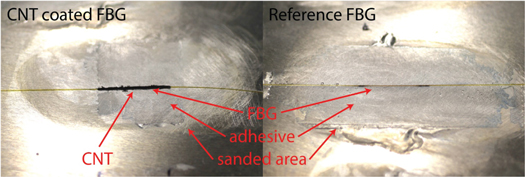
Figure 2. Photographs of CNT-wrapped FBG (10 layers) and reference bare FBG mounted on the aluminum plate. Discoloration around optical fiber is due to polishing of the plate.
Download figure:
Standard image High-resolution imageTwo to three drops of surface conditioner were applied on the surface of the plate to remove contaminants. The substrate surface was then polished with 320 and 400 grit sandpaper for 1 min each. A cotton swab was wetted with neutralizer and used to clean the polished surface. After preparing the substrate surface, the CNT-wrapped FBG sensor was soaked with two to three drops of M-Bond 200 catalyst using a pipette and was allowed to dry for 10 min. The adhesive side of two pieces of PCT-2M installation tapes were bonded face to face with one piece smaller than the other such that a small adhesive portion at the edge was exposed for bonding. The M-bond 200 Catalyst C was applied on the adhesive side of the tape and the polished substrate surface and allowed to dry for 1 min. Next the CNT-wrapped FBG was placed at the bond location and the M-bond 200 adhesive was applied along the length of the FBG. The tape was bonded on top of the CNT-wrapped FBG sensor with the catalyst side face down. To ensure close contact between the substrate and the optical fiber along the length, the optical fiber was gently pressed down with the tip of cotton swab. Finally the sensor was finger-pressed for 1 min to apply heat for curing. The specimen was then left at room temperature for 12 h to allow the adhesive to cure. Figure 2 shows the final images of an FBG wrapped with 10 layers of CNT arrays and a reference coated FBG bonded to an aluminum plate.
Amplitude testing
To compare the relative amplitude of the coupling of Lamb waves to the FBG between the different FBGs with varying numbers of CNT wrapping layers, 15 FBG sensors of length 10 mm were bonded to an aluminum plate with dimensions of 609.6 × 609.6 mm and 0.8 mm thickness. The 15 FBG sensors consisted of 4 with 10 layers of CNT wrapping, 4 with 50 layers of CNT wrapping, 4 with 100 layers of CNT wrapping and 3 reference FBGs with no CNT layers. The FBGs were all bonded radially around a PZT wafer actuator at the center of the plate, as shown in figure 3(a). The FBGs were 152.4 mm away from the PZT and orientated in the direction of the propagating waves. The PZT actuator predominately actuates the S0 Lamb wave in the plate and that is the wave that will be used for these experiments.
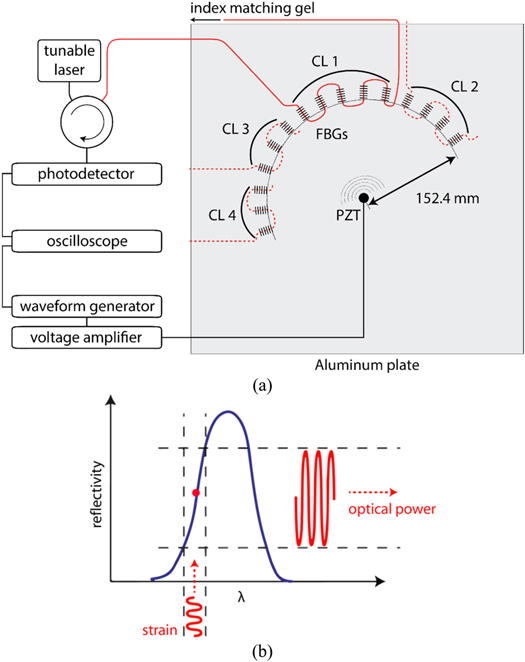
Figure 3. (a) Schematic of experimental arrangement. Optical fiber containing FBG sensors in cluster (CL) 1 (red line) is shown connected to equipment. Optical fibers for other clusters are shown as dashed red lines. (b) Edge filtering method.
Download figure:
Standard image High-resolution imageThe PZT was actuated with a 300 kHz 3-cycle tone burst sine wave from an arbitrary waveform generator (AWG), passed through an amplifier. This particular excitation frequency was chosen to generate only the fundamental Lamb wave modes. The tone bursts were synchronized with the measurement acquisition using the output trigger from the AWG. One end of the optical fiber is coupled to a tunable laser through a circulator, and the other is submersed in an index matching gel to prevent noise due to back reflections. The back reflection of the FBG sensor is passed through the circulator to the photodetector and measured using the edge-filtering method shown in figure 3(b). Using the edge-filtering method, low-amplitude wavelength fluctuations in the FBG are converted to higher-amplitude output power fluctuations in the FBG reflected signal. The response of each FBG is measured individually by tuning output of the laser to the midpoint of the FBG ascending edge of the reflected spectrum for each FBG. The linear edge slope is calibrated for every measurement by first measuring the entire reflected spectrum of each FBG. The reflected output power from the FBG is converted to strain on the FBG using [23]

where Vmeas. is the measured voltage, s is the edge slope of the FBG reflection spectrum calibrated for every measurement, pe is the photo-elastic constant for the optical fiber, and λB is the Bragg wavelength (pe = 0.22 for the sensors in these experiments). Thirty-two sets of data were taken and averaged for each FBG measurement.
The major challenge to obtaining accurate amplitude comparisons between the different sensors is to eliminate apparent sensitivity changes due to coupling and splicing losses. Therefore, sensors cannot be coupled and uncoupled between measurements. In these experiments, a maximum of 5 FBGs could be spliced together before the signal output was reduced below a reasonable signal to noise ratio. Therefore, instead of splicing all 15 sensors together, the spliced FBGs were divided into clusters, abbreviated as CL, as shown in figure 3(a). Each cluster contained a reference FBG with no CNT wrapping which was used to normalize the measurements between the different clusters. Measurements were performed with the first optical fiber connected to the instrumentation, then repeated with the second one, etc. One reference FBG had to be used twice for both the third and fourth clusters. The specifications of all FBG sensors in each cluster in listed in table 1.
Table 1. FBG specifications.
| Cluster (CL) | Bragg wavelength (nm) | CNT layers |
|---|---|---|
| 1 | 1568 | Reference |
| 1584 | 10 | |
| 1582 | 10 | |
| 1588 | 50 | |
| 1574 | 50 | |
| 2 | 1584 | Reference |
| 1578 | 10 | |
| 1576 | 50 | |
| 1588 | 100 | |
| 3 | 1584a | Reference |
| 1586 | 10 | |
| 1572 | 50 | |
| 4 | 1588 | 100 |
| 1580 | 100 | |
| 1586 | 100 |
aIndicated reference FBG was disconnected from cluster 3 and spliced to cluster 4.
Results
Figure 4 shows the input voltage signal to the PZT actuator and some example FBG response measurements. The presented plots are the output responses of a reference polyimide-coated FBG (1568 nm) and four of the 50 layer CNT-wrapped FBGs. The calculated peak-to-peak amplitudes of each FBG sensor are plotted in figure 5, grouped by the number of CNT wrapped layers. The peak-to-peak amplitude is defined as the average strain amplitude for the three peaks in the S0 mode. The reference FBG measurement is the case without any CNT wrapping. The standard deviation of the 4 reference FBG measurements is 0.158 με, which corresponds to a percentage value of ±8.6%. The data in figure 5 show that there is not a clear increase in the signal coupled to the FBG sensor, and that in fact the measured signal amplitudes from the CNT-wrapped FBG sensors are mostly lower than that of the reference FBG sensor. There is also not a clear trend in signal amplitude with the number of CNT wrapped layers. Therefore, increasing the acoustic impedance of the adhesive layer did not consistently enhance the Lamb wave transfer from the plate to the FBG for this CNT wrapping configuration.
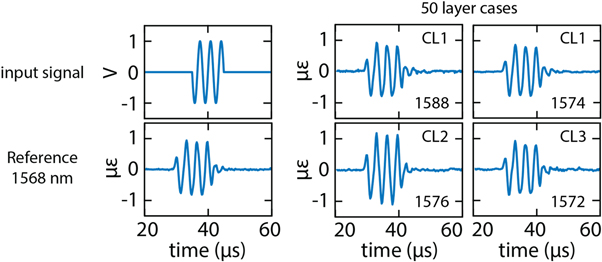
Figure 4. Input voltage signal to PZT actuator, and the corresponding FBG response of reference polyimide coated FBG and four of the 50 layer CNT-wrapped FBGs. CLs are the clusters shown in figure 3.
Download figure:
Standard image High-resolution image
Figure 5. Measured peak-to-peak amplitude of output FBG responses for the reference, polyimide coated FBG and CNT-wrapped FBGs with 10, 50, and 100 layers of CNTs.
Download figure:
Standard image High-resolution imageHowever, some sensors, marked with red arrows in figure 5, did measure a significant increase in output signal for the same input Lamb wave amplitude. These outliers were not limited to a single number of CNT wrapped layers. The largest signal increase was produced from the 100 CNT layer case, with an approximately 30% improvement compared to the reference FBG case. We next investigated the potential reasons for both the large variability in signal amplitude and the increase in signal amplitude for the selected outliers. Therefore, we look closer at the resulting CNT fiber distribution and coating quality on the sensors.
SEM images were collected of a series of CNT-wrapped FBGs to understand the variability in coating quality. The CNT-wrapped FBGs were first bonded at the edge of a carbon-fiber reinforced plate to facilitate cutting. The samples were cut using a diamond coated rotary saw. The samples were polished by hand using 400, 800, 1000, and 2000 grit sand paper for 5 min. This was followed by two final 5-min polishing cycles using alumina particles suspended in water with 300 nm and 50 nm particles.
Figure 6(a) shows a SEM image of one of the sample CNT-wrapped FBGs at 50× magnification. Two distinct regions can be seen in the coating region, the outer one where the adhesive is well cured and an inner region where the adhesive did not solidify. All samples produced similar images with two distinctive regions of the cross sections, however, the size of the uncured region varied considerably between the samples as shown in figure 6(b). Figures 7(a) and (b) show SEM images at 250× and 1000× magnifications respectively, taken at the regions marked as 1 and 2 in figure 6(a). Figure 7(a) shows the uncured-cured CNT/adhesive interface. The image clearly shows that only the outer layer of CNT/adhesive is cured, therefore creating a hard shell around the optical fiber. Figure 7(b) shows details of the optical fiber-CNT interface, showing that the CNTs are not adhered to the optical fiber. The CNTs within this region could be pulled out manually with tweezers.
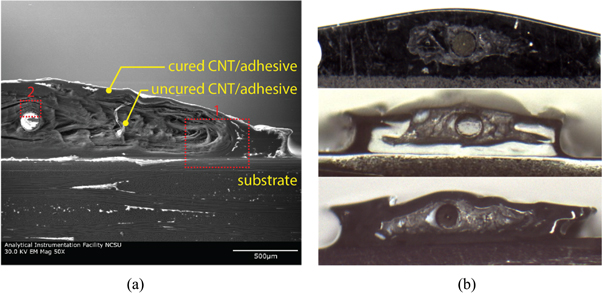
Figure 6. (a) Cross sectional SEM images of 100 layer CNT wrapped optical fiber and (b) optical microscope images of three different 100 layer CNT-wrapped optical fiber samples with varying uncured regions (white color is due to light reflection).
Download figure:
Standard image High-resolution image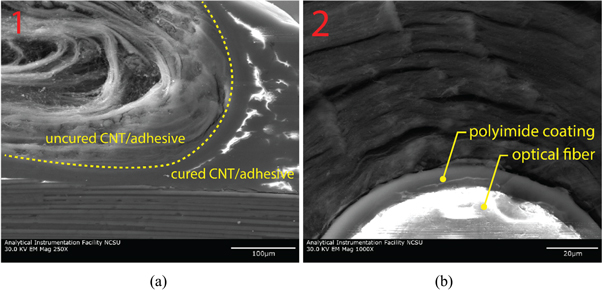
Figure 7. Detailed images of regions from figure 5 at (a) cured-uncured interface and (b) in vicinity of optical fiber.
Download figure:
Standard image High-resolution imageIt was hypothesized that the adhesive only partially penetrated into the interior region due to unevaporated propanol in the catalyst. The rate at which the catalyst evaporated was variable between the samples. Therefore we repeated the mounting process for a 100 layer CNT-wrapped FBG without applying catalyst. Figure 8 shows the SEM image of this sample at 100× magnification. The white circle in the center is the optical fiber and the surrounding region is the CNT/adhesive bonding. The bonding region is uniform throughout with some visible air voids.

Figure 8. Cross sectional image of 100 layer CNT-wrapped FBG mounted without the use of catalyst.
Download figure:
Standard image High-resolution imageThese SEM images indicate that some CNT/adhesive bonding cases form a two-layered structure with a cured exterior region and an under-cured region around the optical fiber due to catalyst, producing a significant increase in the FBG ultrasonic sensitivity. These outliers had a unique bonding morphology between FBG and CNT layers, therefore the optical fiber is free inside the shell. We initially attempted to estimate the relative acoustic impedance between these two differently cured regions, however finding their density and elastic modulus was not trivial for such complex geometry samples. Therefore, to validate the ultrasonic sensitivity increase observed with the two-layered case, we performed a FE analysis, presented in the next section.
Simulations
We performed a FE simulation to compare the dynamic displacement transfer between the nominally uniformly-cured and two-layered cases. Figure 9 shows a schematic of the two-dimensional FE model constructed using ANSYS. The simulation model does not represent the exact geometry seen in the SEM images, but is instead an idealized representation of the uniformly-cured and two-layered cases. Specifically we investigate the dynamic displacement transfer from the outer edge of the layer A (labelled as excitation) to the center of the optical fiber, with and without the presence of the compliant layer, Layer B.
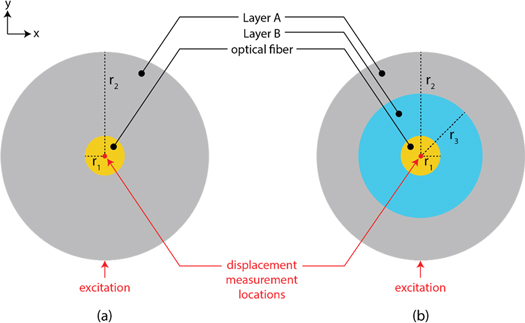
Figure 9. Two-dimensional FE simulation model of (a) uniformly-cured and (b) two-layered cases.
Download figure:
Standard image High-resolution imageThe bare optical fiber has a radius of r1 = 62.5 μm and the layer A, the uniformly-cured CNT/adhesive layer, has a radius of r2 = 200 μm. The thickness of layer A is estimated based on multiple SEM images of the 100 layer CNT/adhesive bonding case, including the ones shown in figure 6. For the case in figure 9(b), the radius of layer B is r3 = 137.5 μm. The densities of layers A and B was set to ρA = 2700 kg m−3. The elastic modulus of layer A was set to EA = 71 GPa, to match the stiffness to the aluminum plate. To test the effect of varying the impedance of the intermediate layer B, the elastic modulus, EB, was varied from 0.625 GPa to 71 GPa. A single-burst sine wave signal is applied to the bottom node indicated as 'excitation'. The model is spatially and temporally discretized based on the Lamb wave velocity as well as its wavelength in aluminum plate, resulting in the mesh size of Δz = 0.15 mm and the time step of Δt = 0.025 μs.
Figure 10 plots the peak-to-peak amplitudes of the displacement signal measured at the center of the optical fiber. The amplitudes are normalized with respect to the amplitude value of the uniformly-cured case, i.e. EB = 71 GPa. The simulation results show that decreasing EB increases the amplitude of the signal measured at the center of the optical fiber. At EB = 0.625 GPa, the amplitude is increased by the factor of 1.45 compared to the uniformly-cured case. The simulation results validate that the optical fibers that are not constrained by a stiff adhesive layer, but instead are free to move due to the intermediate, more compliant layer, produce a higher vibration due to the Lamb waves. Therefore, the outliers demonstrating an increase in signal amplitude in figure 5 are most likely due to the decreased modulus of CNT/adhesive layer in the vicinity of the optical fiber, caused by the under-curing of the CNT/adhesive.

Figure 10. Normalized peak-to-peak amplitude of the displacement signal measured at the center of the optical fiber. Red hollowed circle is the uniformly-cured case and blue solid circle is the two-cured layer case.
Download figure:
Standard image High-resolution image
Although this simulation is based on a fixed adhesive thickness of the cured and under-cured CNT layers, in reality the thickness of the two layers would depend on the evaporation rate of the catalyst as described in figure 6. The variation of those adhesive layer thicknesses can affect the overall adhesive effective modulus, and therefore changing the adhesive thickness-to-modulus ratio that subsequently affect the signal transfer. Overall, the experimental and simulation results indicate that the dynamic strain transfer from a structure to an optical fiber through an adhesive bond cannot be simply improved through the impedance matching of the adhesive bond, but rather should be optimized by tuning the adhesive mechanical properties, such as adhesive elastic modulus and adhesive thickness [24].
Conclusions
In this paper, we successfully demonstrated a filament winding process for the winding of oriented CNTs onto a small diameter, polyimide-coated optical fiber. The resulting dry CNT coating achieved a high CNT density with well controlled orientation between 45° and 90° to the axial direction and was successfully incorporated into a strain gage adhesive and mounting process. Most of the output signal amplitudes measured with the CNT-wrapped FBG samples are not increased as compared to the reference polyimide coated FBG case. However, a significant amplitude increase was observed from a few of the CNT-wrapped FBG samples. The cross section of the CNT-wrapped FBG samples revealed the presence of under-cured inner layer around the optical fiber, and the subsequent FE simulation validates that the two-layered structure with a stiff exterior layer and a much more compliant interior layer can produce a significant increase in the ultrasonic sensitivity of the FBG. It should be noted that the extremely high modulus of the CNT creates the especially large difference in properties between the CNT outer shell and the intermediate layer. While in this paper, we focused on the development of a CNT winding methodology and the detection of Lamb waves, there is also the potential to tune the properties of this outer shell layer through the winding direction of the CNTs in future work. Such abilities may even be helpful if the structure to be monitored is a composite structure with properties varying with direction. Finally, functionalizing the CNTs may also open the field to sensors with that are sensitive to different parameters in addition to the Lamb waves, such as the identification of corrosion in the structure.
Acknowledgments
The authors thankfully acknowledge the financial support of the Office of Naval Research (ONR) through grant number N000141410652.