

Abstract
We present a source of brilliant mid-infrared radiation, seamlessly covering the wavelength range between 1.33 and 18 μm (7500–555 cm−1) with three channels, employing broadband nonlinear conversion processes driven by the output of a thulium-fiber laser system. The high-average-power femtosecond frontend delivers a 50 MHz train of 250 fs pulses spectrally centered at 1.96 μm. The three parallel channels employ soliton self-compression in a fused-silica fiber, supercontinuum generation in a ZBLAN fiber, and difference-frequency generation in GaSe driven by soliton self-compressed pulses. The total output enables spectral coverage from 1.33 to 2.4 μm, from 2.4 to 5.2 μm, and from 5.2 to 18 μm with 4.5 W, 0.22 W and 0.5 W, respectively. This spatially coherent source with a footprint of less than 4 m2 exceeds the brilliance of 3rd-generation synchrotrons by more than three orders of magnitude over 90% of the bandwidth.
Export citation and abstract BibTeX RIS

Original content from this work may be used under the terms of the Creative Commons Attribution 3.0 licence. Any further distribution of this work must maintain attribution to the author(s) and the title of the work, journal citation and DOI.
1. Introduction
Broadband light sources are an important enabling technology for the spectroscopic study of molecular vibrations, helping to classify the chemical composition and conformation of a wide range of materials [1]. By illuminating a sample with broadband radiation, it becomes possible to study large ensembles of molecules in a widely parallel manner [2]. In particular, the infrared molecular fingerprint region, spanning from the near-infrared to the long-wavelength mid-infrared (MIR) (∼2–20 μm), can be used to probe a huge variety of vibrational molecular modes and overtones [3]. Such molecular resonances can provide new insights in the areas of atmospheric and trace-gas analysis [4], biomedical diagnostics [5, 6], and microscopy [7, 8].
For many applications, such as Fourier-transform infrared spectroscopy (FTIR), thermal radiation sources are most commonly employed for illumination. Such thermal sources rely on blackbody radiation generated by electrically heating a material. While this method is relatively simple in practice, the generated blackbody radiation is both temporally and spatially incoherent. Spatial incoherence reduces the achievable brightness (i.e. a highly spatially confined flux of photons), despite the Watt-level average powers emitted by thermal sources. While greater spatial coherence can be achieved using quantum cascade semiconductor lasers, such lasers typically have a narrow tuning range, limiting their use in parallel detection of multiple species [9]. In comparison to the laboratory workhorse of thermal blackbody sources, Synchrotron radiation sources can offer a high flux, ultra-broadband source of photons in the near-infrared and MIR spectral ranges [10]. In a synchrotron source, electrons are accelerated and stored in a large ring structure, generating a continuum of radiation spanning from the XUV to THz frequencies. Synchrotron sources offer a much higher brightness than thermal sources. However, the temporal coherence of such sources means that the output light can only be confined to nano- or picosecond pulse widths. Such pulse widths limit the temporal resolution of dynamical studies, and restrict the investigation of nonlinear phenomena. While such sources can alleviate some of the shortcomings of tabletop thermal sources, and indeed currently enable many state-of-the-art MIR studies [11, 12], the use of a facility scale particle accelerator as a light source makes it unfeasible for many studies and day to day measurements.
In recent years, the development of high-power, ultrafast laser sources has paved the way for a new class of broadband light sources. Temporal confinement of pulses to the sub-picosecond regime enables the exploitation of nonlinear phenomena only possible with high peak power sources. Parallel advances in optical fiber and waveguide design and materials have similarly allowed for increased spatial confinement of the electric field and further increases in peak power. Leveraging effects such as self-phase modulation [13], Raman self-frequency shifting [14], difference frequency generation (DFG) [15], and supercontinuum generation (SCG) [16], it is now possible to cover much of the electromagnetic spectrum using well established laser technology based in the visible and near-infrared. Such laser-based sources have the potential for generating super-octave broadband output spectra with high power and spatial coherence. Crucially, they can also provide the basis for ultrashort, waveform-stabilized pulse synthesizers, which can be exploited for time domain studies [17, 18] and pump-probe experiments [19], or through frequency comb techniques [20, 21]. At the same time, laser-based sources can maintain a small-footprint and low cost when compared with synchrotron sources, a vital component for ensuring the adoption of such technologies in a wide setting.
For the study of molecular vibrations, most of the interesting resonant modes are found in the band between 2 and 20 μm, often referred to as the molecular fingerprint region. The generation of light in this region is often challenging, due to the limited variety of existing laser gain media. In the field of ultrafast oscillators, much work has been done to push the emission toward longer wavelengths. Laser oscillator and amplifier systems have been developed utilizing fiber, bulk, and thin disk architectures based on holmium [22, 23], thulium [24–26] or chromium [27, 28] doped gain-media. Such advances now mean that it is possible to generate pulses with sub-picosecond, Watt-level powers, in the range of 1.9–2.5 μm. Pulses at these wavelengths can offer a good starting point for further nonlinear generation of broadband spectra to cover the entire MIR fingerprint region. In general, this is due to a smaller quantum defect associated with pumping at longer wavelengths, as well as better availability of MIR transparent crystals with higher damage threshold and nonlinear coefficients. Compared with systems pumped in the 1 μm spectral range, longer pump wavelengths can improve the available bandwidth [29] or average power [30]. Here, we describe a laser frontend based on a thulium doped fiber chirped pulse amplifier (Tm:FCPA). The Tm:FCPA offers 100 W level output at a 50 MHz repetition rate with a pulse duration of ∼250 fs. These pulses, spectrally centered at 1.96 μm, offers a stable and reliable driving source for further spectral broadening and nonlinear wavelength shifting techniques.
Nonlinear frequency conversion processes in the MIR region have typically fallen into two major categories; SCG via waveguide confinement, or parametric frequency conversion processes in nonlinear crystals. SCG in photonic crystal fibers (PCF) was first shown in the late 90 s as an efficient way to broaden the spectral coverage of an input femtosecond pulse [31]. Since then, SCG has been demonstrated in a wide range of waveguide materials such as silica [32], fluoride glass [33], ZBLAN [34], and silicon nitride [35], as well as different waveguide geometries, including step index fibers, PCF, tapered and planar waveguides. In order to access the longer wavelength fingerprint region, more traditional nonlinear parametric processes can be employed. Light sources in this region have been realized using optical parametric oscillation [36, 37], and DFG [15, 38]. One particular type of DFG process known as intra-pulse DFG (IDFG) has shown promise as a relatively simple method for waveform-stable MIR generation. Such sources offer tens-of-mW level MIR output powers with a super-octave spectral coverage [28, 29, 39–42].
In this work, we present a broadband source, capable of covering the majority of the molecular fingerprint region, with an output power spectral density on the order of 1 mW THz−1. The source is driven by a Tm:FCPA, detailed in section 2, with three output channels providing parallel spectral broadening. In the 2 μm wavelength region, a silica glass PCF provides a medium for soliton self-compression to the few cycle regime [43]. This channel covers the wavelength region of 1.33–2.4 μm, and is described in section 3. ZBLAN-based step index fibers offer good transmission into the MIR up to ∼6 μm. Their use to generate a supercontinuum spanning 2.4–5.2 μm is discussed in section 4. Section 5 presents a technique for coverage of the longer wavelength regime, provided by IDFG of 2 μm driving pulses in a Gallium Selenide crystal (GaSe) [42]. The driving pulses are precompressed to 32 fs pulse duration in another silica PCF before being focused into a GaSe crystal to generate a spectrum spanning 5.2–18 μm. Finally, in section 6, we compare the brightness of the laser-based source to both thermal and synchrotron sources, showing that the demonstrated source can significantly outperform state-of-the-art synchrotron beamlines at a fraction of the footprint and cost.
2. Thulium doped fiber amplifier
Figure 1(a)) shows a schematic of the frontend laser used to drive the three-channel spectral broadening. The system is based on a master oscillator power amplifier architecture. A fiber oscillator seeds a fiber-based CPA (Active Fiber Systems GmbH), whose output is subsequently split to drive the three parallel spectral broadening stages. The seed pulse train is derived from an erbium fiber oscillator operating at 1.5 μm with a repetition rate of 100 MHz (Menlo C-fiber). This commercial Er:fiber oscillator offers a stable (RIN of <0.1% rms from 1 Hz to 1 MHz) and reliable pulse train, as well as the opportunity to stabilize both the repetition frequency and the carrier envelope offset frequency of the pulse train. While not directly utilized in this work, this capability provides a starting point to ensuring and exploiting the full frequency comb nature of the following spectral broadening stages [44].

Figure 1. (a) Schematic layout of the fiber CPA used to generate a multi-octave infrared spectrum with 3 parallel spectral broadening techniques. (b) Spectrum of the CPA, centered at 1965 nm with more than 50 W output power at 50 MHz. (c) FROG measurement of the CPA temporal intensity envelope (solid line) with 254 fs pulse duration. The dashed line shows a Gaussian least-square fit to the intensity profile. (d) Relative power output of the CPA system measured with a thermal power-meter, showing drift-free output over multiple hours. (e) Relative intensity noise of the CPA system (black solid line) in the band 0.1 Hz–100 kHz. The solid grey line shows the background noise of the detector and spectrum analyzer, while the dashed line displays the integrated spectral noise, with a total of 0.5%.
Download figure:
Standard image High-resolution imageThe output of the erbium oscillator is reduced to 50 MHz using an electro-optic modulator based pulse picker, before being boosted with an erbium-doped fiber amplifier and then wavelength shifted to 2 μm. The input spectrum spans from 1545 to 1625 nm at the −10 dB level. Frequency down-conversion results from a Raman self-frequency shift generated in a nonlinear fiber, providing a seed spectrum (∼1900–2100 nm) that is overlapping with the gain bandwidth of the thulium-doped amplifier. The wavelength-shifted pulses are stretched using a chirped fiber Bragg grating (CFBG), which has a bandwidth of 50 nm centered at 1965 nm. The pulses are stretched to a duration of approximately 500 ps before being sent to the two-stage amplifier. The pre-amplifier boosts the average power of the pulse train from a few milliwatts to approximately 600 mW. The main amplifier fiber is a 3 m long large pitch photonic crystal fiber (LPF) [45], providing a maximum output power of 100 W. Both thulium-doped amplifier fibers are diode-pumped at a wavelength of 793 nm. The output of the main amplifier is sent to a free-space Treacy-type grating compressor housed in a vacuum chamber to avoid unwanted absorption by atmospheric water vapor and subsequent thermal air fluctuations [46].
At the output of the amplifier, the pulse train power is divided into 3 parallel channels using a series of half-wave plates and thin-film polarizing plates. Figure 1(b) shows the output spectrum of the CPA measured at this point using an optical spectrum analyzer. The output spectrum is approximately 50 nm wide at −30 dB from the peak and centered near 1965 nm, as defined by the reflection bandwidth of the CFBG. The compressed output of the amplifier is characterized by a home-built second harmonic generation frequency resolved optical gating (SHG-FROG) instrument. The recovered output temporal pulse envelope is presented in figure 2(c). The pulse is well described by a Gaussian pulse shape, with a full width at half maximum (FWHM) duration of 254 fs. The power stability of the system has been characterized using a slow, thermal power-meter, as well as a fast extended InGaAs photodetector and electronic spectrum analyzer. Figure 2(d) shows the power of the source recorded once per second over more than 5 h. The root mean squared (rms) output stability is less than 0.15%. The relative intensity noise of the pulse train has also been measured over the band 0.1–100 kHz. Figure 2(e) shows the relative spectral density of the fast fluctuations, as well as the integrated rms percentage over the same bandwidth, with a total of 0.5%.
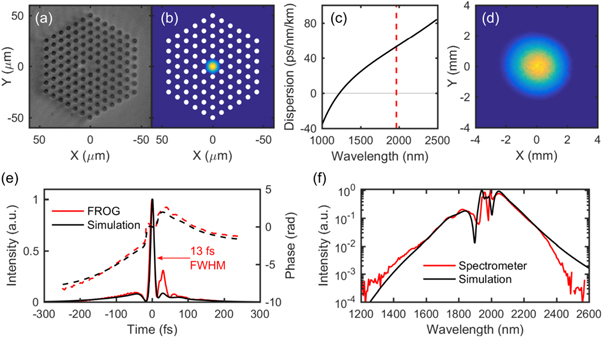
Figure 2. (a) Microscope image of the LMA15 PCF facet. (b) Calculated mode profile of the fundamental mode. (c) Dispersion profile of the LMA15 PCF. The dashed line indicates the central wavelength of the input spectrum for driving the self-compression process. (d) Collimated mode profile from the fiber output measured at a distance of 6 m using a 50 mm focal length silver parabolic mirror. (e) FROG measurement of the self-compressed output pulse (red line) compared to the simulated pulse (black). The dashed lines show the temporal phase of the FROG and simulated pulse. (f) Experimentally measured spectrum of the self-compressed source compared with the simulated spectrum.
Download figure:
Standard image High-resolution image3. Soliton self-compression in silica PCF
At wavelengths greater than 1.3 μm, silica glass exhibits anomalous dispersion, with a dispersion parameter D (measured in ps/nm/km) > 0. In a fiber, both the material as well as the waveguide properties contribute to the overall dispersion of light guided in a mode. In the case of solid-core PCF, the waveguide is formed from a pattern of cylindrical air holes placed in a solid material. Commonly, cylindrical inclusions are placed in a hexagonal lattice, with the waveguide core defined by one or more missing air-holes. Such PCF can provide tight confinement that strengthens the nonlinear effects of the propagating pulse, especially when driven by suitably high pulse energies [31, 32]. By operating in the anomalous dispersion regime, it is possible to engineer a situation in which the dispersion compresses the pulse, while the Kerr nonlinearity broadens the pulse spectrum through self-phase modulation, lowering the Fourier transform-limited pulse duration. By cleaving the fiber to the optimal length, the pulse at the output facet can be self-compressed to a nearly transform limited duration, eliminating the need for additional chirp compensation, e.g. chirped mirrors or prism compressors. Such a system is also very simple to implement practically, with high coupling efficiencies and beam quality routinely achievable.
In order to generate broad spectra near the output wavelength of the amplifier system, a 23 mm long piece of LMA15 PCF (NKT Photonics) was chosen. For simulation of the spectral broadening and temporal self-compression process in the fiber, its dispersion was first calculated. Using the PCF simulation tool CUDOSMOF [47], the effective refractive index  of the fundamental mode was calculated in the wavelength range from 0.5 to 2.5 μm using the multipole method. Due to the relatively large mode-field diameter (MFD), the waveguide contribution to the index is quite small. Once
  has been calculated, the dispersion parameter is calculated by
  where λ is the wavelength in meters and c is the speed of light in m s−1 [48]. The MFD is also determined from the calculated intensity distribution. Figure 2(a) shows a light microscope image of the LMA15 fiber facet with 5 layers of hexagonal air-inclusions in a silica matrix. Figure 2(b) shows the corresponding geometry of the fiber simulation as well as the intensity distribution of the fundamental mode at the pump wavelength. Figure 2(c) presents the calculated dispersion showing the positive value (anomalous dispersion) in the wavelength range from 1226 nm onward. Pulse propagation in the fiber was modelled with the Fiberdesk software tool [49], using the dispersion as well as input pulse parameters of 250 fs FWHM, Gaussian envelope, 84 nJ pulse energy, and MFD of 13.1 μm.
Coupling of the CPA pulses into the PCF was realized by free space coupling using a beam expanding telescope and 30 mm focus length plano-convex lens made from anti-reflection coated suprasil glass. At an incident power of more than 7 W, optimal spectral broadening was observed with an output power of approximately 4.5 W. At this point, the output pulse duration is at a minimum. Increasing the input power past this point generally leads to a collapse of the spectral bandwidth, with further increases leading to fiber damage due to over-compression and critical self-focusing of the beam inside the fiber [43]. The output beam was collimated with a silver off-axis parabola, so as to provide achromatic collimation and reduce unwanted dispersion of the output pulse. The collimated output beam profile is shown in figure 2(d), with a 4.3 × 4.0 mm2  beam diameter. The temporal profile was measured with SHG-FROG, while the spectrum was measured independently with an extended InGaAs array grating spectrometer (Ocean Optics NIRQUEST-256). The experimentally measured temporal pulse and spectrum are presented in figures 2(e) and (f) respectively. In each case the experimental values are compared with the simulated pulse obtained from the fiber geometry and ideal input pulse parameters as discussed above. The simulation is found to be in good agreement with the measured values, predicting a very similar pulse shape and spectral coverage of the source. The output pulse duration is measured to be 13 fs, with over 40% of the energy in the main peak (slightly less than the 46% of the simulated pulse). The spectrum spans from 1.4 to 2.5 μm at the −30 dB level. Some slight drop-off is observed in the long wavelengths (2300 nm onward), attributed to the roll-off of the spectrometer sensitivity as well as excess loss due to the spectrometer coupling fiber, and is not expected when compared to the simulated spectrum.
4. Supercontinuum generation in step index ZBLAN fiber
ZBLAN fibers show promise for applications in the MIR due to their low attenuation in the 2–5 μm region. Previous work with these fibers has demonstrated SCG and soliton formation as an efficient route to generating broadband MIR spectra using a variety of input pulse wavelengths and durations [50–52]. Here, we generate broad spectra from 2 to 5.2 μm using a ZBLAN fiber driven by 250 fs input pulses. The fiber used was a step index fiber fabricated by FiberLabs Inc. The core diameter of the fiber was nominally 6 μm (specified as ranging from 6 to 6.5 μm in the batch provided by the manufacturer). In order to identify a suitable fiber length and input power, the pulse propagation in the ZBLAN fiber was modelled similarly to the PCF self-compression as discussed in section 2. In this case, the dispersion parameter of the fiber is calculated by solving the unified dispersion equation of the step index fiber. In order to do this, the refractive index of the core and cladding material must be known. The Sellmeier coefficients of the core and cladding regions are listed in table 1. The resulting refractive index values  and
and  combined with the core radius
  and the light wavelength
  define the normalized frequency (or V number),
  The V number can be used to solve the unified dispersion equation for the LP01 fundamental mode of the step index fiber [53] at each wavelength, yielding
  over the spectral region of interest. The V number is also used to approximate the MFD
  according to the Petermann II definition [54].
Table 1. Sellmeier coefficients and formula for estimating the refractive index of the ZBLAN fiber core and cladding regions, as provided by the manufacturer.

|

|

|

|

|

|
|
|---|---|---|---|---|---|---|
| Core: | 0.341789 | 70.20172 | 0.920628 | 100.8285 | 0.305513 | 9951.441 |
| Cladding: | 0.507707 | 36.01478 | 0.717316 | 107.2653 | 0.243546 | 9895.962 |
|
||||||
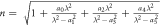
Figure 3(a) presents the dispersion curve calculated for a 6.4 μm core diameter ZBLAN fiber. In this case, 6.4 μm was chosen to best represent the qualitative broadening behavior observed in the experimental test fiber. The dispersion of the simulated fiber can vary significantly with the core diameter, leading to a shift in the zero-dispersion wavelength, and therefore a change at the pumping wavelength from normal to anomalous dispersion. Combined with the relatively large core size variation that can occur from the drawing of soft ZBLAN glass, it is more difficult to perform quantitative modelling of the exact experimental fiber parameter. However, the qualitative behavior of the simulated supercontinuum process can be instructive in guiding the design of the experiment. Figure 3(b) shows the results of a representative simulation using the dispersion of figure 2(a), MFD of 6.65 μm, 20 nJ pulse energy and 250 fs input pulse duration. The ZBLAN material parameters used in the simulation were 

 and
and  m2 W−1, representing the fractional contribution and time constants of the Raman response, as well as the nonlinear index, respectively [52]. The simulation shows the evolution of the spectrum as the pulse propagates along a 20 cm length of fiber. Self-phase modulation effects dominate during the early propagation, broadening the spectrum and introducing spectral modulations.
Figure 3. (a) Numerically calculated dispersion of the ZBLAN step index fiber with 6.4 μm core diameter. (b) Spectral evolution of a 250 fs input pulse with 1 W of average power over 20 cm propagation.
Download figure:
Standard image High-resolution imageHowever, after approximately 10 cm of propagation, the spectrum begins to broaden further. This behavior is due to self-compression of the pulse, leading to an increase in the peak intensity of the pulse and allowing for other nonlinear effects such as soliton fission and Raman self-frequency shift to take over and further broaden the spectrum toward 4.5 μm. This general behavior was observed for multiple different core diameters and input powers, with significant broadening usually occurring after approximately 10 cm of propagation. As a result, several lengths of fiber were tested, with a length of 12 cm being optimal.
Coupling of light into the fiber is achieved by using a 6 mm focal length aspheric lens made from BD2 glass (Thorlabs Inc.). The experimentally measured spectrum is presented in figure 4(a), for a 12 cm long fiber. The output spectrum contains 1.07 W of total power. Coated germanium longpass filters were used to select only the wavelengths longer than 2.4 or 3.6 μm. It is found that the spectrum contains over 216 mW of power at wavelengths greater than 2.4 μm, with 51 mW in the range of 3.6 μm and above. Figure 4(b) shows the relationship between total launched power and total output power, as well as the measured power behind each of the long pass filters. While in this case a total efficiency of ∼35% is reached, this figure can be improved by more suitable design of coupling optic and input mode matching, which should improve the overall efficiency of the MIR generation, as well as reduce thermal heating effects at the input facet. A broadband (2–5 μm) anti-reflective coated BaF2 lens was used to collect the light from the fiber output. As expected from a fiber output, the emitted mode is quite clean, with single mode behavior observed. Figure 5(a) presents the measured mode profiles of the collimated beam measured with no spectral filtering, as well as behind a 2.4 μm and 3.6 μm longpass filter, confirming that the output was confined to the fiber core even with an octave spanning spectrum. The output power of the fiber was also tracked over the course of an hour to gauge the stability of the source. Figure 4(d) shows the measured power over the course of 60 min showing less than 1.3% rms power fluctuations over this time period. It was observed that after some initial thermalization of the fiber at the input facet, the input coupling and output power remains stable thereafter.

Figure 4. (a) Experimentally measured supercontinuum spectrum generated in a ZBLAN fiber. Due to the broad bandwidth of the output spectrum, three spectrometers were used, a silicon array grating spectrometer, an extended InGaAs array grating spectrometer, and an FTIR spectrometer with a thermal detector. (b) Plot of input power versus output power showing a coupling efficiency of 35%, as well as the power evolution of the MIR components after the onset of supercontinuum broadening. (c) Collimated beam profiles captured 3 m after the fiber output. (d) Power stability of the ZBLAN fiber output in the spectral range of 2.4–5.5 μm over a 1 h period with 1.3% rms fluctuations.
Download figure:
Standard image High-resolution image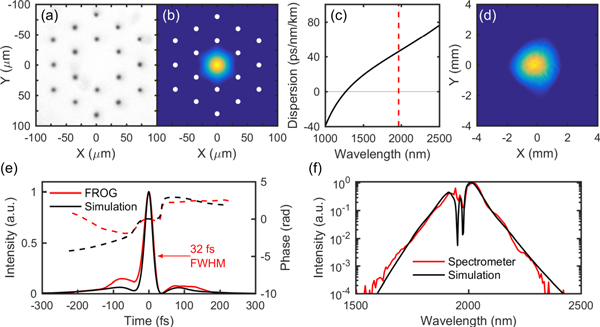
Figure 5. (a) Microscope image of the LPF40 PCF facet. (b) Calculated mode profile of the fundamental mode. (c) Dispersion profile of the LPF40 PCF. The dashed line indicates the central wavelength of the input spectrum for driving the self-compression process. (b) Collimated mode profile from the fiber output measured at a distance of 4 m using a 100 mm focal length silver parabolic mirror. (c) FROG reconstruction of the self-compressed output pulse (red line) compared to the simulated pulse (black). The dashed lines show the temporal phase of the FROG and simulated pulse. (d) Experimentally measured spectrum of the self-compressed source compared with the simulated spectrum.
Download figure:
Standard image High-resolution image5. Intra-pulse DFG in GaSe
Parametric frequency downconversion of light from the near-infrared to the MIR and terahertz domain is capable of generating extremely broadband ultrashort pulses [55]. While devices such as optical parametric oscillators and amplifiers can provide high conversion efficiency, practical implementations of such a system often require synchronizing multiple pump and signal beams, while locking their spatial and temporal overlap to ensure a stable nonlinear mixing process [38]. Intra-pulse DFG relies on a single broadband driving pulse, providing both pump and signal photons simultaneously, eliminating the need for tight temporal and spatial overlap control. By phase matching in a suitable nonlinear medium, opposite wings of the broad input spectrum can mix and generate photons in the MIR. Recently IDFG has been shown to afford conversion efficiencies greater than 1% while maintaining more than one octave of bandwidth [41, 42]. In particular, by driving with a central wavelength of 2 μm it is possible to take advantage of the higher damage threshold and broader phase matching bandwidth provided by crystals such as gallium selenide (GaSe), while exploiting a lower quantum defect [56]. Importantly, a significant advantage of this approach is that because both signal and pump photons are derived from the same beam, the output idler pulse train is intrinsically phase stabilized [30]. Such a waveform-stable output field, with constant phase between the carrier field and the intensity envelop of the pulse, enables straightforward use of field-resolved and frequency comb based techniques for precision spectroscopy.
The IDFG process relies on a broadband driving spectrum, with the total bandwidth determining the spectral position of the generated MIR idler frequency. To achieve a broad spectral coverage in our system, the 250 fs pulses generated by the thulium fiber amplifier are pre-broadened before IDFG. Again, self-compression in a micro-structured silica fiber is employed, similar to the process described in section 3. In order to find a compromise between a broad driving spectrum and a high average power, a larger mode area fiber (LPF40) was chosen as the self-compression stage. Figures 5(a)–(c) shows a microscope image of the fiber facet with a core diameter of 40 μm along with the calculated mode distribution and fiber dispersion. At a pump input power of approximately 33 W, a broad spectrum is achieved with over 90% efficiency. Figure 5(d) shows the beam profile after collimation with a 100 mm focal length silver parabolic mirror, with a  beam diameter of 3.1 mm. SHG FROG of the pulse reveals a 32 fs pulse with a corresponding −30dB bandwidth of 1640–2300 nm, as seen in figures 5(e) and (f), with both the temporal envelope and spectrum, respectively, agreeing well with the simulated output. The collimated beam is focused into a 1 mm thick GaSe crystal with a
  focal diameter of approximately 160 μm. After mixing in the nonlinear medium, the driving 2 μm beam is separated from the generated MIR using a gold-coated diffraction grating designed for use as a longpass filter [57]. In this geometry, approximately 500 mW of MIR light is generated at the output crystal face, with an overall efficiency of approximately 2%.
The IDFG process can be visualized by examining the spectrum of the driving beam after the GaSe crystal. By changing the orientation of the crystal axis with respect to the input beam polarization, the generation efficiency of the DFG process can be changed. Figure 6(a) shows the spectrum with the MIR generation effectively switched on and off. The difference in intensity shown in figure 6(b) illustrates the depletion of the low frequency pump and parametric amplification of the higher frequency signal photons. Considering every possible combination of pump and signal photons, this measurement suggests idler frequencies in the range of 14.5–60 THz, which is seen to agree well with the generated idler spectrum in the inset of figure 6(a).
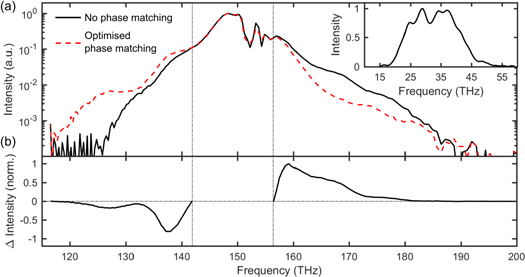
Figure 6. (a) Spectrum of the driving 2 μm spectrum measured with (solid) and without (dashed) IDFG phase matching of the GaSe crystal. (b) Normalized difference in intensity between the 2 lines in (a), showing the depletion and parametric gain of the pump and signal photons in the ∼120–140 THz region and the ∼160–180 THz region respectively. The difference in frequency between the pump and signal spectral regions correspond to the idler spectrum shown in the inset of (a), measured with an FTIR spectrometer.
Download figure:
Standard image High-resolution imageIn order to measure the spectrum of the idler with a higher dynamic range, the MIR field is measured using electro-optic sampling (EOS). The probe pulse used in the EOS detection of the MIR field is the 13 fs long 2 μm pulse from section 3. EOS works through the combination of heterodyne detection and a sum-frequency generation of the MIR beam with the time delayed probe pulse, providing a direct time-domain measurement of the idler electric field [58]. Our previous work has shown that the generated MIR pulse train is waveform-stable, with a sub-100 fs duration compressible to a single cycle [42]. Through the Fourier transform of the field, the full spectrum of the MIR pulse can be measured, spanning from approximately 5 to 18 μm (see figure 7).

Figure 7. (a) Power spectral density of the presented 3-channel source. (b) Calculated brilliance of the laser-based, tabletop source compared with an IR synchrotron beamline facility and a standard 1500 K blackbody source [10]. The ripples in various spectral regions are due to self-phase modulation (PCF), CO2 absorption at 4.3 μm, water vapor absorption between 5 and 7 μm, as well as some ripples in the spectrum at longer wavelengths, which are attributed to artefacts of the EOS detection process, and are not observed in an FTIR spectral measurement.
Download figure:
Standard image High-resolution image
6. Conclusions and outlook
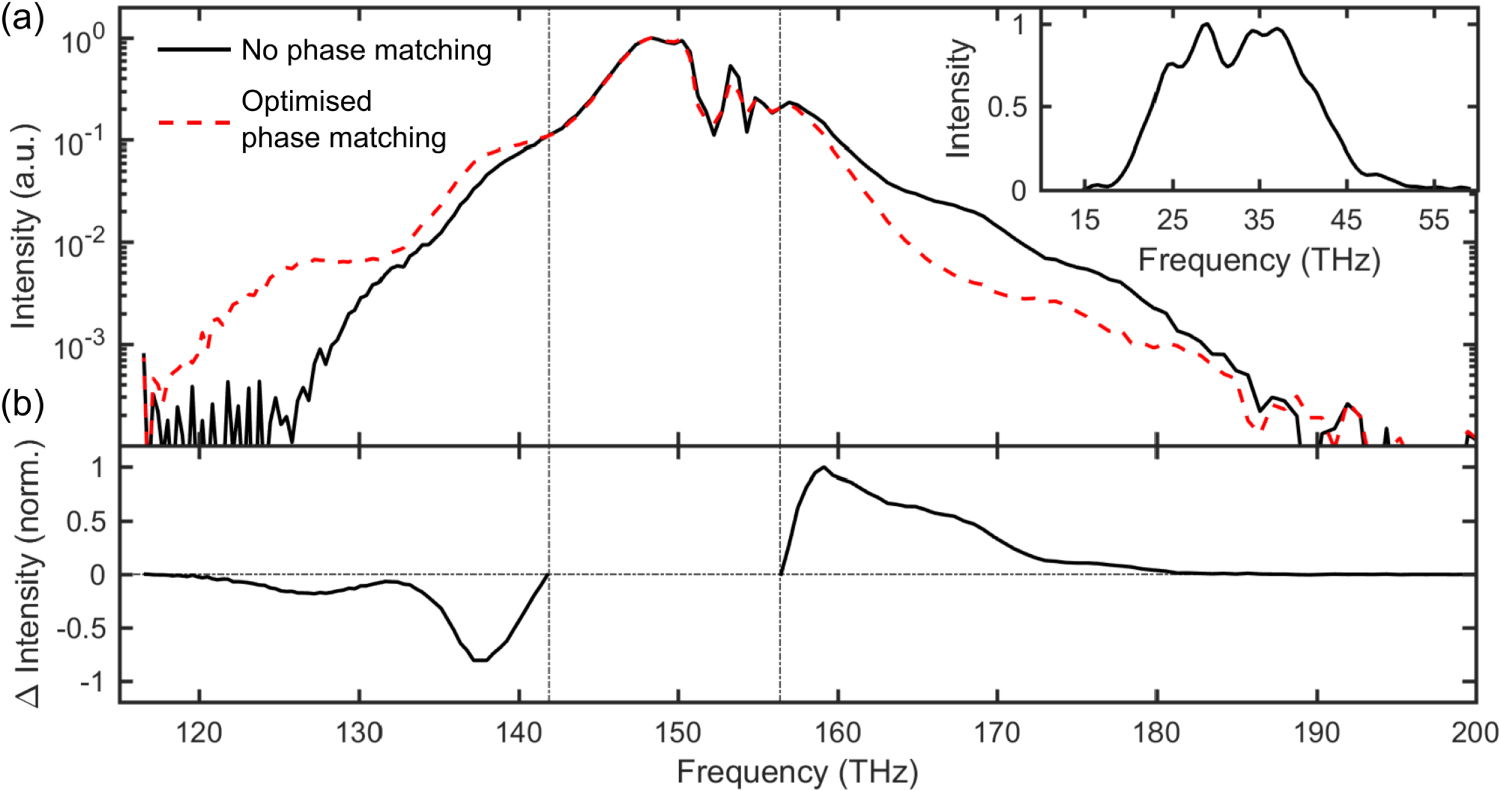
Due to the high average power available from the thulium fiber frontend, it is possible to simultaneously operate each of the three generation channels. Figure 7(a) presents the output power spectral density (PSD) of each channel plotted on a common frequency axis, covering a frequency band of 16.7–225 THz (1.33–18.0 μm) at a threshold of 0.1 mW THz−1, corresponding to  octaves of total bandwidth, with a median PSD of 3.0 mW THz−1 (0.09 mW−1 cm−1). This value is comparable to other multi-channel, high-repetition rate MIR supercontinua that have been demonstrated in the 1–10 μm range [29], and is higher than both typical synchrotron [5, chapter 14] or single-channel waveguide [16] sources.
In order to compare the current performance of this system to other standard broadband infrared sources, we use the spectral brilliance as a figure of merit. The definition of the brightness describes the photon flux of the source (in ph s−1) inside a certain spectral window (usually defined as 0.1% of the bandwidth at each frequency), as well as the focusability and beam quality of the source (encompassing the focal spot size (mm2) and divergence (Sr)) [59]. The total brightness of the source is then expressed in units of [ph s−1 mm−2 sr−1/0.1% BW].
Figure 7(b) presents the brightness of the three-channel source compared to that of a third-generation synchrotron (DIAMOND B22, UK), as well as the brightness expected from a thermal blackbody source at 1500 K [10]. The laser-based multi-octave source offers a higher brilliance compared to the synchrotron source across its entire bandwidth, with an improvement factor of over 3 orders of magnitude over 92% of the spectrum. Even at the weakest point, the laser-based source offers over an order of magnitude more brightness in an optical-table-sized footprint than a facility-sized synchrotron beamline.
The availability of a device offering orders of magnitude increased performance at fraction of the cost compared with modern synchrotron light sources opens up new avenues in exploiting broadband light sources for spectroscopic applications. One further important advantage that laser-based sources can offer is the ability lock the carrier envelope offset of the pulse. Considering that the long wavelength DFG spectrum is intrinsically waveform-stable, and both PCF [44] and fluoride fiber [33] broadening should preserve the coherence of the multi-octave output, it is conceivable that such a multi-channel synthesis could produce high-repetition rate sub-cycle transients [60]. For example, the full spectrum in figure 7 supports an ∼5 fs Fourier transform limited pulse duration at a center frequency of 137 THz (7 fs period).
With such increased spatial and temporal coherence over traditional IR light sources, laser-based supercontinua could in the future become reliable and powerful engines for future FTIR, frequency comb, time- and field-resolved studies in a wide range of applications. In this work, we have described a device that has the potential to fill such a role. Based on a thulium-doped fiber amplifier and master oscillator system, the high average power source can generate more than 3 octaves of bandwidth in the MIR spectral region, with a high output power and exceptional brightness. Although utilizing nonlinear spectral broadening techniques, the system is implemented with only optical fibers and a single beam nonlinear crystal stage, leading to a stable output and relatively simple arrangement.