

Abstract
Increasing heatwaves are making cities and their populations more vulnerable, parallel to urban sprawl and the aging population in Hungary. The increasing number of hot days is predicted to worsen urban climate anomalies at the local scale, which, in parallel with changing land use patterns, may contribute to a significant increase in vulnerability to heatwaves. Local stakeholders and decision-makers need to understand the critical role of spatiotemporal land use—land cover (LULC) patterns and urban climate aspects to address relevant challenges for urban development. The current literature does not contain a synthesis analysis of major Hungarian cities that includes urban climate and sustainability findings hand by hand; therefore, this study aims to analyze LULC patterns, urban hotspots and surface urban heat island effects. In addition, the Normalized Difference Vegetation Index (NDVI) was determined as an important indicator for assessing the health and density of green spaces in major Hungarian cities from 2006 to 2018 using remote sensing data. Our results show that each city experienced significant urban sprawl, while above-average NDVI areas decreased over time. The average increase in the share of built-up areas was 1.3% from 2006 to 2018, while the calculated average decline in agricultural areas was 2%, so the expansion of residential areas and artificial areas is not the only driving force of this shrinking trend in agricultural areas. Furthermore, we found that urban hotspots are generally concentrated in industrial areas and represent new spaces of heat islands on the outskirts of cities. Székesfehérvár has the most intense industrial heat islands, with the largest proportion of urban hotspots (approximately 3.5% of the total area) concentrated in industrial zones. Our study contributes to uncovering inter-urban processes of land use patterns and urban climate issues in major Hungarian cities, moreover revealing sustainability-related issues from a lock-in perspective.
Export citation and abstract BibTeX RIS

Original content from this work may be used under the terms of the Creative Commons Attribution 4.0 licence. Any further distribution of this work must maintain attribution to the author(s) and the title of the work, journal citation and DOI.
Introduction
Cities are at the forefront of climate change studies due to social, economic, and environmental factors [1]. From a social point of view, 55% of the global population is currently living in urban areas, and this number is projected to increase by 70% until the mid-21 st century [2]; moreover, 80% of the global energy consumption and over 70% of greenhouse gas emissions are associated with cities [3]; finally, the economic power is also concentrated in urban areas [4]. It can be stated that cities have a pivotal role in both mitigation [5, 6] and adaptation activities [7], aiming to reduce the adverse effects of climate change by taking well-targeted and effective actions [8, 9]. In order to provide detailed information to local decision-makers, addressing micro and mesoscale urban climate patterns is essential by analyzing different aspects of local features, such as LULC patterns [10], urban heat island (UHI) characteristics [11], the role of green areas regarding cooling benefits [12] through the normalized difference vegetation index [13], urban hotspots [14], or the presence of surface urban heat island [15, 16]. For these purposes, remote sensing data are commonly used [17, 18] along with GIS-supported analyses [19].
Papers dealing with applied urban climate issues are at the forefront of current urban studies [1]. As climate change makes cities more vulnerable, modeling urban climate patterns from a spatial [20] and temporal perspective [21] is necessary to identify effective and well-designed development actions in order to enhance mitigation and adaptation co-benefits [22]. One of the main sustainability- and climate-related issues regarding urban areas is the LULC change [23, 24]. Changing the inherently high proportion of impervious surfaces in our cities contributes to the worsening of the existing urban surface heat island effect; therefore, heat discomfort is predicted to increase in larger areas and NDVI values are also expected to decrease [25, 26]. LULC patterns have been frequently analyzed by numerous researchers in recent years by applying various techniques based on remote sensing data to identify a new dynamic phenomenon to be integrated into urban development planning processes to improve urban sustainability [27]. LULC aspects are rarely examined separately from other relevant urban climate issues; however, a new direction in predicting land use patterns through the application of geospatial software and techniques can be found in the literature [28]. Since LULC patterns are rarely analyzed as a stand-alone challenge of urban areas, scholars often involve other urban climate aspects in their studies, such as LST [29], urban air quality [30], urban hotspots [31], or UTFVI [32]. In this study, we used the Urban Atlas database to obtain detailed LULC information on the selected cities. This technique and database are widely used in recent urban studies [33, 34]; even Hungarian scholars used Urban Atlas data for urban green space provision analyses in Szeged [35], or to assess urban sprawl patterns in the case of Budapest [36].
In addition to LULC analyses, LST calculations based mainly on remote sensing data have gained significant importance and popularity in the urban climate literature [37]. LST plays a central role in assessing various urban climate patterns by applying numerous datasets, methods and applications [38], formulating one of the main components of current urban studies. The most widespread application of LST calculations is SUHI analyses: SUHI intensity, interannual variability, and long-term trends of SUHI are all among the recent utilization of LST data as a proxy for the SUHI phenomenon [39]. Furthermore, since LST has numerous definitions, some studies aimed to develop new and innovative methods to calculate LST [40, 41], indicating a constantly evolving research area that plays a crucial role in various scientific fields by providing useful information about cities, dynamics and location-specific characteristics. When choosing the methodology and LST calculation, the selection of a data set is crucial: according to [42], Landsat and MODIS are the most commonly used sensors, accounting for almost 80% of the total SUHI analyses in the literature.
Based on the results of LST calculations, two widely used urban climate indicators can be found in the literature: urban hotspots and UTFVI categories. Urban hotspots can be characterized by the highest temperature within a city and constitute those areas that are completely uncomfortable for human activities [14]. Thermal infrared remote sensing data is the basis for spatio-temporal urban hotspot analysis, contributing to more effective and targeted urban planning processes [43]. Urban hotspots were identified and calculated in conjunction with urban form dynamics and LST trajectories [44]; urban sprawl and LULC change patterns in the case of Indian metropolises [45]; as well as local climate zones to formulate potential heat mitigation zones during the urban planning phase [46]; or predicting urban hotspots contributes to sustainable resource management in future smart cities [47], to name just a few examples of the application of this phenomenon in various areas of urban research. Finally, the literature uses a generally accepted categorization of UTFVI zones [48] and converts these values into ecological assessment indices based on the local LST characteristics, ranging from the 'excellent' to 'worst' categories [49]. According to the common definition, UTFVI refers to thermal comfort, similar to the urban hotspots introduced previously; however, the LST categories are transformed into an ecological index that sheds light on complex thermal comfort issues [50–52]. According to this literature review, it can be found that various urban climate analyses aimed at revealing SUHI anomalies, urban hotspots, or UTFVI zones are widespread among the published thematic papers. In addition, several studies included LULC assessments and NDVI analyses, often in parallel with one or more urban climate aspects; however, the critical assessment of the driving forces that contribute to the deterioration of these values, alongside changing climate patterns, represents a relevant gap in the literature. Additionally, it is worth noting that due to the overlapping issues of sustainability and urban climate anomalies, infrastructural lock-ins should also be considered [53]. Infrastructural lock-ins are a fairly common phenomenon in cities, as built-up areas determine long-term path dependencies [54]; therefore, they can preserve unsustainable urban forms and the thermal discomfort of residents.
Hungarian cities situated in the Carpathian basin face significant changes regarding climatic patterns: according to regional climate models [55–57], intensifying heatwaves are projected to occur in parallel with the seasonal dynamics of precipitation patterns and intensity. Moreover, Hungarian cities can be described with relatively high sensitivity and low adaptive capacity through their aging population, ineffective health facilities, and urban sprawl processes [36, 58–60]. Besides future-oriented studies, the Hungarian Meteorological Service provides homogenized climate data series from 1870 to 2021 for ten cities (https://odp.met.hu), allowing us to analyze historical trends. In the case of the major Hungarian cities included in our analysis, the data shows clear trends in the increasing number of days when the maximum temperature exceeded 30 °C. Since the 80 s, there has been a really sharp increase in hot days from around 100 °C–150 °C days in a decade to 300–400 such days between 2011 and 2020. Obviously, significant differences can be seen between cities; However, the increasing direction of dangerously hot days in our study area is crystal clear and poses a significant threat to the population of these cities in the coming decades.
Coupling the above-introduced past trends and future projections, there is a massive need for analyzing and understanding the urban climate patterns of Hungarian cities to develop better and well-targeted urban strategies, contributing to decreasing the climate vulnerability of these urban areas. Nevertheless, the number of studies focusing on urban climate aspects regarding Hungarian cities needs to be improved in the current literature, considering the reduced number of analyzed urban areas. It can be stated that the most studied cities are Budapest [61–63], Szeged [64–67], Pécs [68, 69], and Debrecen [70], moreover an assessment of night-time climate index for selected Carpathian basin cities by [71].
Consequently, much is known about challenges and problems at the local or micro level; however, less is known about comprehensive aspects such as the interconnection of sustainability-related drivers such as LULC patterns and the associated impacts on the urban climate in Hungarian cities. Therefore, our study aims to fill the above-mentioned literature gap by comparatively analyzing LULC patterns and urban climate aspects in major Hungarian cities as generally under-researched areas over time. In the following section, we will see that urban climate analysis and LULC assessments are widely used in the literature; nevertheless, a critical analysis of the revealed aspects, taking into account broader sustainability issues, is not a common point of published works, especially in the Central and Eastern European region. To this end, we used remote sensing data to reveal LULC changes from 2006 to 2018. We calculated the Normalized Difference Vegetation Index (NDVI) values, urban hotspots, and surface urban heat island intensity (SUHI) using the urban thermal field variance index to analyze the selected urban areas. Consequently, our work can contribute to expanding the literature in two ways: first, it addresses a generally under-researched area by providing a comparative analysis of major Hungarian cities over time with respect to different urban climate patterns; second, to the best of the authors' knowledge, no new research findings on major Hungarian cities incorporating sustainability-related drivers and future challenges have been published so far.
Methodology
This paper focuses on major Hungarian cities with over (or just under) 100,000 people. These cities can be considered as the best study areas for analyzing urban climate patterns over time since the availability of remote sensing data from the early 2000 s to the second half of the 2010 s or even today. As depicted in figure 1, Budapest stands out with its remarkable population, home to over eight times the number of people compared to the second most populous city, Debrecen. However, the land area of Budapest no longer shows that much difference compared to other cities, indicating a remarkably high population density [3211.26 people km−2]. Apart from the population-related aspects, it is worth noting that the selected urban areas represent all statistical regions in Hungary (see figure 1). Therefore, analyzing and understanding urban climate and LULC patterns in these cities can also provide insights into limited regional consequences.
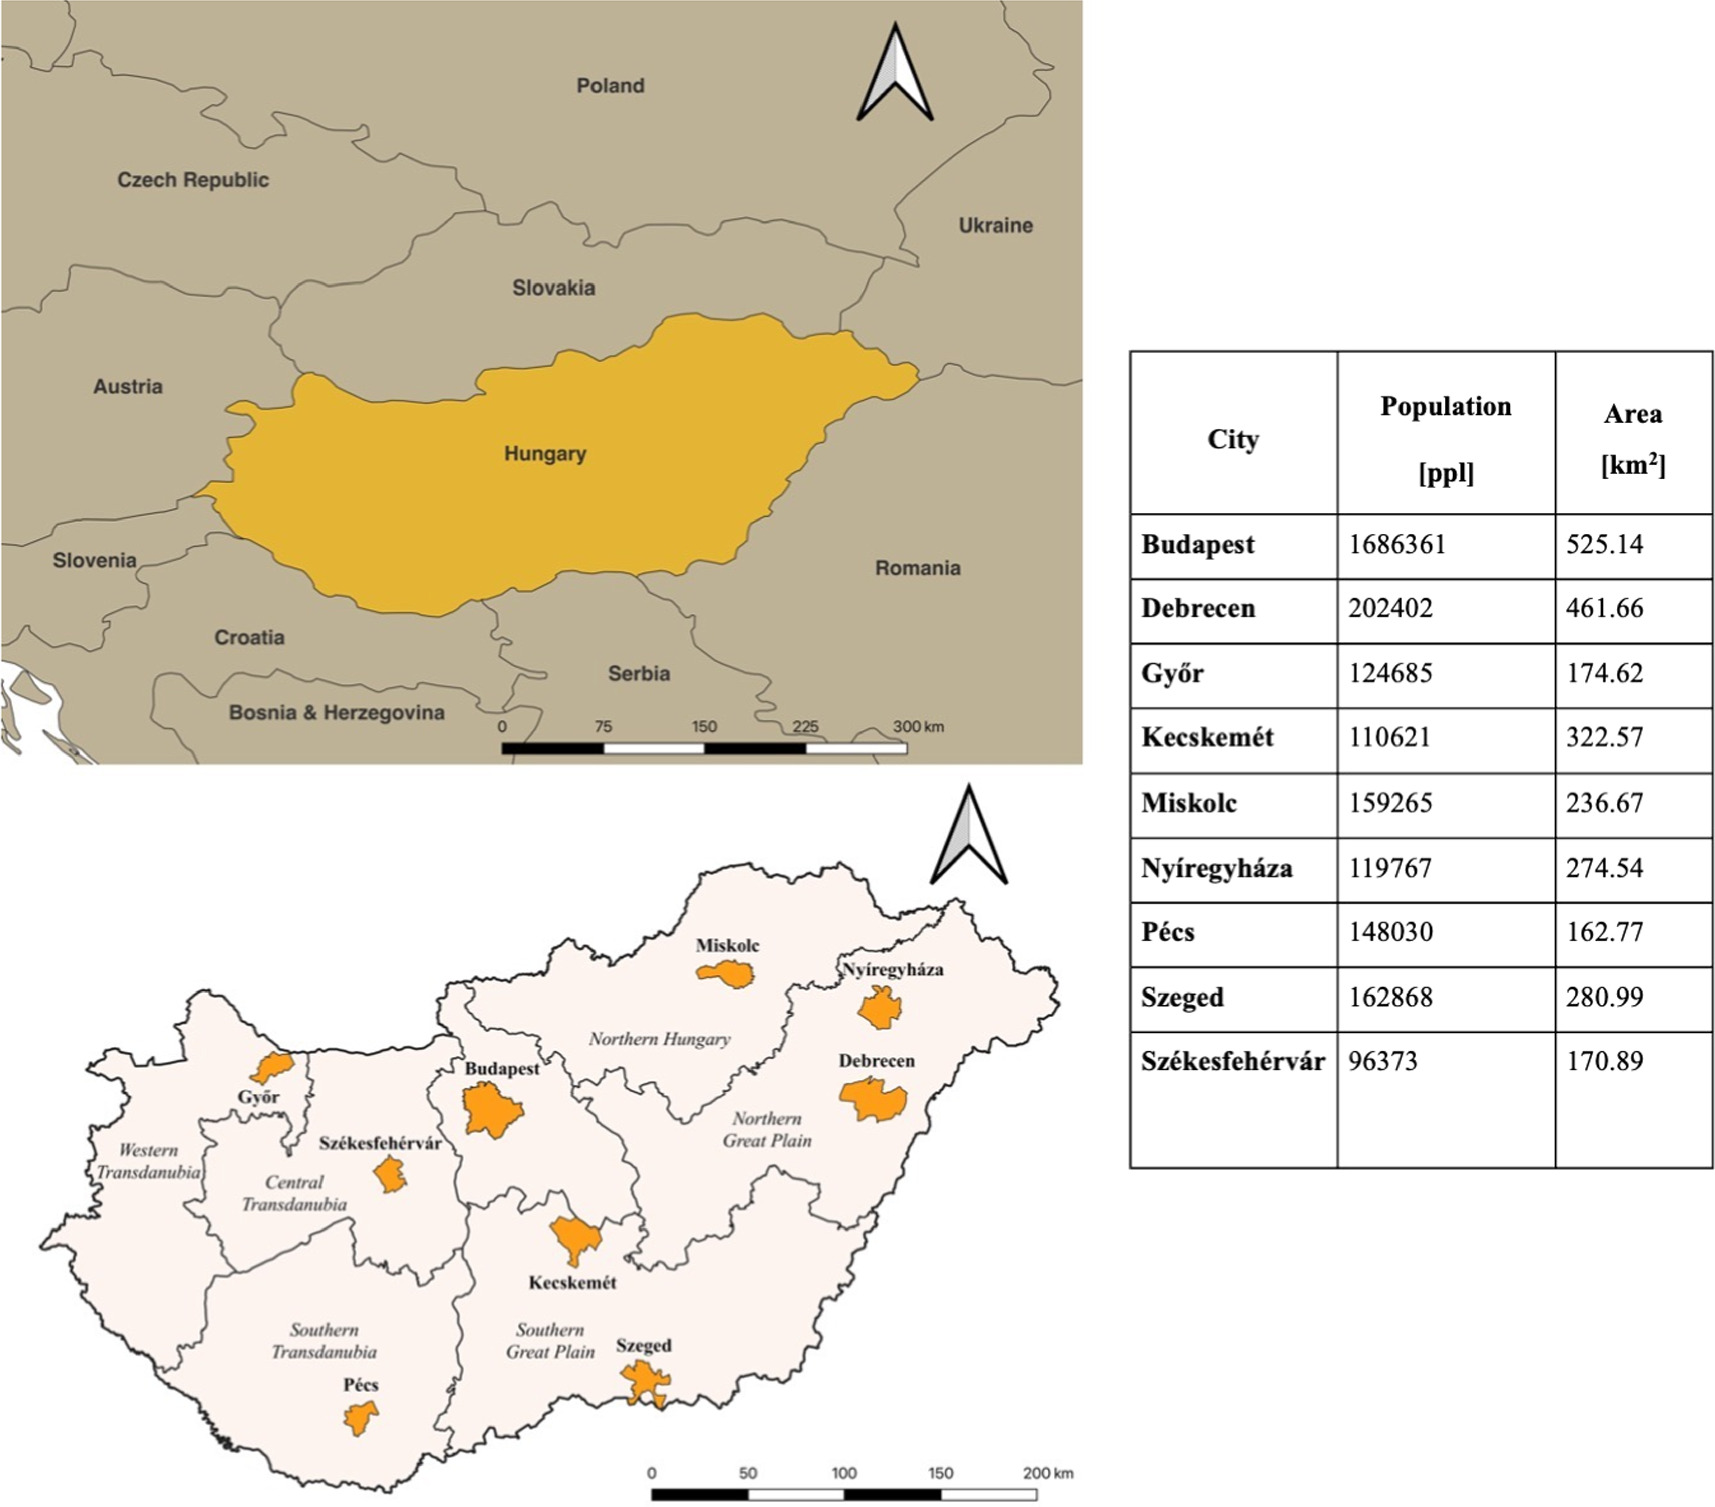
Figure 1. Geographical location, population size (2018), and area of the selected cities.
Download figure:
Standard image High-resolution imageNotably, the urban areas considered in our analysis were not determined using official administrative boundaries. Consequently, areas designated as outskirts, such as forests and agricultural lands, were excluded from the satellite data calculations. However, it is crucial to recognize that these areas are considered in climate strategies and other urban development plans, as they play a role in enhancing climate adaptation, for instance, by acting as contributing factors. The main reason for excluding the outskirts from our analysis is to avoid disturbances in the morning and mid-morning temperature rise anomalies in agricultural areas [72, 73]. Figure 2 represents an example of the disturbing results of such an analysis, using the example of Debrecen, Kecskemét, Szeged and Székesfehérvár from 2018. According to the maps, Land Surface Temperature (LST) was higher in agricultural areas than downtown since Landsat imageries were taken in the morning hours in the selected cities. Consequently, such errors in the temporal analysis of urban climate patterns can significantly affect the robustness of our further results. In the case of other cities, the same spatial anomalies can be identified; however, the most intensive phenomenon can be detected in Szeged.
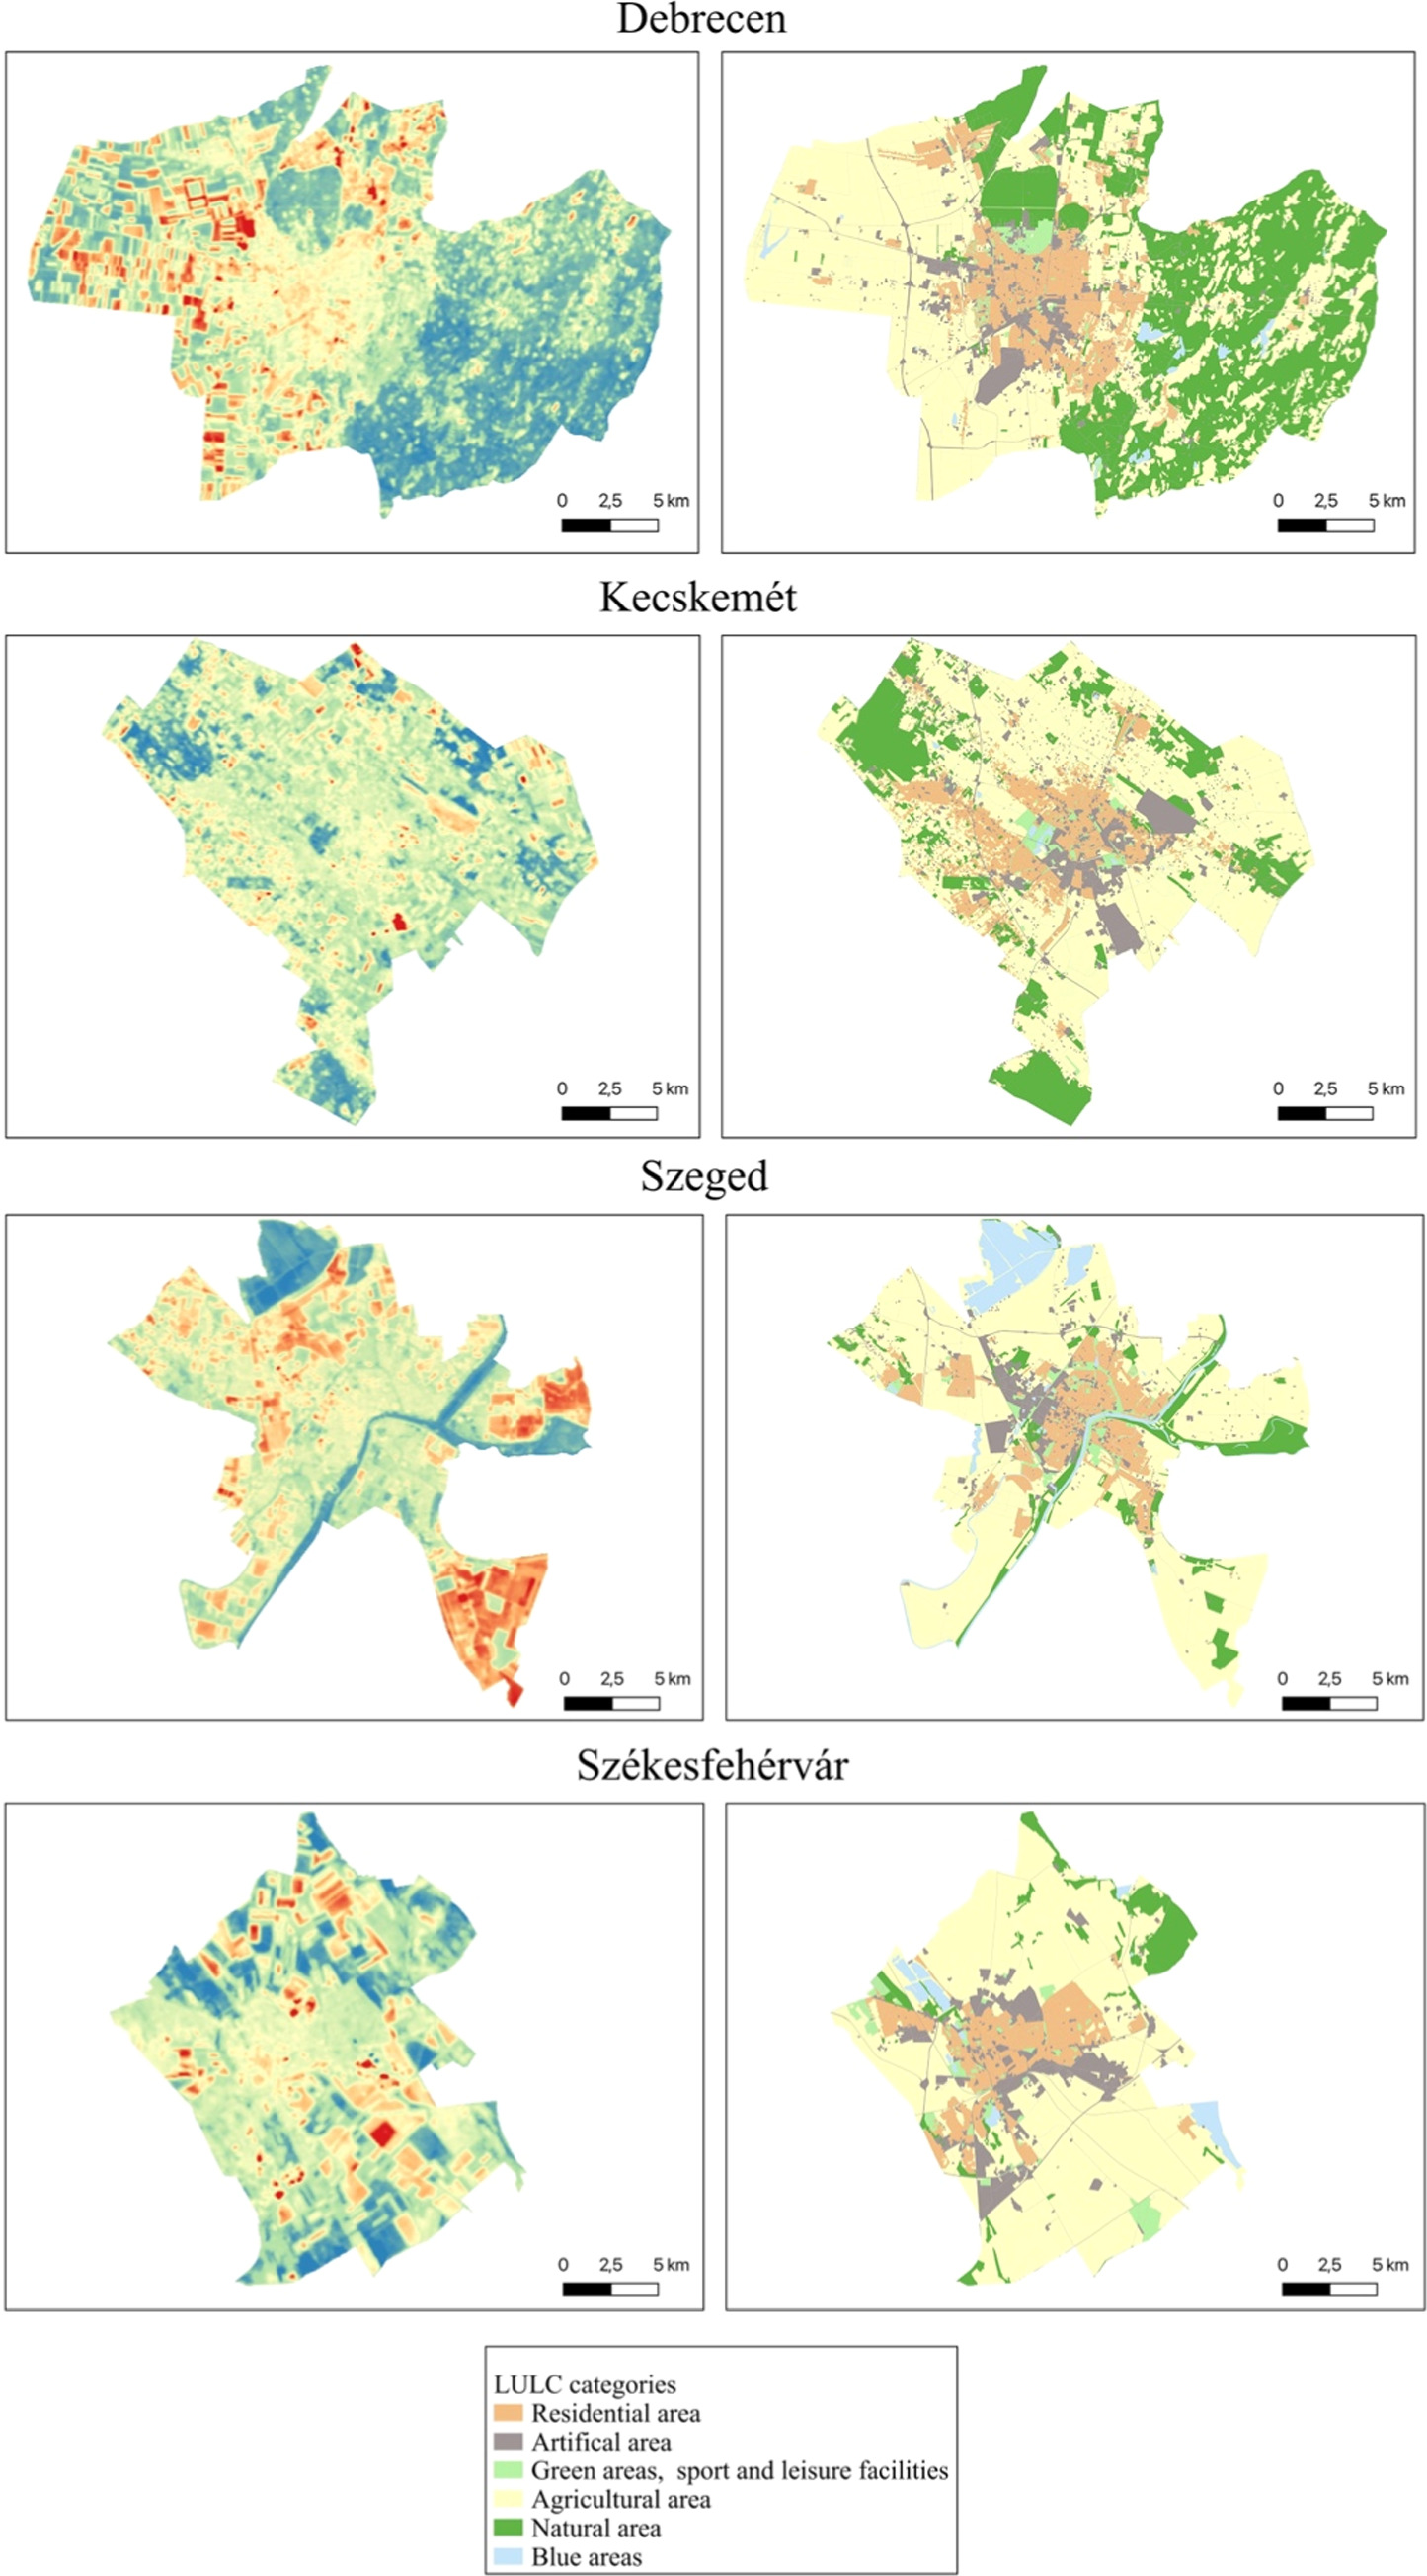
Figure 2. Land surface temperature (left side) and LULC (right side) anomalies in selected cities, 2018.
Download figure:
Standard image High-resolution imageIn our analyses, we utilized two main sources: the U.S. Geological Survey Earth Explorer Database (https://earthexplorer.usgs.gov) to obtain Landsat-7 and Landsat-8 imagery from 2006 to 2018. To ensure comparability of raw data and calculated values, we applied several requirements: 1) satellite images were taken during the summer period each year, from 1 June to 31 August; 2) only completely cloudless or minimally cloud-covered imageries were collected; 3) where possible, we analyzed Landsat-7 data, and when this requirement could not be met, we used Landsat-8 imageries. Detailed information about the exact dates and the satellite data can be found in the Supplementary Material under the 'satellite' tab.
The second database we utilized for our analysis concerns Land Use and Land Cover (LULC) patterns, specifically the Urban Atlas maps from the Copernicus Land Monitoring Service (https://land.copernicus.eu/local/urban-atlas). These maps provided detailed information about land use and land cover patterns for the analyzed cities in 2008, 2012, and 2016, respectively. With a minimum mapping width of 10 meters, these databases provide sufficient resolution to analyze LULC changes in cities over time. However, due to the large number of different land use modes (23), we have merged some categories to enhance the better and easier-to-follow visualization of our results (see table 1).
Table 1. The merged and the initial Urban Atlas LULC categories.
| Merged categories | Urban Atlas nomenclature |
|---|---|
| Residential area | Continuous Urban Fabric |
| Discontinuous Dense Urban Fabric | |
| Discontinuous Medium Density Urban Fabric | |
| Discontinuous Low Density Urban Fabric | |
| Discontinuous Very Low Density Urban Fabric | |
| Artificial area | Isolated Structures |
| Industrial, commercial, public, military and private units | |
| Fast transit roads and associated land | |
| Other roads and associated land | |
| Railways and associated land | |
| Airports | |
| Mineral extraction and dump sites | |
| Construction sites | |
| Land without current use | |
| Green areas, sport and leisure facilities | Green urban areas |
| Sports and leisure facilities | |
| Agricultural areas | Arable land (annual crops) |
| Permanent crops (vineyards, fruit trees, olive groves) | |
| Pastures | |
| Natural areas | Forests |
| Herbaceous vegetation associations (natural grassland, moors...) | |
| Blue areas | Wetland |
| Water bodies |
In addition to the already mentioned regional heterogeneity regarding the selected cities, our study areas show significant differences in terms of LULC patterns. Figure 3 highlights the current LULC features available in Urban Atlas from 2018; due to length limit, we introduced the latest available LULC patterns. Budapest is situated in an area of 525.12 km2, with 53% of the land currently occupied by built-up plots and 47% still undeveloped. 61% of Budapest's built-up areas serve as residential zones, while the remaining area exhibits a diverse range of land uses for economic, recreational, institutional, office, and transportation purposes. The urban structure of Debrecen was shaped through historical processes, with minimal alterations, as evidenced by the road network that predominantly aligns with historical routes. In the 2010 s, there was a decrease in the size of green areas in Debrecen, primarily due to the expansion of residential and industrial areas, resulting in the loss of green spaces. Győr's urban structure exhibits fragmentation and mosaicism, primarily due to intersecting rivers, transportation infrastructure, and the merging of multiple independent settlements during its formation. The rapid expansion of development areas is not unique to Győr. Still, it poses a significant challenge to its urban development as it struggles to meet the demand for a fully established urban infrastructure network. The landscape environment of Kecskemét, with its cultivated areas situated near the community, along with its green features such as uniform tree planting along urban roads and streets, tree-lined pedestrian areas, the presence of public welfare forests surrounding the city, and a central square abundant in green spaces, contribute to its appeal. Nyíregyháza predominantly occupies a defined environment, encompassing areas dedicated to agricultural cultivation, where a considerable portion is intensively cultivated arable land. The proportion of forested areas is relatively small compared to the national average. The expansion of built-up areas, particularly in industrial zones, presents a challenge in the land use of Nyíregyháza. The densely built-up area of Pécs comprises a lengthy east-west-oriented city core and a distinct southern section. Around 40% of the city's administrative area contains forests and green spaces, with approximately 21% designated for residential purposes. In the past few decades, Pécs has experienced suburbanization, leading to a shift in the dynamics between the city and its surrounding urban areas. Regarding the administrative area of Szeged, it is noteworthy that most land parcels (77.63%) are inland. Additionally, when analyzing the statistics of land plots based on cultivation branches, it becomes evident that the forest and harvested areas play the most decisive role in the landscape. The administrative area of Székesfehérvár spans 17.089 hectares, with approximately 27.46% designated as built-up or intended for construction based on the city's structural plan. The landscape use of the Székesfehérvár area is primarily shaped by well-founded agricultural production, supported by excellent farmland, albeit slightly lower than the county average.
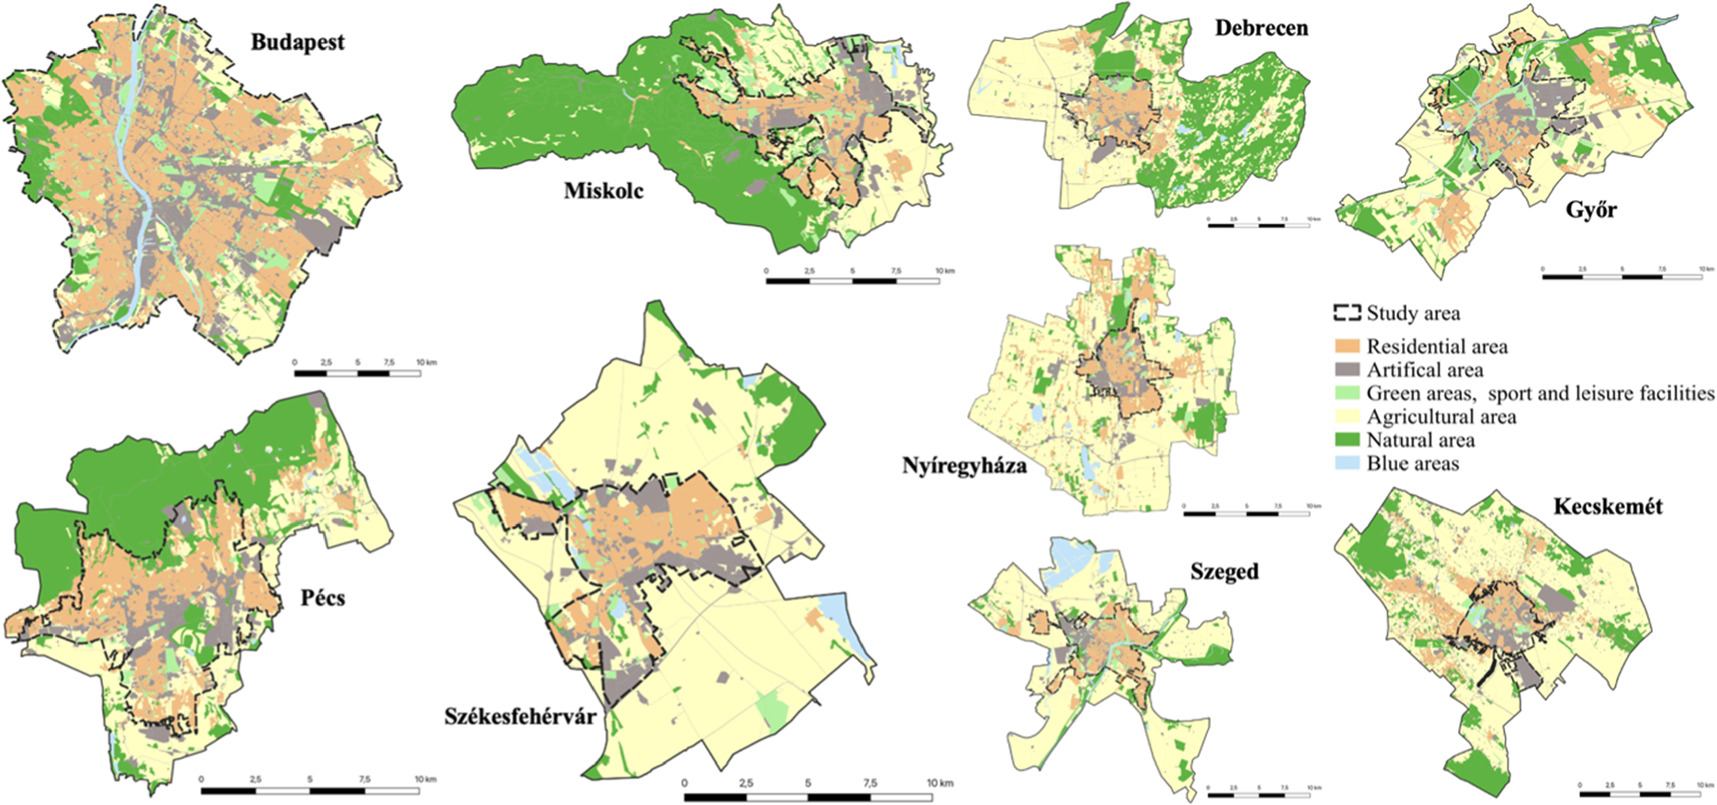
Figure 3. LULC categories in the study areas (2018).
Download figure:
Standard image High-resolution imageSince this paper aims to reveal patterns of urban climate aspects over time; therefore, thermal and optical bands of Landsat-7 and Landsat-8 imageries were downloaded and used to calculate 1) LST, 2) NDVI, 3) urban hotspots, 4) urban thermal field variance index from 2006 to 2018. We used QGIS software (version 3.28 Firenze) for these calculations, then MS Excel was applied to analyze the raster values and to present highlighting charts and tables (see Results section). In the case of LST, we applied a two-step equation system regarding the available ETM+ Band 6 (Landsat-7) following the official USGS Landsat-7 handbook [74]; we applied scan line correction [75], before calculating spectral radiance from the digital numbers:
where Lmax and Lmin are the maximum and minimum radiance values for Band 6, Qcalmax and Qcalmin are the maximum and minimum pixel values, Qcal is the calibrated pixel value in digital numbers. Secondly, the brightness temperature was calculated:

where TB is the calculated brightness temperature in Kelvin, K1 (666.09) and K2 (1282.71) are calibration constants retrieved from the related metadata file, and Lλ is spectral radiance. In the final step, Kelvin values were transformed into Celsius.
Where only Landsat-8 imageries were available, we applied another two-step approach to creating brightness temperature values by using modified equations [14]. Firstly, spectral radiance was calculated by a specific multiplicative factor for Band 10 from metadata files (ML), digital number values (Qcal), and additive rescaling factor from metadata files (AL):
Secondly, the brightness temperature was determined by applying the same equation as before; however, K1 (774.8853) and K2 (1321.0789) were different values coming from metadata files [76]:

The second analyzed urban climate feature was NDVI, as a commonly used indicator [77, 78] in urban studies reflecting the quality of green areas by using optical bands of Landsat satellites; Band 3 and Band 4 for Landsat-7; moreover, Band 4 and Band 5 for Landsat-8:

The third analyzed urban climate aspect is the identification of urban hotspots, which process is based on the previously defined LST values. Urban hotspots represent those places in a city that can be described with the highest temperature, contributing to thermal discomfort [14, 79, 80] by applying the following equation:

where μ is the mean LST value, while σ represents the standard deviation of the entire LST dataset for a given year in a given city.
Finally, we calculated the urban thermal field variance index (UTFVI), which can identify the environmental quality of an urban area by classifying six clusters (see table 2) based on the presence or absence of SUHI phenomenon [48]. Because the following equation is based on LST values in each pixel and refers to the average values of the entire area, negative numbers are related to the absence of the heat island phenomenon, while larger values indicate intense thermal discomfort:
Table 2. Applied UTFVI classes [48].
| UTFVI | SUHI presence |
|---|---|
| < 0 | none |
| 0–0.05 | weak |
| 0.05–0.1 | middle |
| 0.1–0.15 | strong |
| 0.15–0.2 | stronger |
| > 0.2 | strongest |
Results
The following paragraphs and figures provide an overview of the results concerning various aspects of urban climate features and LULC patterns. Due to length constraints, a detailed presentation of every selected city is not possible. For more in-depth numbers and results, please refer to the city tabs in the Supplementary Material.
Firstly, using raw data from the Urban Atlas database, figure 4 illustrates the relative proportion of LULC categories for each city in 2006, 2012, and 2018. Generally, all selected cities experienced urban sprawl over the twelve-year analysis period, increasing the share of residential and artificial surfaces, with one exception: Nyíregyháza recorded a decrease in residential areas between 2006 and 2012. Apart from this, the growth in built-up has been accompanied by a decrease in agricultural land, while the proportion of urban green areas remained relatively stable. Consequently, we can assume that these cities expanded horizontally. Similar to urban green spaces, the share of forests and water bodies did not change significantly, indicating that some cities' decision-makers implemented effective environmental protection processes. However, the intensifying urban sprawl phenomenon and the increase mentioned above in heatwaves render these cities and their populations more vulnerable to extreme weather events.
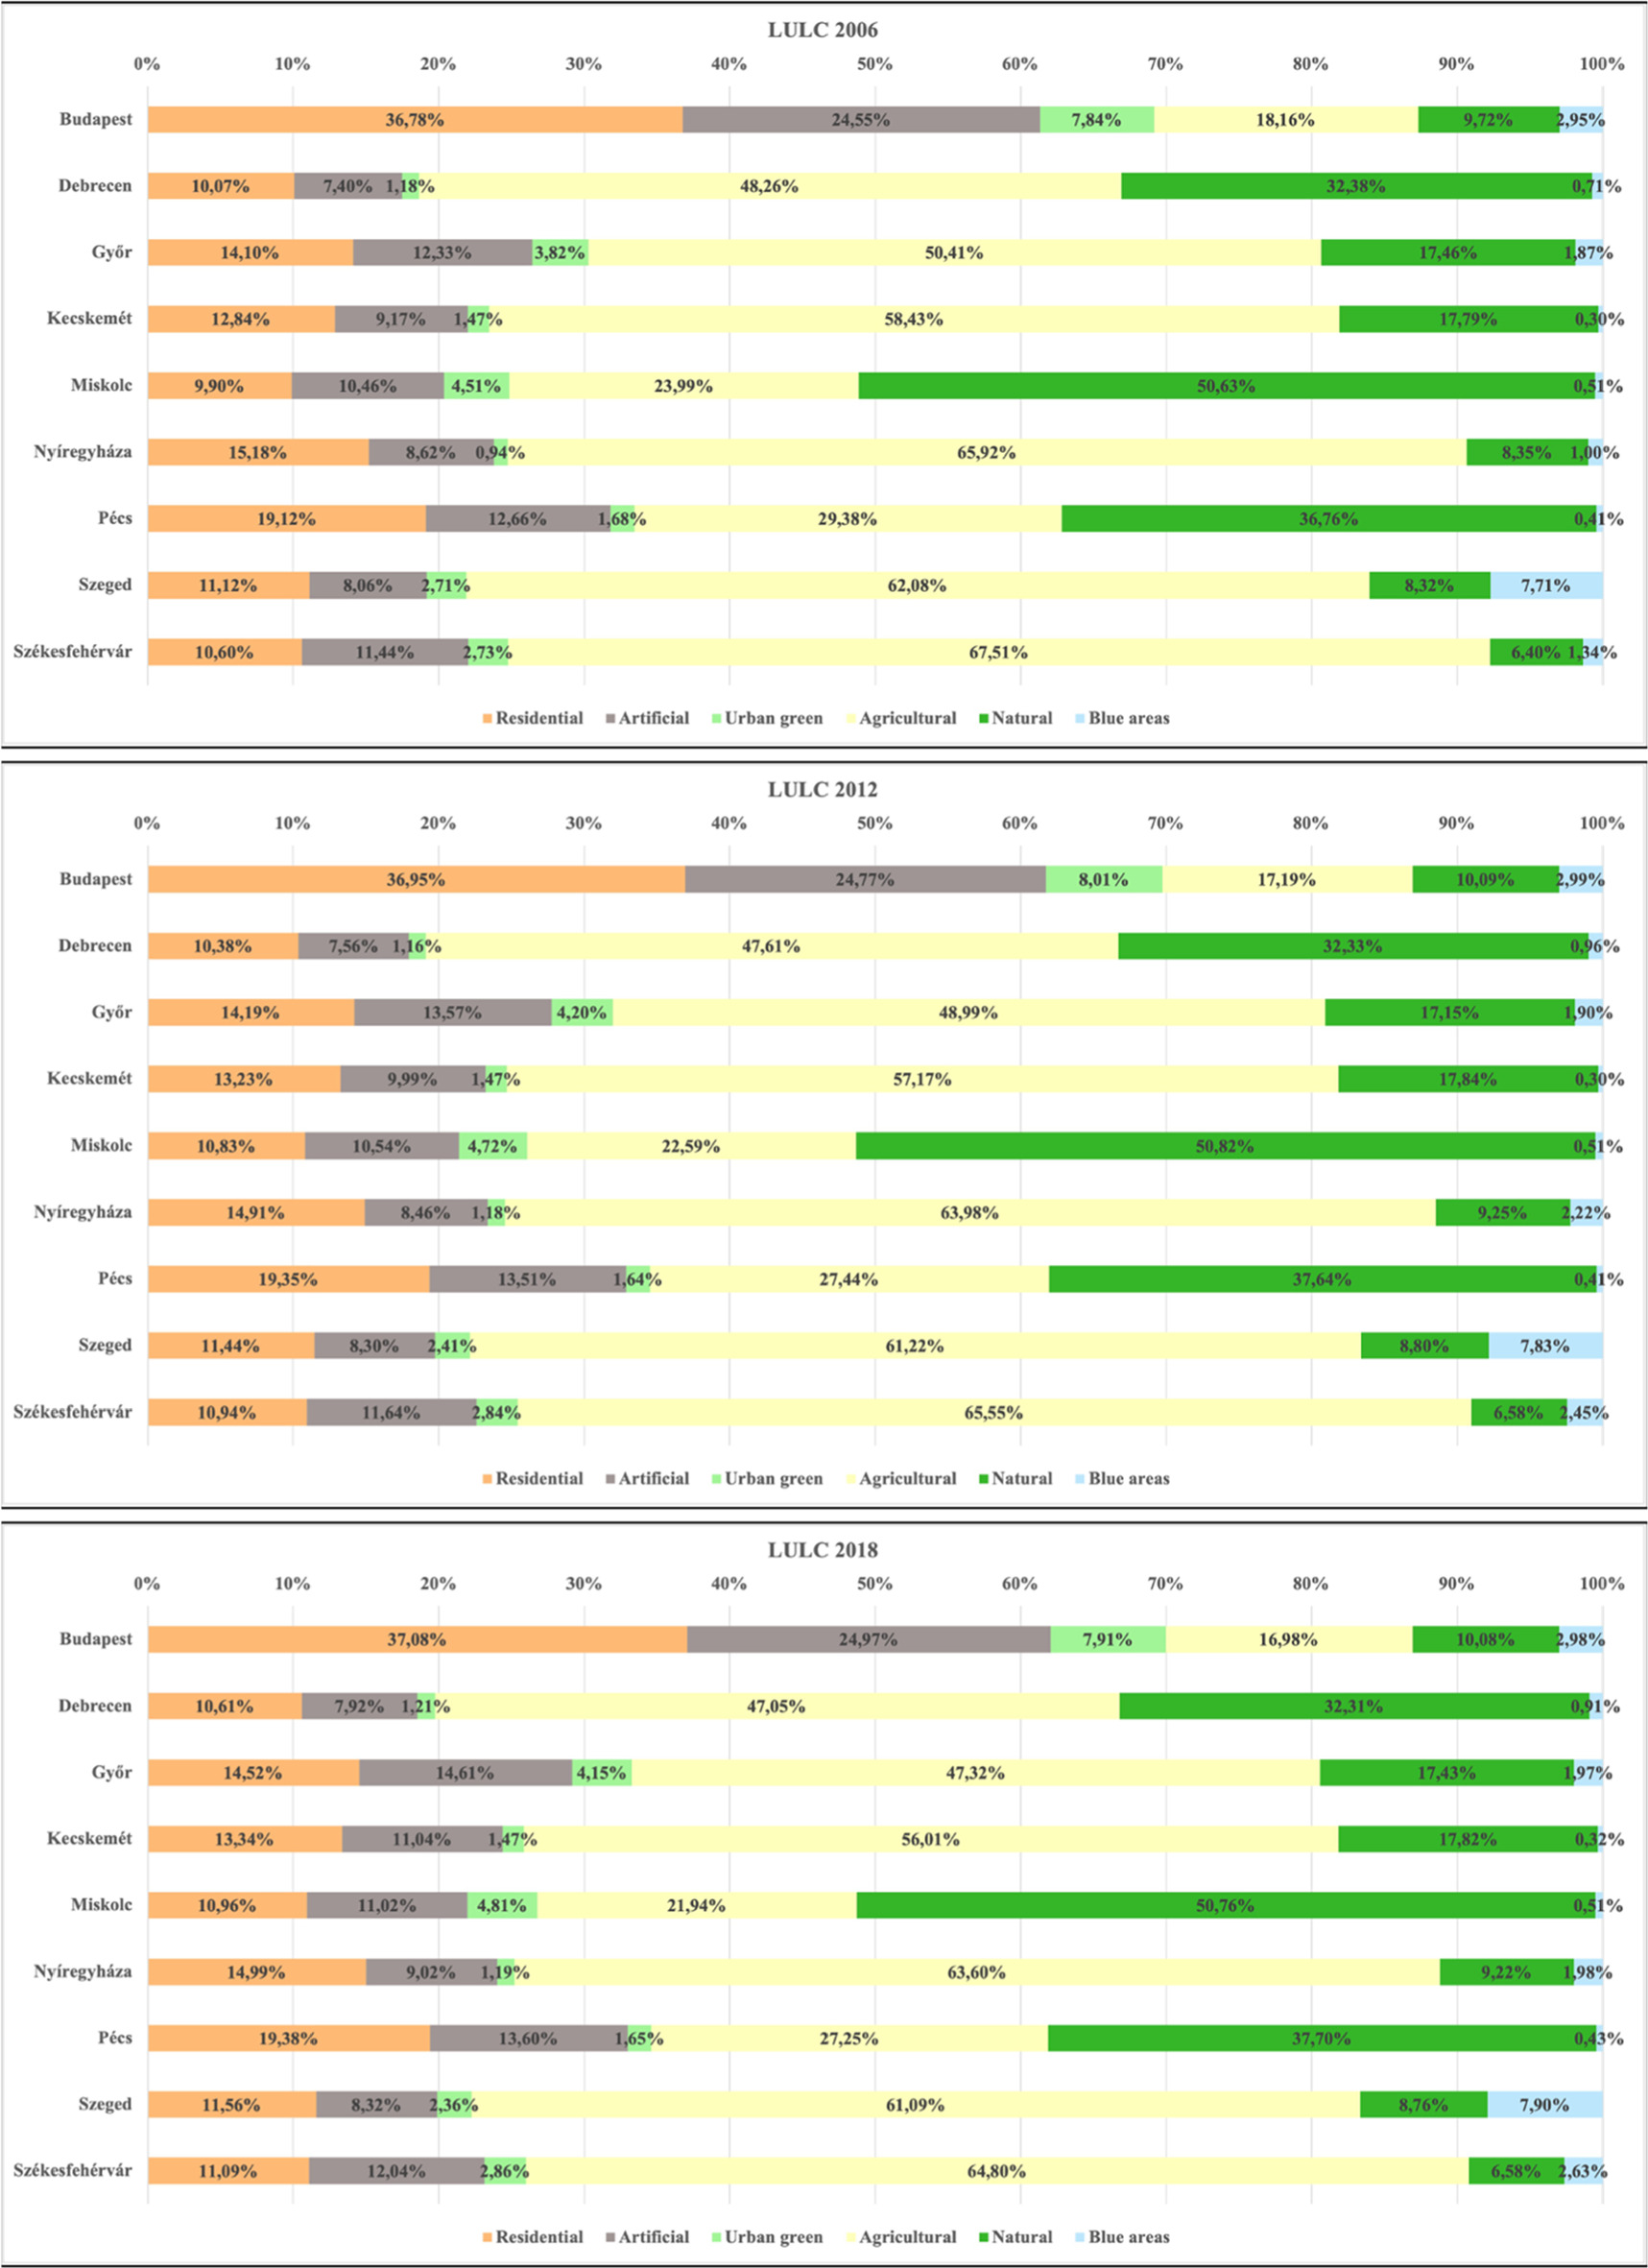
Figure 4. LULC trends in the selected cities.
Download figure:
Standard image High-resolution imageBeyond the general statements, a detailed interpretation of LULC trends can shed light on relevant sustainability issues that can contribute to a better understanding of inner-city processes and improve well-structured and targeted urban development plans and measures in the future. Budapest, the capital of Hungary, increased its built-up area by 0.7%, from 61.33% to 62.07% of the total area, while the proportion of urban green and blue areas remained relatively stable; however, the decline in agricultural area was almost 1.2% in the 12-year period analyzed. Debrecen faced the same value in terms of the declining trend of agricultural land from 48.26% in 2006 to 47.05% in 2018. Residential and artificial areas grew rapidly by more than 1% during the assessed period, with other land use types remaining more or less constant. As one of the most significant automotive hubs in Central and Eastern Europe, Győr has seen a notable rise in the percentage of built-up area due to the growth of artificial areas, which has increased from 12.33% of the total area in 2006 to 14.61% in 2018. This expansion has occurred in tandem with a roughly 0.4 percent increase in residential areas. While the overall reduction in agricultural land was more than 3 percent during the course of the 12-year analysis, the share of urban green spaces increased from 3.82% to 4.15%. Not surprisingly, almost the same values can be found in the case of Kecskemét, another center of the automotive sector in Hungary, meaning that the increasing role of this industry may be accompanied by patterns of urban sprawl if land use regulations cannot provide effective barriers to this type of processes. Miskolc, a former heavy industrial center of Hungary, has an immense proportion of natural areas (mainly forests) within its administrative boundaries, which play a crucial role in controlling the intensity of the urban heat island phenomenon. After the detailed analysis, it can be concluded that local decision-makers and urban planners could effectively keep this proportion at around 50% of the total area; however, the increase in the share of residential areas was more than 1%, which represents the highest distribution of this type of land use category in the urban areas analyzed. In the case of Pécs, there was a 2% decrease in the share of agricultural land in the total area; however, instead of intense patterns of urban sprawl, a slightly different process can be identified. Natural areas have, in fact, been increased by approximately 1%, representing a unique driving force for shrinking agricultural areas in relation to the cities analyzed. Among the selected urban areas, Szeged has the most agricultural land within its borders, with more than 62% of the total area classified as agricultural land in 2006. This number fell by 1%, reflecting classic drivers of urban sprawl, such as the expansion of residential and art spaces, while the other types of land use remained the same. Finally, Székesfehérvár faced an immense decline in agricultural land of around 3%, which is due to two main causes: firstly, the share of built-up areas increased by 1.1%. Secondly, the share of blue areas increased from 1.34% to almost doubled to 2.63% between 2006 and 2018.
Secondly, figure 5 illustrates the distribution of areas with above-average NDVI values. Since the actual NDVI is strongly influenced by local climatic factors, a direct comparison of cities based on absolute values is not feasible. Therefore, we have chosen a relative indicator to conduct our analysis. At first glance, it is difficult to identify clear year-by-year trends of either increase or decrease. However, some notable observations can be made. Firstly, all cities show a negative change in above-average NDVI areas over time. The most significant decrease is observed in Kecskemét, where the 2018 value is only 86% of the 2006 figures. However, it is essential to note that this number may lead to an incorrect conclusion due to relevant year-to-year variations in the data, which illustrates the influence of microclimate on the NDVI in each city.

Figure 5. Share of above-average NDVI values over time.
Download figure:
Standard image High-resolution imageNevertheless, a common trend emerges across all cities, indicating a continuous decrease in above-average NDVI areas over time. This presents a significant challenge for decision-makers concerning urban adaptation strategies. Although there are success stories in preserving green and blue areas in major Hungarian cities, the ongoing urban sprawl processes significantly contribute to the decline of areas with above-average NDVI values. Overall, the findings underscore the importance of addressing the impact of urban development on vegetation and green spaces to ensure sustainable and resilient cities.
The analysis outputs regarding identifying the hottest points in cities exhibit contrasting trends compared to NDVI anomalies. The extent of urban hotspots varies significantly among the analyzed cities, not only in absolute values but also in the range between minimum and maximum values, along with temporal changes (see figure 6). Examining the difference between the two endpoints, each city witnessed an increase from 2006 to 2018. Budapest and Pécs experienced exceptionally high changes, with 241% and 221%, respectively. However, it is crucial to note that these trends are not linear, as seen in other cities; therefore, drawing simple conclusions based solely on these values may not be accurate. Székesfehérvár stands out due to its consistently above-average values yearly, with an average hotspot ratio of 3.52%. This ranking positions the city in first place regarding this indicator, while Kecskemét secures the second position on an imaginary podium with a ratio of 2.66%. Furthermore, the minimum share of hotspots in Székesfehérvár (2.89%) surpasses 90% of the results from the other cities. Notably, its maximum value of 4.62% in 2009 is substantially higher than any recorded number in our analysis. Focusing on intra-city processes over time, various spatial clusters emerge within the core area of Székesfehérvár, representing industrial sites in the eastern, northern, and southern corners of the city. Figure 7 shows the emergence of new heat island areas in Székesfehérvár as a representative example of the shift of the hottest points of cities from the inner cities to the outskirts. Due to length restrictions, a detailed representation of other cities is not possible here. However, similar processes can also be observed in cities with considerable industrial areas, for example, in Debrecen, Győr, or Kecskemét. The analysis indicates that urban green areas in the downtown area are well preserved, with no significant emergence of new large-scale hotspots within the residential sectors.

Figure 6. The share of areas as urban hotspots in major Hungarian cities.
Download figure:
Standard image High-resolution image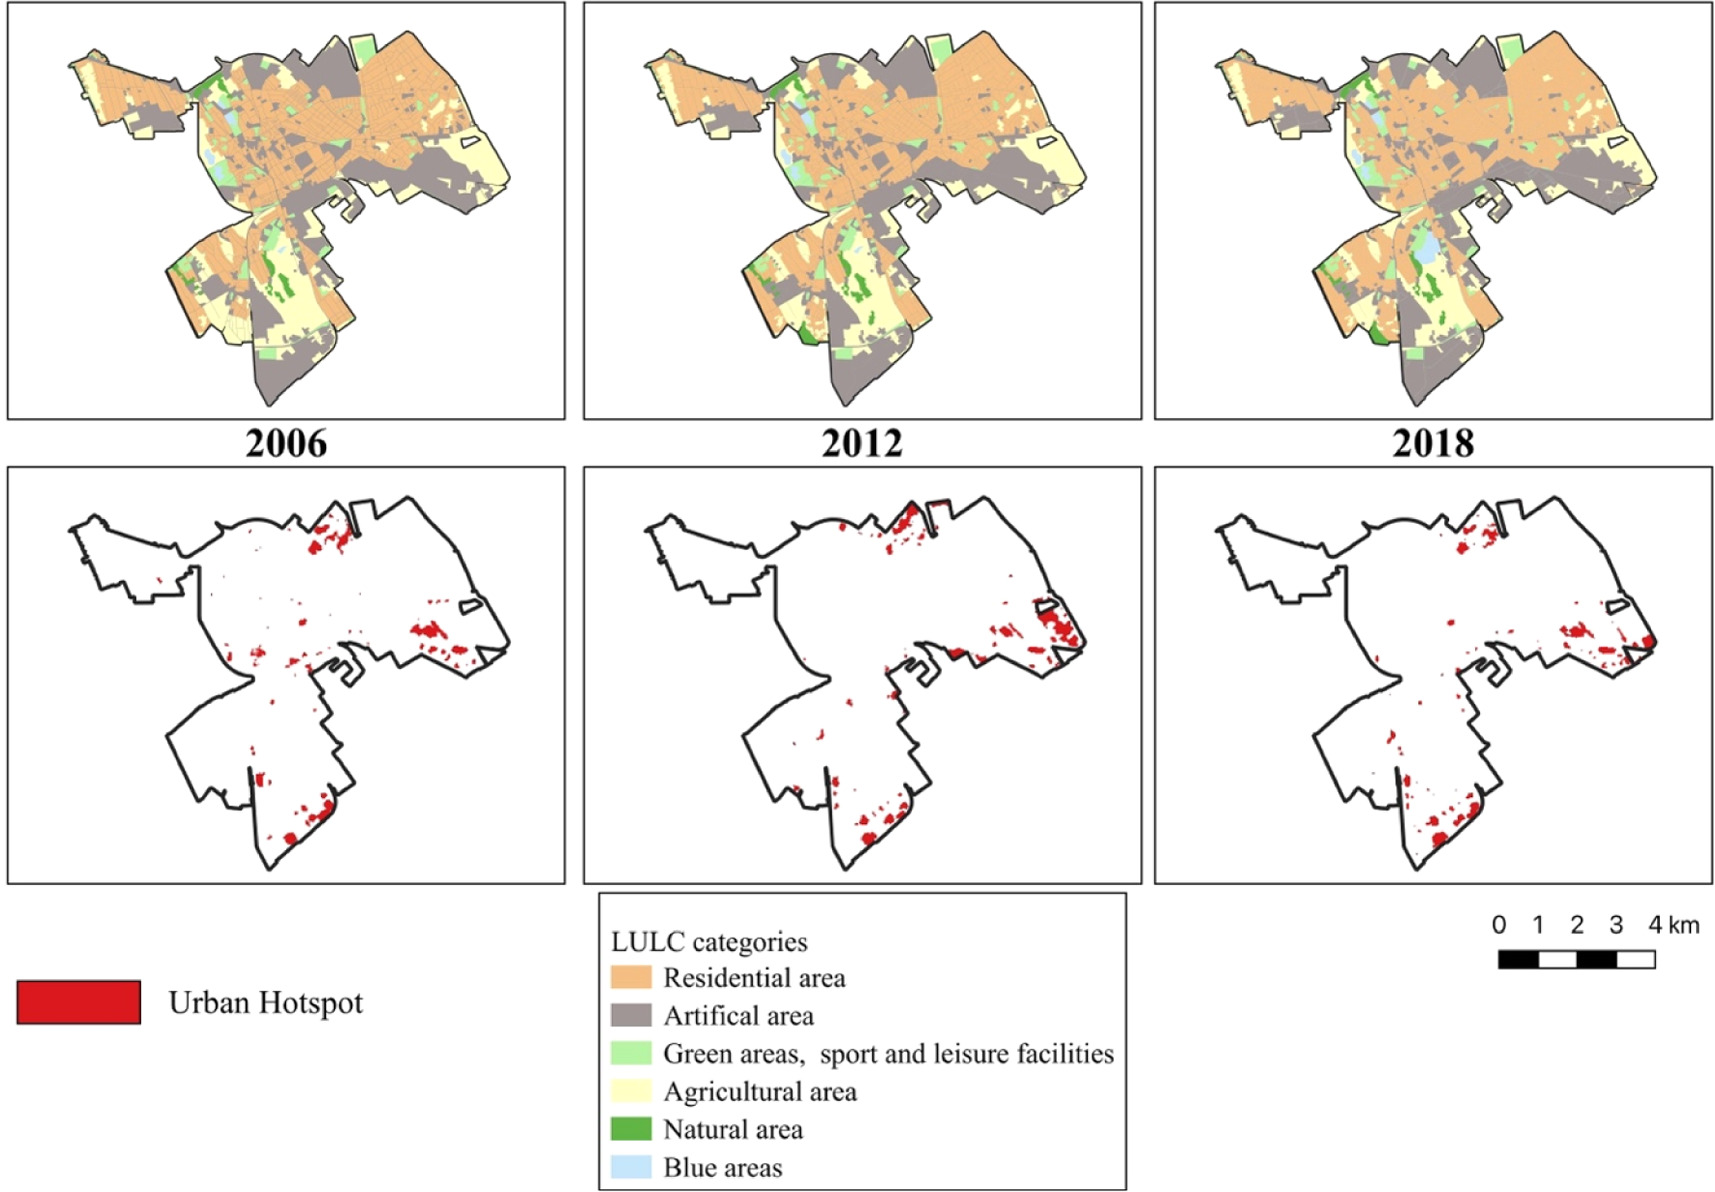
Figure 7. Urban Hotspots in Székesfehérvár over time.
Download figure:
Standard image High-resolution imageFinally, figure 8 reveals an intriguing trend concerning the cumulative share of UTFVI values from the three worst SUHI presence categories: 'strongest,' 'stronger,' and 'strong.' Analyzing the yearly data presents a mosaic-like picture with highly fluctuating results. For instance, the range between minimum and maximum values exceeds 26% in Kecskemét and 20% in Szeged. Two cities stand out as the most vulnerable to thermal discomfort zones: Budapest and Győr. On the other hand, Székesfehérvár, although having the largest share of hotspots, ranks the lowest in terms of thermal discomfort zones. This indicates that beyond the industrial zones mentioned earlier, Székesfehérvár has considerably fewer thermal discomfort areas in its downtown residential regions. Finally, it is important to highlight the downward trend observed in all cities between 2006 and 2018. This suggests that cooling areas have been relatively well-preserved despite intensifying extreme hot days attributed to climate change. These findings shed light on the varying vulnerability of different cities to SUHIs and provide valuable insights for urban planners and policymakers to implement effective mitigation and adaptation strategies.

Figure 8. The share of worst UTFVI clusters in the selected cities.
Download figure:
Standard image High-resolution image
Discussion
This study aimed to reveal the characteristics of LULC patterns and selected urban climate parameters in major Hungarian cities over time. The applied timeframe closely aligns with the release dates of the Urban Atlas database, defining the endpoints as 2006 and 2018. By conducting yearly analyses of urban climate patterns, we gained a comprehensive overview of the selected cities from multiple perspectives, addressing various challenges, trends, and unique local characteristics contributing to the overall results. While this paper focuses on a specific climate adaptation scope, it would be valuable to compare the findings with one of our previous studies that analyzed different aspects of sustainability and adaptation using a fuzzy methodology [59]. These previous findings revealed significant variations in sustainability and heatwave vulnerability scores among Hungarian county seats, offering a broader pool of analyzed cities. Cities such as Budapest and those in the southern and eastern regions, including Szeged, Pécs, Kecskemét, Debrecen, and Nyíregyháza, showed relatively high vulnerability scores. On the other hand, Northern Hungarian cities like Miskolc and some Transdanubian cities like Győr and Székesfehérvár exhibited lower heatwave vulnerability.
As for the presence of urban hotspots, we identified a significant number of such areas in Győr and Székesfehérvár. However, a more detailed spatial analysis of the latter revealed these parts of the cities as industrial zones, with minimal thermal discomfort areas around or within the downtown area. Similar results were found in the case of Győr, where the automotive industry, located at the edge of the local economy, constituted industrial parks, indicating potential urban hotspots away from the city center.
In contrast, the most intensive SUHI phenomena were detected in Budapest, given its densely built-up core area compared to other cities. We must acknowledge that our main aim was to provide an overview of selected urban climate and LULC aspects of major Hungarian cities. While deep analyses and detailed insights can be identified as potential research areas regarding urban areas from the Carpathian basin, we listed numerous studies from that region focusing on selected cities. It would be beneficial to extend the number of analyzed spatial units to better understand local climate and adaptation patterns over time. Additionally, involving planning-related aspects could provide more comprehensive assessments.
Numerous studies in the existing literature address one or more aspects of urban climate patterns that we have analyzed in this article. The comparison of our results with the literature can be summarized by highlighting our main findings and linking them to previously published articles, focusing mainly on Hungarian cities (but not only):
- 1.Clear urban sprawl patterns were noted in each selected city with declining agricultural land; however, there was a relatively stable proportion of urban green spaces. The analysis of urban sprawl patterns was the focus of [81, 82] and indicated a significant increase in industrial areas in Győr and Kecskemét as the most intensively industrialized cities in Hungary, making these cities automotive centers. However, the existence of urban sprawl patterns has been established previously; a comparative assessment of the largest Hungarian cities is a gap in the literature.
- 2.A decreasing trend of above-average NDVI values over time was observed in the selected cities. This pattern is quite common in global urbanization processes, as demonstrated by [83–87]; however, to the best of the authors' knowledge, a detailed temporal analysis of Hungarian cities has not yet been found in the literature.
- 3.A new phenomenon called industrial heat island [88–91] has occurred in several cities, in which the temperature in industrial areas increases compared to the surrounding area. This relocation of the hotter points of the cities was found in the case of Székesfehérvár, Kecskemét, and Győr, in parallel with the previously revealed urban sprawl patterns [81, 82].
- 4.The highest proportion of worst UTFVI zones can be found in Budapest and Győr, representing the capital of Hungary, and a before-mentioned municipality with an extended amount of industrial zones on the outskirts of the city. Inter alia, two recent studies focused on urban climate issues of Budapest based on the high ratio of built-up areas and the lack of extensive green or blue areas in the downtown districts; consequently, the large of the worst UTFVI areas is not a surprise. Besides, numerous papers have pointed out the interconnections between LST, urban hotspots, and UTFVI categories; therefore, our results fit with international scientific trends.
Finally, our study and the applied methodology has two main limitations. First, the time frame applied is 13 years, which can be extended by applying LULC identification methods and using satellite data instead of pre-processed information such as the Urban Atlas database. However, manual classification of LULC modes also has limitations and expansion of the range of analyzable units is possible. Second, we focused on some aspects of urban climate patterns, and other indicators such as the normalized difference construction index, the urban index and the SUHI should be considered in future research. In addition to quantitative analysis of various urban climate aspects or LULC patterns, another future research direction would be to incorporate qualitative strategy assessment to also uncover and identify urban governance issues. Since the assessment of plan quality is now one of the main research areas of urban climate research, the parallel evaluation of quantitative and qualitative data can be identified as a new direction in urban studies.
Conclusions
This paper aimed to analyze major Hungarian cities regarding their LULC patterns and selected urban climate aspects from 2006 to 2018. To achieve this, we used remote sensing data to compare LULC changes, urban hotspots, NDVI tendencies, and the presence of the surface UHI phenomenon by applying the urban thermal field variance index. The primary data sources were the Earth Explorer platform, providing Landsat-7 and Landsat-8 imageries from summer months, and the Urban Atlas database, which helped identify LULC changes over time. Regarding the LULC patterns, our analysis revealed that urban expansion occurred in almost every city, mainly reducing agricultural land; however, urban green areas, forests, and water bodies remained relatively stable. Despite year-to-year fluctuations, all cities experienced a continuous decrease in above-average NDVI areas, with Kecskemét showing the most significant decline. This trend poses challenges for decision-makers concerning urban adaptation strategies, as ongoing urban sprawl leads to a reduction in green and vegetated spaces. The analysis of urban hotspots showed contrasting trends compared to NDVI anomalies in the analyzed cities. Budapest and Pécs experienced substantial increases (241% and 221%, respectively) in hotspots from 2006 to 2018, but the trends were not linear. Notably, Székesfehérvár's hotspots showed distinct spatial clusters representing industrial sites within the city's core, while downtown green areas remained well preserved with limited large-scale hotspot emergence in residential sectors. Finally, we revealed a fluctuating mosaic-like trend in the cumulative share of UTFVI values for the three worst SUHI presence categories across the analyzed cities. Moreover, all cities showed a decreasing trend between 2006 and 2018, indicating relatively well-preserved cooling areas despite the rise in extremely hot days due to climate change. In summary, our findings contributed to a better understanding of urban climate aspects in major Hungarian cities over time and identified policy-making challenges that need to be addressed by local decision-makers.
Acknowledgments
Project no. 137595 has been implemented with the support provided by the Ministry of Innovation and Technology of Hungary from the National Research, Development and Innovation Fund, financed under the FK_21 funding scheme. The research reported in this paper and carried out at BME has been supported by the NRDI Fund TKP2021 based on the charter of bolster issued by the NRDI Office under th e auspices of the Ministry for Innovation and Technology (project id: BME-NVA-02). This research was also funded by the Sustainable Development and Technologies National Programme of the Hungarian Academy of Sciences (FFT NP FTA).
Data availability statement
The data that support the findings of this study are available upon reasonable request from the authors.
Declaration of interests
The authors declare that they have no known competing financial interests or personal relationships that could have appeared to influence the work reported in this paper.
Declaration of generative AI and AI-assisted technologies in the writing process
During the preparation of this work, the authors used Grammarly and Ref-n-Write in order to improve readability and language. After using this tool/service, the authors reviewed and edited the content as needed and take full responsibility for the content of the publication.
Supplementary data (0.3 MB PDF)