

Abstract
The east limb of the Ross Gyre approaches the western Amundsen Sea, thereby exerting an influence on the surface circulation dynamics. This study investigates the impact of the zonal movement of the eastern boundary of the Ross Gyre on the surrounding surface geostrophic circulation in January. Specifically, a zonal shift of the eastern boundary of the Ross Gyre induces a substantial shelf-basin circulation within the Amundsen Sea. The findings of this study provide valuable insights into the influence of the Ross Gyre on the exchange processes between the Amundsen Sea shelf and basin.
Export citation and abstract BibTeX RIS

Original content from this work may be used under the terms of the Creative Commons Attribution 4.0 licence. Any further distribution of this work must maintain attribution to the author(s) and the title of the work, journal citation and DOI.
1. Introduction
Surface circulation in the Amundsen Sea affects the intrusion of deeper Circumpolar Deep Water to the Amundsen Sea Shelf (Dotto et al 2020). Surface circulation also alters the ice motion (Dewey et al 2018). Surface circulation study is fundamental in the Amundsen Sea (Gordon 1988, Dotto et al 2018, Nakayama et al 2018, Gómez-Valdivia et al 2023).
The Ross Gyre (RG) is a significant polar gyre located in the Pacific Sector of the Southern Ocean. Its distinct cyclonic circulation pattern and lower surface heights make it an important feature in the region's ocean dynamics (Gouretski 1999, Holland and Kwok 2012). The RG interacts with the Antarctic Circumpolar Current (ACC) and plays a crucial role in the surface circulation of the Amundsen Sea and Ross Sea (Dotto et al 2018, Buesseler et al 2001). Therefore, understanding the RG's behavior and its impact on the surrounding ocean currents is of great importance. It not only contributes to our comprehension of regional ocean circulation patterns, but also has implications for various processes, such as heat and freshwater transport, biogeochemical cycles, and the stability of ice shelves (Jacobs et al 2002, Raphael et al 2019, Sonnewald et al 2023).
The RG exhibits notable seasonal variability, characterized by fluctuations in its area and intensity (Dellnitz et al 2009, Armitage et al 2018, Dotto et al 2018). The presences of the Amundsen Sea Low (ASL) and Antarctic Oscillation (AAO) significantly influence the behavior of the RG. These atmospheric processes induce changes in near-slope currents and modulate the extent of the gyre (Dotto et al 2018). Moreover, the El Niño-Southern Oscillation (ENSO) affects the ASL, thereby impacting the RG's dynamics (Kwok and Comiso 2002, Turner 2004).
Despite considerable research progress, our understanding of the interannual variability of the RG remains limited, primarily due to a scarcity of satellite studies beyond six-year time period (Dotto et al 2018). Hence, this study aims to address this gap in knowledge by focusing on the summer season, which provides a period of relatively higher data quality compared to other ice-rich seasons (Volkov and Pujol 2012). By utilizing composite analysis method, I aim to quantitatively examine the influence of the RG on the surface circulation of the Amundsen Sea.
2. Data and methods
2.1. Data
2.1.1. Bathymetry
I use RTOPO-1Min topographic data (figure 1; Schaffer et al 2016). The fine horizontal resolution data are then averaged onto a relatively coarse grid of 0.25° × 0.25°.
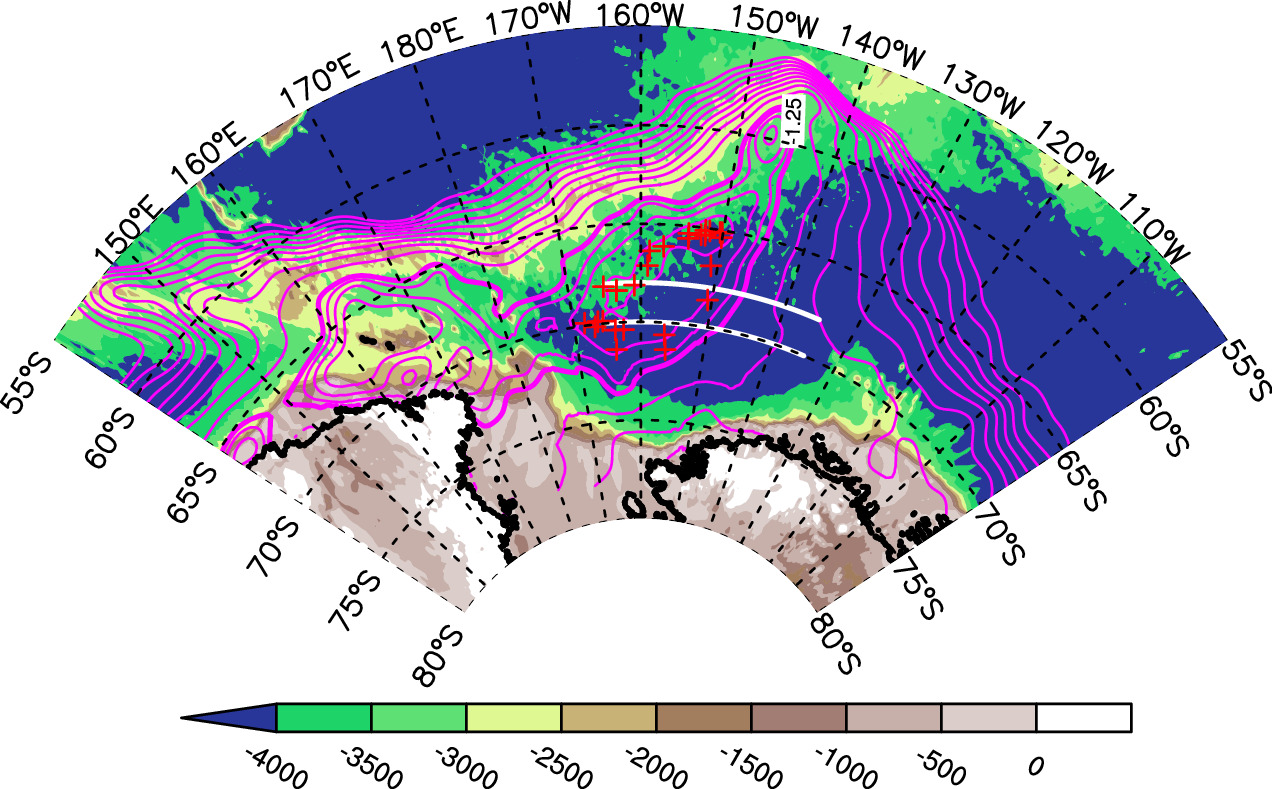
Figure 1. Research domain and bathymetry (color shading). Magenta contours are climatological sea surface height (absolute dynamic topography; January). Sea surface height is spaced every 0.01 m when it is less than −1.25 m, and spaced every 0.05 m when it is greater than −1.25 m. Sea surface height of −1.25 m is highlighted by magenta thick line. Red plus represents Ross Gyre Center. The two white lines show the latitude band that determines the longitude of the eastern boundary of the Ross Gyre.
Download figure:
Standard image High-resolution image2.1.2. Sea surface height
I adopt the global sea surface height dataset from CMEMS. The horizontal resolution is 0.25° × 0.25°. Absolute Dynamic Topography (ADT) and geostrophic current are considered. The time period spans from 1993 to 2020.
2.2. Method
2.2.1. Detection of eastern boundary of the ross gyre
A two dimensional locally weighted linear regression smoother (Cleveland and Devlin 1988) is used to separate mean flow and small-scale signals. The search radius is 6.90° and 2.70° in longitude and latitude (roughly 300 km), respectively (Dotto et al 2018). Later, an eastern boundary is defined as the last bounding contour of the gyre (Drouin et al 2021). The longitude of the eastern boundary is then determined within the latitude band of [68° , 70°]S.
2.2.2. Detection of Ross Gyre Center
The Ross Gyre Center (RGC) is defined as the lowest value of ADT in the area as [150°, 170°]W and [65°, 72°]S. After the detection of RGC, three attributes including longitude (RGC Lon), latitude (RGC Lat) and relative ADT (RGC Rel_ADT; referred to the last bounding contour of the gyre) are extracted for further analysis.
2.2.3. Climate index
I use three climate indices: AAO, ASL and ENSO. ASL attributes include longitude (ASL Lon), latitude (ASL Lat), section pressure (ASL SecP), actual pressure (ASL ActP) and relative pressure (ASL RelP; Hosking et al 2016). The ASL SecP is the averaged sea level pressure over the region of 60°–75° S, 170° E–70° W, and the ASL SecP is noted as regional background pressure. ASL ActP is the sea level pressure of ASL. Then the ASL RelP is the ASL ActP minus ASL SecP. ENSO niño 3.4 is used (NOAA Physical Sciences Laboratory).
2.2.4. Composite analysis
When performing composite analysis, I average the ADT and geographic current in anomalous and neutral years.
3. Results
3.1. Time series of Ross Gyre
The longitude of the Ross Gyre Eastern Boundary (RG_EB) is distributed within the range of [140° W−160° W], as shown in figure 2(a). The mean longitude of the RG_EB is determined to be 147.39° W, with an interannual standard deviation of 4.29°. Similarly, the mean longitude (latitude) of the RGC is found to be 157.75° W (67.67° S), accompanied by an interannual standard deviation of 6.23° (2.25°). Notably, the correlation coefficient between the RGC's longitude and latitude is remarkably high at 0.74, indicating a consistent relationship between the meridional and zonal movements of the RGC. The RGC intensity (RGC Rel_ADT), exhibits substantial interannual variability. The mean RGC intensity is −0.041 m, with an interannual standard deviation of 0.015 m.

Figure 2. Time series of RG attributes and climate indices. (a) RG_EB longitude, (b) RGC longitude, (c) RGC latitude, (d) RGC ADT, (e) AAO, (f) ASL longitude, (g) ASL latitude, (h) ASL section pressure (solid line) and actual pressure (dashed line), (i) ASL relative pressure, and (j) ENSO.
Download figure:
Standard image High-resolution imageFigure 2 also presents the time series of climate indices, namely the AAO, ASL, and ENSO. The corresponding correlation coefficients (CCs) between the RG_EB and these climate indices are summarized in table 1. The RG_EB longitude exhibits a moderate correlation with the actual pressure of the ASL (ASL ActP), with a CC of −0.46. Meanwhile, the evolution of RG_EB longitude demonstrates a correlation with the AAO, yielding a CC of 0.45. The CC between RG_EB longitude and ENSO is −0.35, indicating a possible linkage between the RG_EB and the ENSO. For RGC longitude, the longitude of ASL gives highest CC as −0.39. The RGC latitude also exhibits the highest CC (−0.35) with the ASL longitude. Regarding the RGC intensity (RGC Rel_ADT), its CC with the ASL longitude is −0.35, while its CC with the ASL latitude is 0.23, indicating a possible relationship between the intensity of the RGC and the ASL position. The AAO also plays a role in modulating the RGC Rel_ADT, with a CC of −0.27 between AAO and RGC Rel_ADT. Furthermore, the RGC Rel_ADT exhibits a modest CC with the actual pressure of the ASL (0.29), and a CC of 0.24 with the ENSO.
Table 1. Correlation coefficient between Ross Gyre and climate indices. The asterisk indicates passing the 95% significance test.
| AAO | ASL Lon | ASL Lat | ASL SecP | ASL ActP | ASL RelP | ENSO | |
|---|---|---|---|---|---|---|---|
| RG_EB Lon | 0.45* | −0.20 | −0.36 | −0.35 | −0.46* | 0.11 | −0.35 |
| RGC Lon | 0.12 | −0.39* | 0.06 | −0.03 | −0.11 | 0.14 | 0.16 |
| RGC Lat | −0.12 | −0.35 | 0.11 | 0.18 | 0.15 | 0.14 | 0.06 |
| RGC Rel_ADT | −0.27 | −0.35 | 0.23 | 0.16 | 0.29 | −0.21 | 0.24 |
3.2. Composite SSH due to longitude of Ross Gyre Eastern Boundary
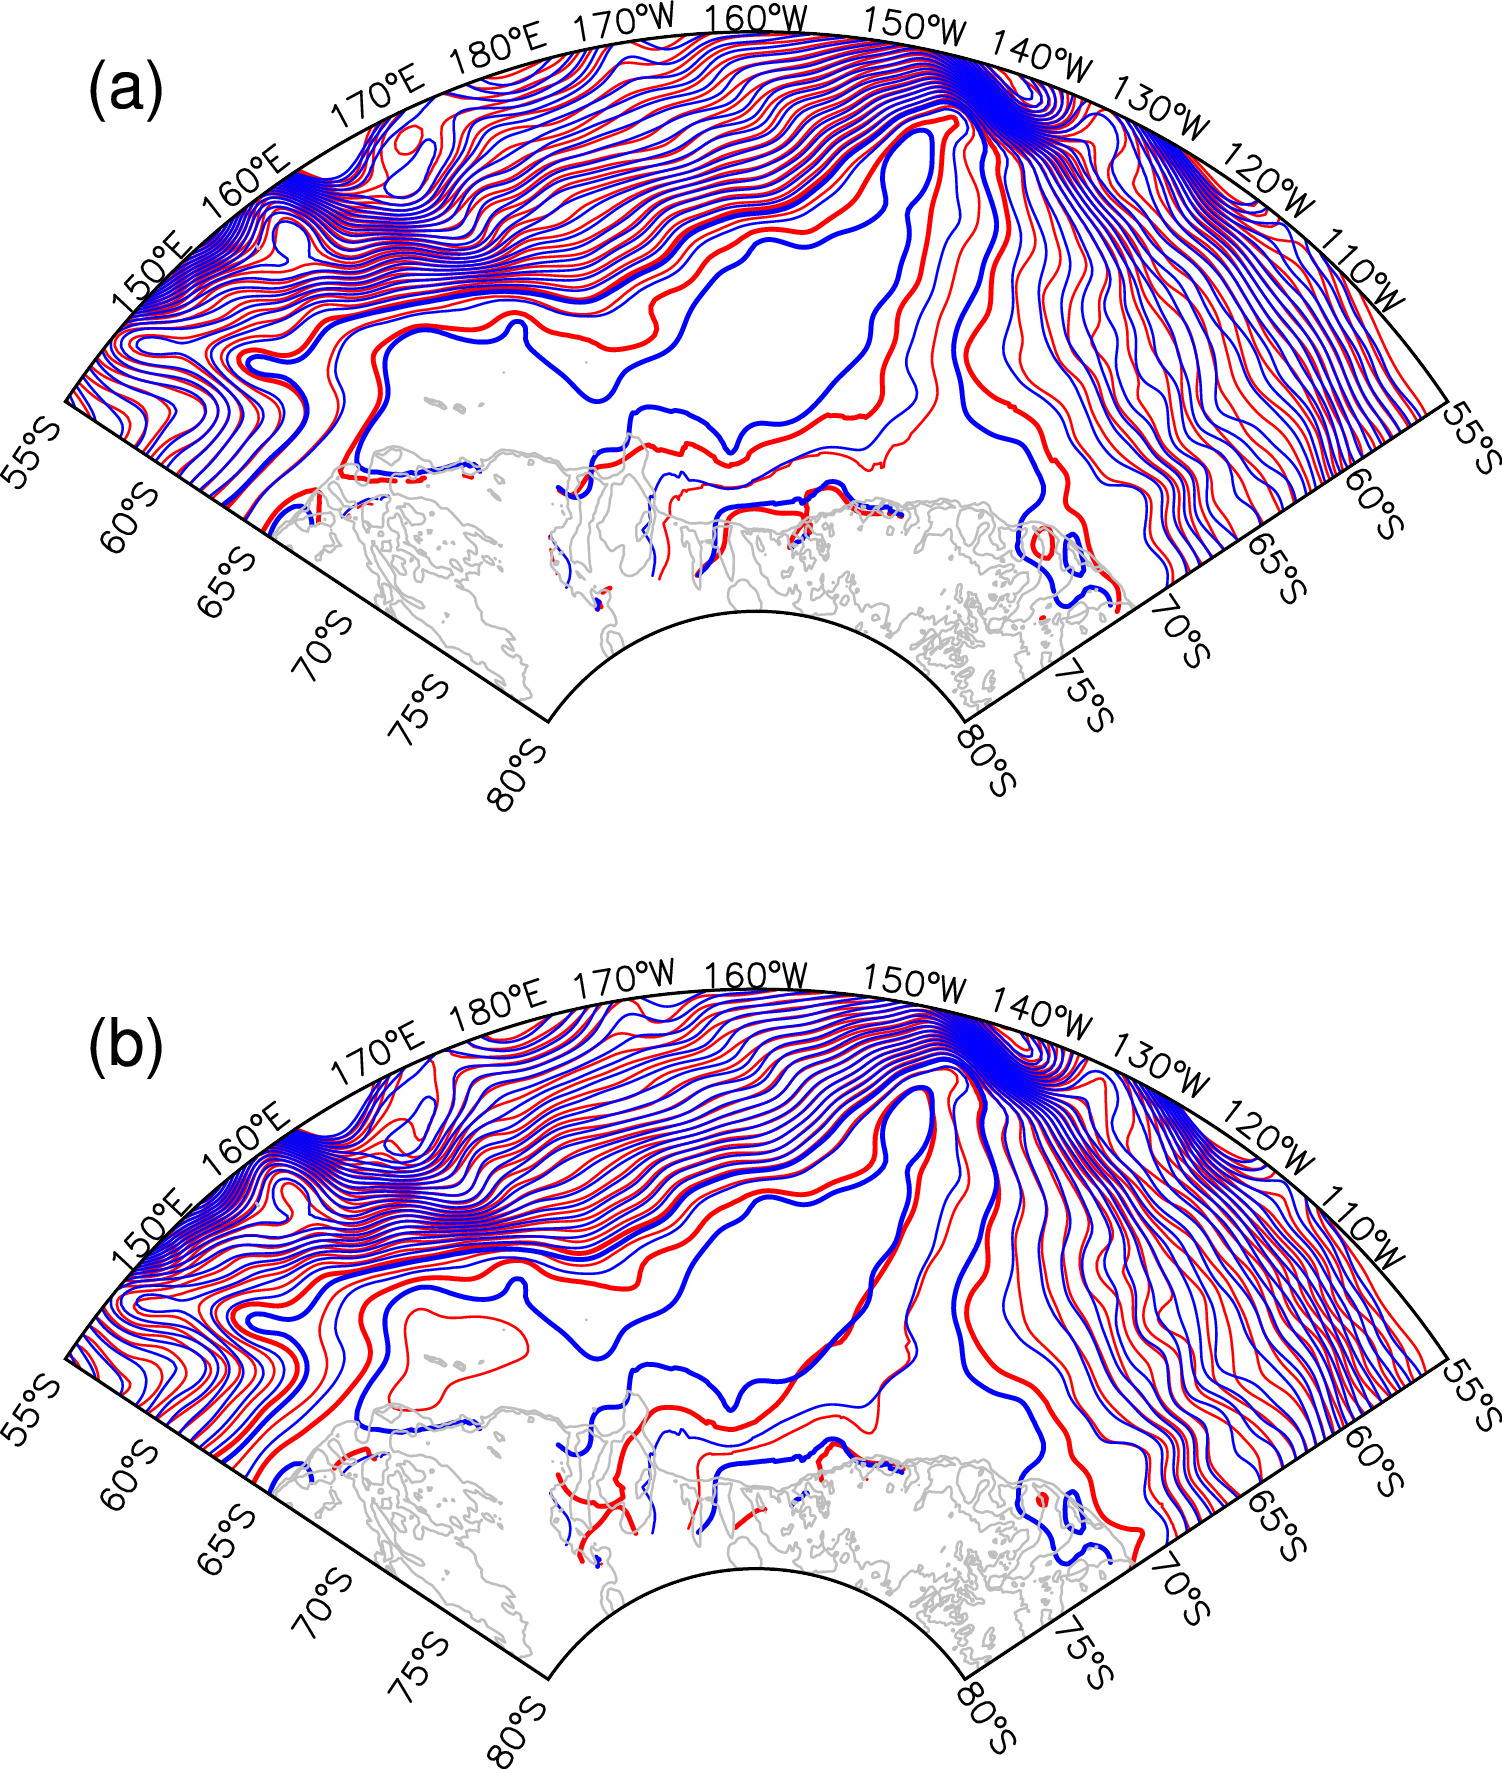
Based on the RG_EB longitude time series (figure 2), the years characterized by positive anomalies in RG_EB longitude are identified and listed in table 2. The positive (negative) anomalous year is defined as higher (lower) than the mean plus 0.5 times standard deviation of RG_EB longitude (figure 2(a)). The composite SSH (or averaged SSH) for positive anomalous years is compared with that of corresponding neutral years (figure 3). In the case of a positive anomaly in RG_EB longitude (figure 3(a)), the −1.25 m contour exhibits a wider area in the Ross Sea. Furthermore, the south limb of the Ross Gyre during positive anomalous years shifts southward compared to neutral years. Simultaneously, the ADT of −1.15 m demonstrates eastward movement for positive anomalous years versus neutral years. The −1.15 m contour intersects the Amundsen Sea Slope at a longitude of 110° W during positive anomalous years, while it intersects at 120° W during neutral years. Therefore, the ADT differences are observed in the Amundsen Sea due to the zonal movement of RG_EB.

Figure 3. Composite SSH (ADT) due to longitude of RG_EB. SSHs are spaced every 0.05 m. Thick solid lines represent −1.15 and −1.25 m. (a) Positive anomaly (red lines) versus neutral condition (blue lines), and (b) Negative anomaly (red lines) versus neutral condition (blue lines). Isobaths of 500 and 1000 m are also presented (grey solid lines).
Download figure:
Standard image High-resolution imageTable 2. Anomalous years due to longitude of Ross Gyre Eastern Boundary a .
| Anomaly | N | Year |
|---|---|---|
| positive | 10 | 1996 1999 2000 2002 2007 2009 2011 2012 2014 2015 |
| neutral | 12 | 1995 2003 2004 2005 2006 2008 2010 2013 2016 2018 2019 2020 |
| negative | 6 | 1993 1994 1997 1998 2001 2017 |
Conversely, for negative anomalies in RG_EB (figure 3(b)), the −1.25 m contour line are similar to that in neutral years in the eastern Ross Sea. However, in the central and western Ross Sea, the −1.25 contour line appears more southerly along the south limb, in comparison to the neutral year of RG_EB. This difference becomes particularly evident near the Ross Sea Shelf (175° E). Meanwhile, the −1.15 m contour is near the Amundsen Sea Slope at a longitude of 110° W during negative anomalous years, while it intersects at 120° W during neutral years. The intersection point between the −1.15 m contour and the Amundsen Sea Slope undergoes a significant shift due to variations in RG_EB.
Changes in the ADT resulting from variations in RG_EB longitude contribute to alterations in the surface geostrophic circulation patterns, as illustrated in figure 4. During positive anomalous years, a mainly southward circulation is observed at deep basin (approximately 122° W and 71° S), with an associated current speed of approximately 0.3 cm s−1. Around the slope near the central trough of the Amundsen Sea (117° W, 71.5° S), the dominant circulation is southward. Hence, the presence of a positive anomalous RG_EB longitude induces an on-slope surface current near the slope of the central trough. For the western trough of the Amundsen Sea (Dotson-Getz Trough), the observed difference manifests as southwestward circulation predominantly near (118° W, 73.2° S). Besides, there is a southward (on-shelf) circulation near the western Amundsen Sea Shelf (125° W, 73° S).

Figure 4. Composite surface geostrophic current difference in the Amundsen Sea due to longitude of RG_EB. (a) Positive minus neutral. (b) Negative minus neutral. Results passing 95% significance test are shown. Contours are corresponding ADTs. Thick solid lines represent −1.15 and −1.25 m ADTs. Isobaths of 500 and 1000m are also presented (grey solid lines).
Download figure:
Standard image High-resolution imageDuring negative anomalous years in RG_EB longitude, a northward flow exists in the western deep basin near (130° W, 70.5° S). Meanwhile, a northward circulation is observed near the western slope of the Amundsen Sea (122° W, 72.7° S) with a current speed of approximately 0.5 cm s−1. Therefore, negative RG_EB longitude anomaly plays a significant role in driving substantial shelf-basin exchange processes in the western Amundsen Sea. Additionally, a predominantly northward flow is evident at the eastern trough of the Amundsen Sea Shelf (107° W, 72° S).
4. Discussion
Dotto et al (2018) calculated the monthly barotropic transport of RG from November 2010 to February 2016. Their time series shows that the barotropic transports in 2011, 2014 and 2015 were positively anomalous in January. In this paper, the RG_EB longitudes are positive anomalies over these three years (table 2). Accordingly, the barotropic transports in 2013 and 2016 were nearly neutral or negatively anomalous (Dotto et al 2018), and the corresponding RG_EB longitudes are neutral here. Therefore, the present RG_EB longitude describes some dynamic characteristics of RG barotropic transport.
Regarding the data quality of ADT, Volkov and Pujol (2012) compared the altimeter data with in situ tide gauges and surface drifters in the Arctic region. The results show that in the deep ocean, the data quality is good. In shallower seas, however, the data quality is still relatively poor. Therefore, present composite analysis in the deep basin is relatively reliable, but the results on the shelf need to be further tested.
A high correlation coefficient is observed between the longitude and latitude of the RGC (figure 2). This relationship can be parameterized as a linear regression model:

where the coefficients are determined to be a = 0.268 and b = −121.77. The regression line of latitude versus longitude also defines a distinct section, which is suitable for in situ observations aimed at monitoring the RGC.
Furthermore, the surface circulation in the Ross Sea is modulated by the RG_EB. During positive anomalies in RG_EB longitude (figure 5(a)), a westward flow is observed in the area of [73° , 74°]S and [157°, 167°]W. Around 167° W and 74° S, the flow turns southwestward. Along the 175° W longitude, a northward flow is observed within the latitude band of [70°, 73°]S. Additionally, a southward flow is found near 180° W, 72.7° S. Conversely, during negative anomalies in RG_EB longitude (figure 5(b)), southward and eastward flows are observed in the area of [150°, 160°]W and [70°, 73°]S. Meanwhile, a clear southward circulation exists near 153° W and 75° S, with a current speed reaching 0.8 cm s−1. Within the latitude band of [74°, 76°]S, a southward circulation is observed near 170° W.

Figure 5. Composite surface geostrophic current difference in the Ross Sea due to longitude of RG_EB. (a) Positive minus neutral. (b) Negative minus neutral. Results passing 95% significance test are shown. Contours are corresponding ADTs. Thick solid lines represent −1.15 and −1.25 m ADTs. Isobaths of 500 and 1000m are also presented (grey solid lines).
Download figure:
Standard image High-resolution image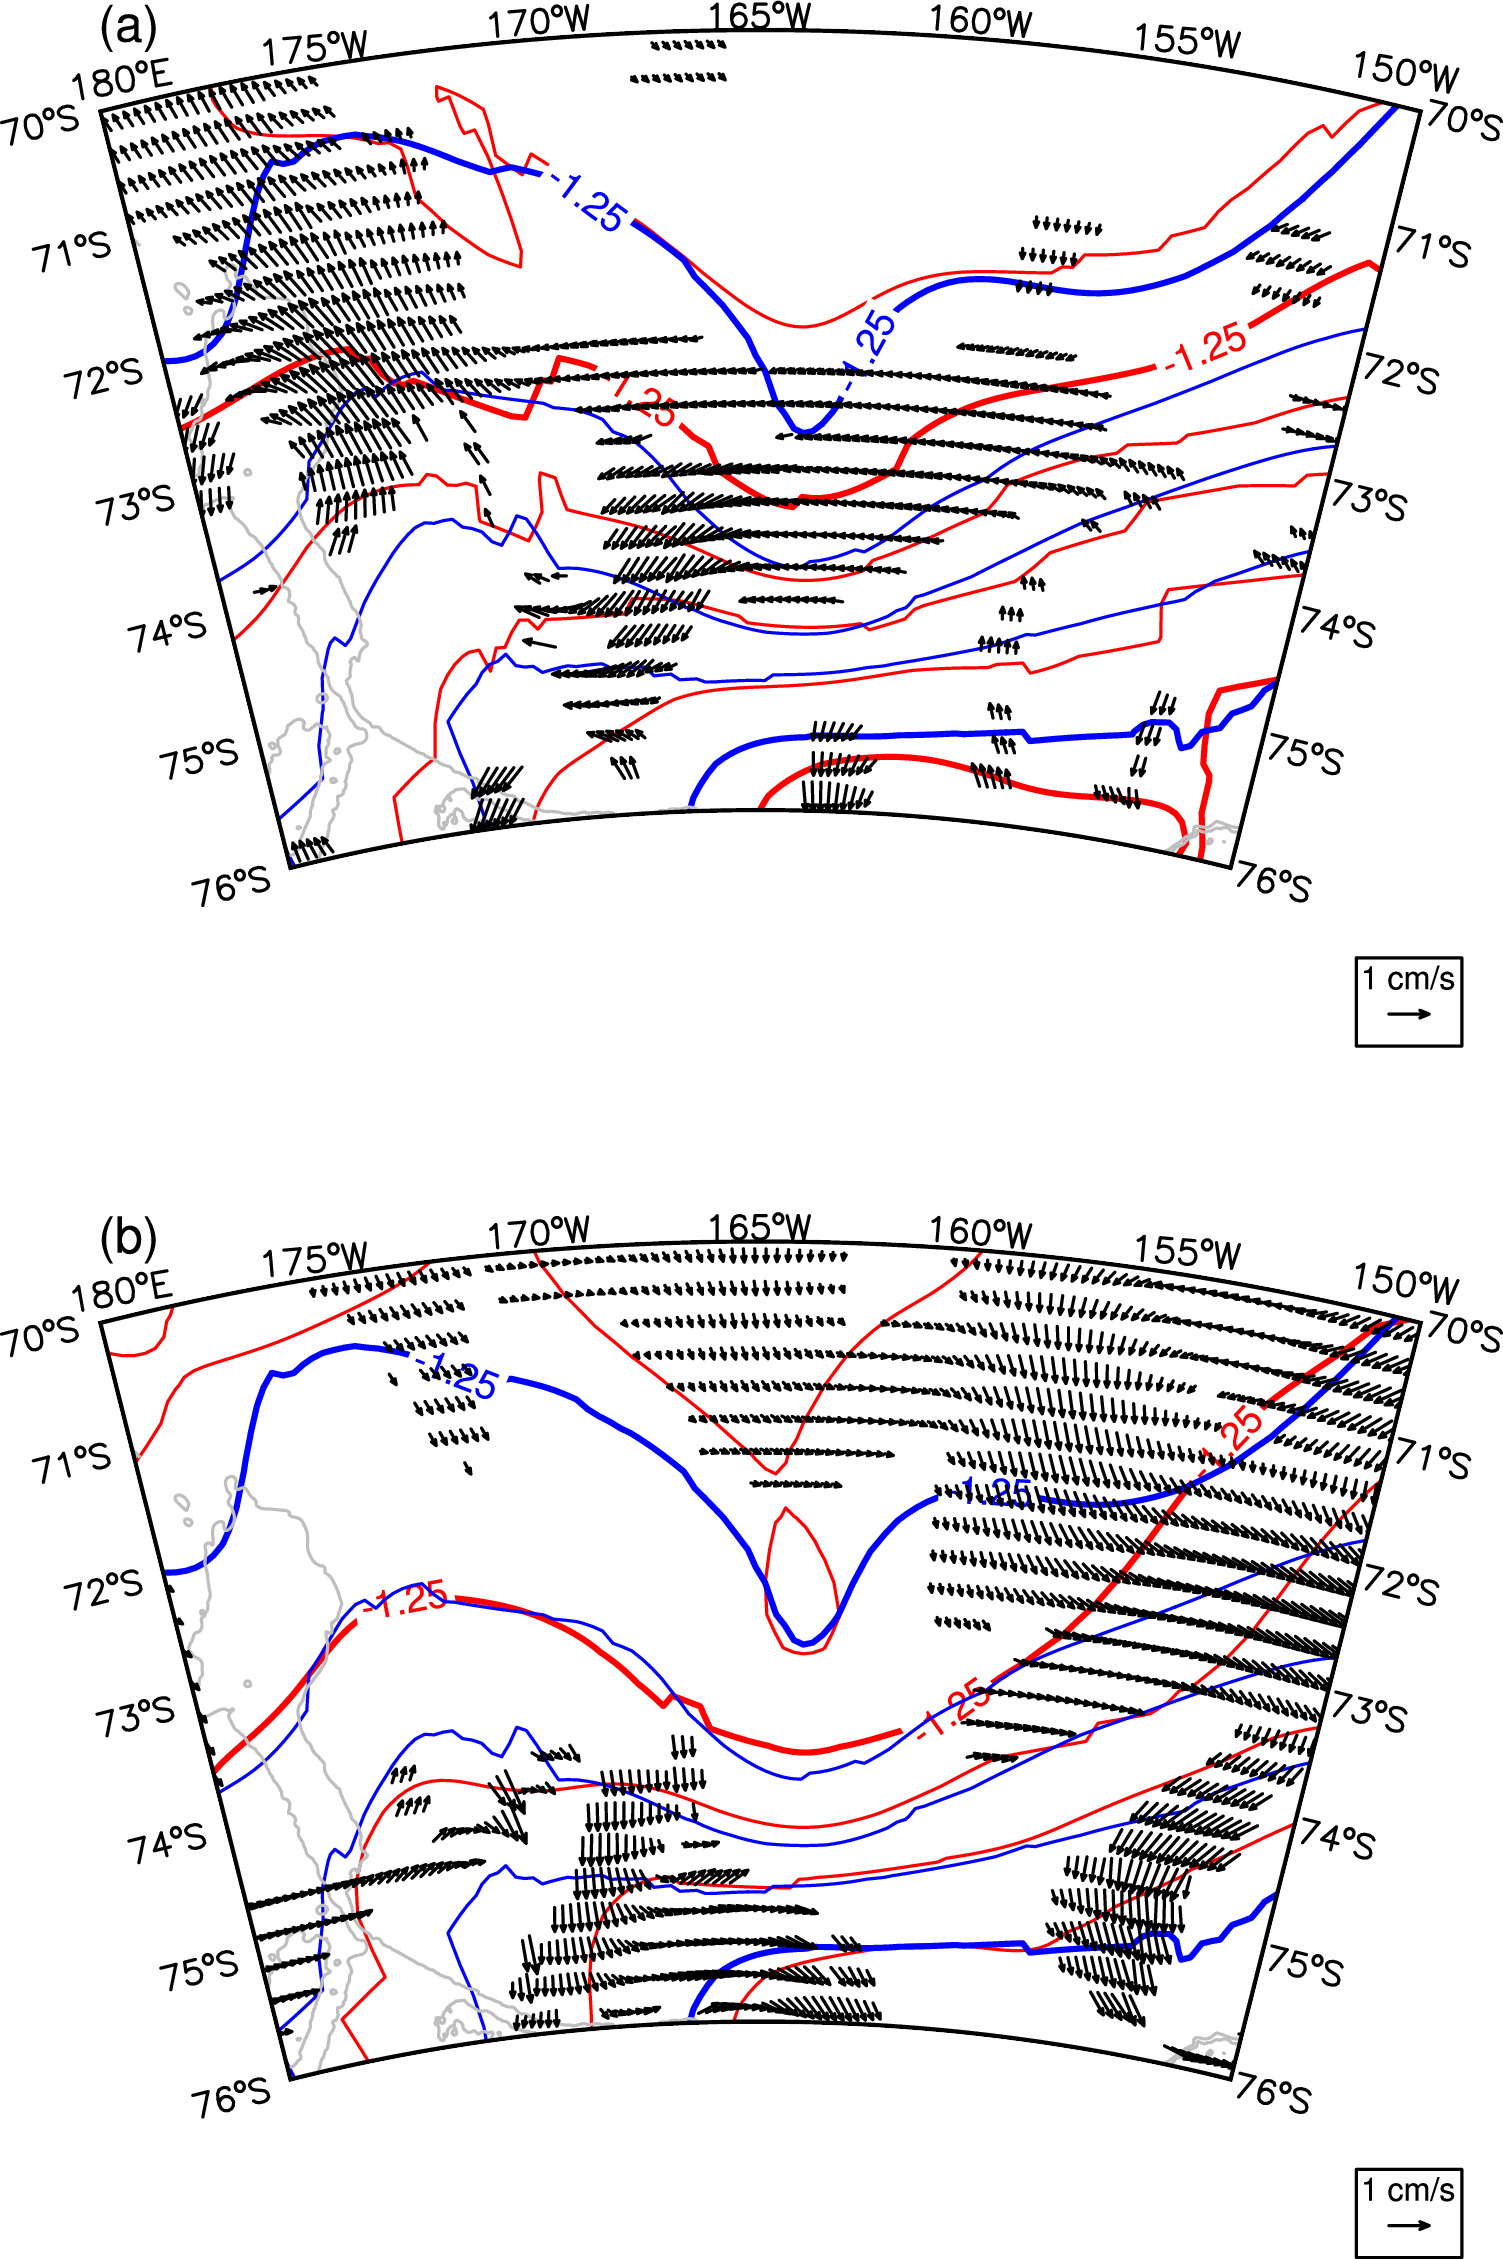
5. Conclusions
The RG_EB has been detected for the furthermost closing contour of the gyre based on satellite-derived SSH datasets. In this study, I have examined the interannual movement of the RG_EB longitude during the month of January. The mean longitude of the RG_EB from 1993 to 2020 is determined to be at 147.39° W, with interannual standard deviations of 4.29° in longitude. Furthermore, the RGC's intensity is described by the relative ADT between local minimum ADT and surrounding last closing ADT, with a mean value of −0.041 m and an interannual standard deviation of 0.015 m.
Moderate correlations between the RG_EB longitude and the ASL have been observed. The RG_EB longitude exhibits a considerable correlation of −0.46 with the actual pressure of the ASL. CCs between ASL longitude and RGC attributes (RGC Lon, RGC Lat, and RGC Rel_ADT) are all stronger than −0.35. These findings highlight the possible association between the Ross Gyre and the ASL.
The impacts of changes in RG_EB on the surface circulation of the Amundsen Sea have been investigated through composite analysis. During positive anomalous years, the −1.25 m contour expands more than that in neutral years. For negative anomalies in RG_EB longitude, the intersection point between the −1.15 m contour and the Amundsen Sea Slope undergoes significant variations, shifting approximately 10° eastward compared to neutral years.
In the case of a positive anomaly in RG_EB longitude, on-slope surface currents are induced near the central trough. Meanwhile, in the western trough (Dotson-Getz Trough), the main difference is observed as southwestward circulation. In the case of a negative anomaly in RG_EB longitude, a northward current of approximately 0.5 cm s−1 is induced on the western slope of the Amundsen Sea (122° W). These results have passed a 95% significance test, demonstrating the significant influence of RG_EB longitude on the surface circulation of the Amundsen Sea.
Data availability statement
Sea surface height data were provided by CMEMS (https://marine.copernicus.eu/). AAO index was downloaded from NCEP (http://www.cpc.ncep.noaa.gov/). ASL index was given by http://scotthosking.com/asl\_index. ENSO index was available at http://psl.noaa.gov/enso/. Present data are available at http://doi.org/10.6084/m9.figshare.25534099.v1.
Disclosure statement
The authors declare no conflict of interest.
Funding
This research was funded by the Impact and Response of Antarctic Seas to Climate Change (IRASCC) Project (Grant No. 01-01-01B, 02-01-02).