

Abstract
Comprehending invasive alien species' potential habitat area and spread trend are of great importance for effective prevention and control strategy and prevention of spread. However, previous studies have mainly been based on large regional scales (national or global level). Research on the smaller regional scale of ecologically fragile karst makes the prevention and control measures more feasible and targeted, it is of great significance to protect mountainous region species diversity and maintain national nature reserves. In this study, based on the distribution point data of Solidago canadensis in Guizhou Province and environmental factors, Pearson correlation analysis and contribution rate analysis of environmental factors were carried out by SPSS and knife cutting method, and current and future potential distribution vector maps were obtained by MaxEnt model, and then imported into ArcGIS for reclassification and visualization. The results show that, (1) the main drivers of S canadensis distribution were precipitation changes and human activities, the total contribution rate more than 70%; (2) S canadensis occurrence probability initially increased, and then decreased with increased precipitation variables, and increased rapidly initially, then gradually with increasing human footprint; (3) under current climate conditions, S canadensis suitable area is 8.13 × 10⁴ km2, with the highly suitable area concentrated in Guiyang, east of Bijie, Zunyi, Anshun and Qiannan. Under climate conditions of the 2050s, the suitable area drops slightly to 8.00 × 10⁴ km2, mainly in the west and north of Zunyi, Anshun and other areas reduced. Under climate conditions of the 2070s, the suitable area expands to 8.31 × 10⁴ km2, it expands in the adjacent areas of Anshun, Qiannan and Qianxinan and the junction of Zunyi, Tongren, Qiannan and Qiandongnan. And move toward the south within the study area; (4) finally, using the spatial optimization software ZONATION, according to the landscape loss proportion curve, the key monitoring area of 79,857 km2 was obtained, including a primary monitoring area mainly distributed in Guiyang, east of Bijie, northeast of Anshun and northwest of Qiannan, a secondary monitoring area mainly outside the primary monitoring area, and a third-level monitoring area widely distributed in Zunyi, Tongren, Qiannan, west of Qiandongnan and Anshun and east of Bijie. Linking our results with this specie's invasive power, we thus recommended to increase the prevention and control sites in the first-level monitoring area, and continue to pay attention to the risk of the southward spread of this species.
Export citation and abstract BibTeX RIS

Original content from this work may be used under the terms of the Creative Commons Attribution 4.0 licence. Any further distribution of this work must maintain attribution to the author(s) and the title of the work, journal citation and DOI.
1. Introduction
Solidago canadensis (Asteraceae) is a North American perennial rhizo-herbaceous herb introduced to China in 1935 as a garden flower [1, 2]. The species is highly fertile, reproducing both asexually (rhizomes) and sexually (seeds). Typically, a single plant can produce up to about 70,000 seeds that have a high seed germination rate. Additionally, its roots have many well-developed rhizome structures, each of which can sprout into a separate individual [3]. S canadensis also has a higher nutrient accumulation capacity than native plants [4]. Competing with native species for water and fertilizer. Therefore, this species can quickly occupy the habitats after invasion and form a high-density single populations. S canadensis may promote its invasibility by secreting allelochemicals to inhibit seeds germination and growth of native plants and soil-borne pathogens, and change the soil microbial community [5–8]. Furthermore, the species is also able to rapidly evolve polyploidy by regulating gene expression through DNA methylation, to enhance asexual reproduction, to promote phenolic substance metabolism to strengthen the sensory effect and to adapted to new environment quickly, improving invasion competitiveness [9–11]. Successful invasions will breed with native species, resulting in genetic erosion of the native taxa [12]. To sum up, S canadensis inhibits the growth of native plants, destroys original vegetation, and seriously endangers agricultural and forestry production, ecosystem stability, biodiversity and human health by virtue of its powerful invasiveness [13, 14]. In addition, climate change is also having a vital impact on plants invasion, on the one hand, it may make invasive habitats more suitable for invasive plants growth, and on the other hand, it may promote invasion by altering plants' phenotypic plasticity [15, 16]. Research shows that, S canadensis has a wide potential distribution area under the future climate change in China, and it is still spreading [17]. To formulate scientific prevention and control strategies and effectively control its invasion, it is necessary to know its potentially suitable area and diffusion tendency.
Species distribution models (SDMs) can predict potential species distributions by matching their environmental data with their spatial distribution [18]. Currently, models used to simulate potential invasive species distributions include BIOCLIM, maximum entropy modeling (MaxEnt), rule set Genetic algorithm (GARP), generalized linear models (GLM) and generalized additive models (GAM) [19]. MaxEnt is widely used because of its ability to handle continuous and categorical variables, sparsely sampled data and small positional errors, as well as its simplicity of operation and stability of statistical procedures [20, 21]. Recently, some scholars have predicted S canadensis distribution and spread. Jiao Xinyu et al studied the spread dynamics and influencing factors of S canadensis in Hubei province, providing a reference for formulating effective prevention and control measures [22]. Pan Mingxin et al used MaxEnt simulation to predict the suitable areas of S canadensis in China, and showed that the suitable areas in 2050 and 2070 would increase by about 100,000–130,000 square kilometers compared with the current distribution [11]. LU Jianzhong et al made a similar prediction, and showed that the potential S canadensis invasion area was much larger than the actual distribution area, and it would continue to spread [23]. Birut Karpaviien et al studied S canadensis distribution in Lithuania using herbarium and field investigation data, and found that it mostly occurs in abandoned fields and roadsides, and from a competitiveness perspective, may be more distributed in the future [24]. Zhong Linxu et al found that the future climate will become warmer and wetter, which may drive further S canadensis expansion [25]. All the above studies indicated that the spatial distribution of S canadensis would continue to expand under the future climate conditions, and provided a scientific and powerful reference for its effective prevention and control.
Guizhou Province is located on the Yunnan-Guizhou Plateau in the southeast of southwest China, it has unique geographical environment, there is a saying that 'eight mountains, one water and one field', rich vegetation and diverse species, there are several national nature reserves. For example, Maolan Nature Reserve, Chishui tree fern Reserve, Caohai Nature Reserve and so on. At the same time, the karst area accounts for 61.9% of the total land area of the province, the soil layer is barren and the fertility is low, which is a fragile ecological environment [26]. Vulnerable to invasive alien plants. According to Guizhou Academy of Forestry research, as of December 2018, there were 217 invasive alien species in Guizhou, research shows that in the next 5–10 years, Guizhou Province will have more than 500 invasive species, and 100 malignant invasive species in the world will invade Guizhou [27]. S canadensis is one of the malignant invasive weeds in China. Zhang Ya et al mentioned in the article 'Guizhou Seed New record VI', this species is a new record in Guizhou and was found in Guanshanhu Park, Guiyang City, because it is an invasive alien species, the park organized workers to remove it in 2013 [28]. From 2016 to 2017, Ye Xiaohong carried out a special investigation on exotic forestry harmful plants in Zunyi City, Guizhou Province, S. canadenadenis was first found in the green belt along the Ring highway in Zunyi city center in 2016, until 2018, artificial mechanical control and chemical control have been organized every year, but it was still not easy to eradicate [29]. From 2018 to 2021, S canadensis was found successively in Dushan, Guiding, Duyun, Fuquan, Changshun and Huishui [30]. Wang Kui et al used the index system of forest pest risk analysis to assess the risk of S canadensis in the Qiannan area of Guizhou province, and concluded that this species belongs to the particularly dangerous invasive species in the Qiannan area [30]. To sum up, S canadensis has spread in Guizhou in its early years, and eradication is difficult. Therefore, the prediction of the distribution of S canadensis in Guizhou Province is of great significance for the protection of species diversity, ecosystem and nature reserves in Guizhou Province, providing a strong reference for the accurate distribution of prevention and control measures.
At present, the study of S canadensis in Guizhou Province is still limited to the detection, control and risk analysis, and the prediction of its invasion in Guizhou Province has not been reported. Therefore, we address the following questions. What is the spreading trend of S canadensis in Guizhou under future climate scenarios? What are the main environmental factors that drive its spread? How do we identify key monitoring areas? To answer the questions, we used MaxEnt and ZONATION software, combined with ArcGIS to: (1) predict suitable areas for S canadensis in Guizhou Province; (2) identify environmental factors that play a dominant role in its dispersal and distribution; and (3) determine key monitoring areas. Hence, we hope to provide a theoretical reference for the local prevention and control of S canadensis from a scientific viewpoint.
2. Materials and methods
2.1. Materials
2.1.1. Study area overview
Guizhou Province is located on the Yunnan-Guizhou Plateau, southwest China, over a geographical range of 103°36'−109°35' E to 24°37'−29 °13' N. The total province area is 176,167 km2, with an average elevation of about 1,100 m above sea level. The terrain is high in the west and low in the east, with mostly plateau and mountainous areas, with a unique geographical environment and typical karst geomorphology (the karst area accounts for c. 61.9% of the province land area). It has a subtropical warm-wet monsoon climate, abundant precipitation and an annual average temperature of about 15 °C [26].
2.1.2. S canadensis distribution data
S canadensis distribution data was obtained from field investigation. Geographical coordinates of specie distribution points were recorded by GPS, and the specie name, longitude and latitude entered into an Excel table and saved in csv format. A total of 162 distribution sites were obtained, which mainly occurred in central, northern and southeastern Guizhou Province (figure 1).
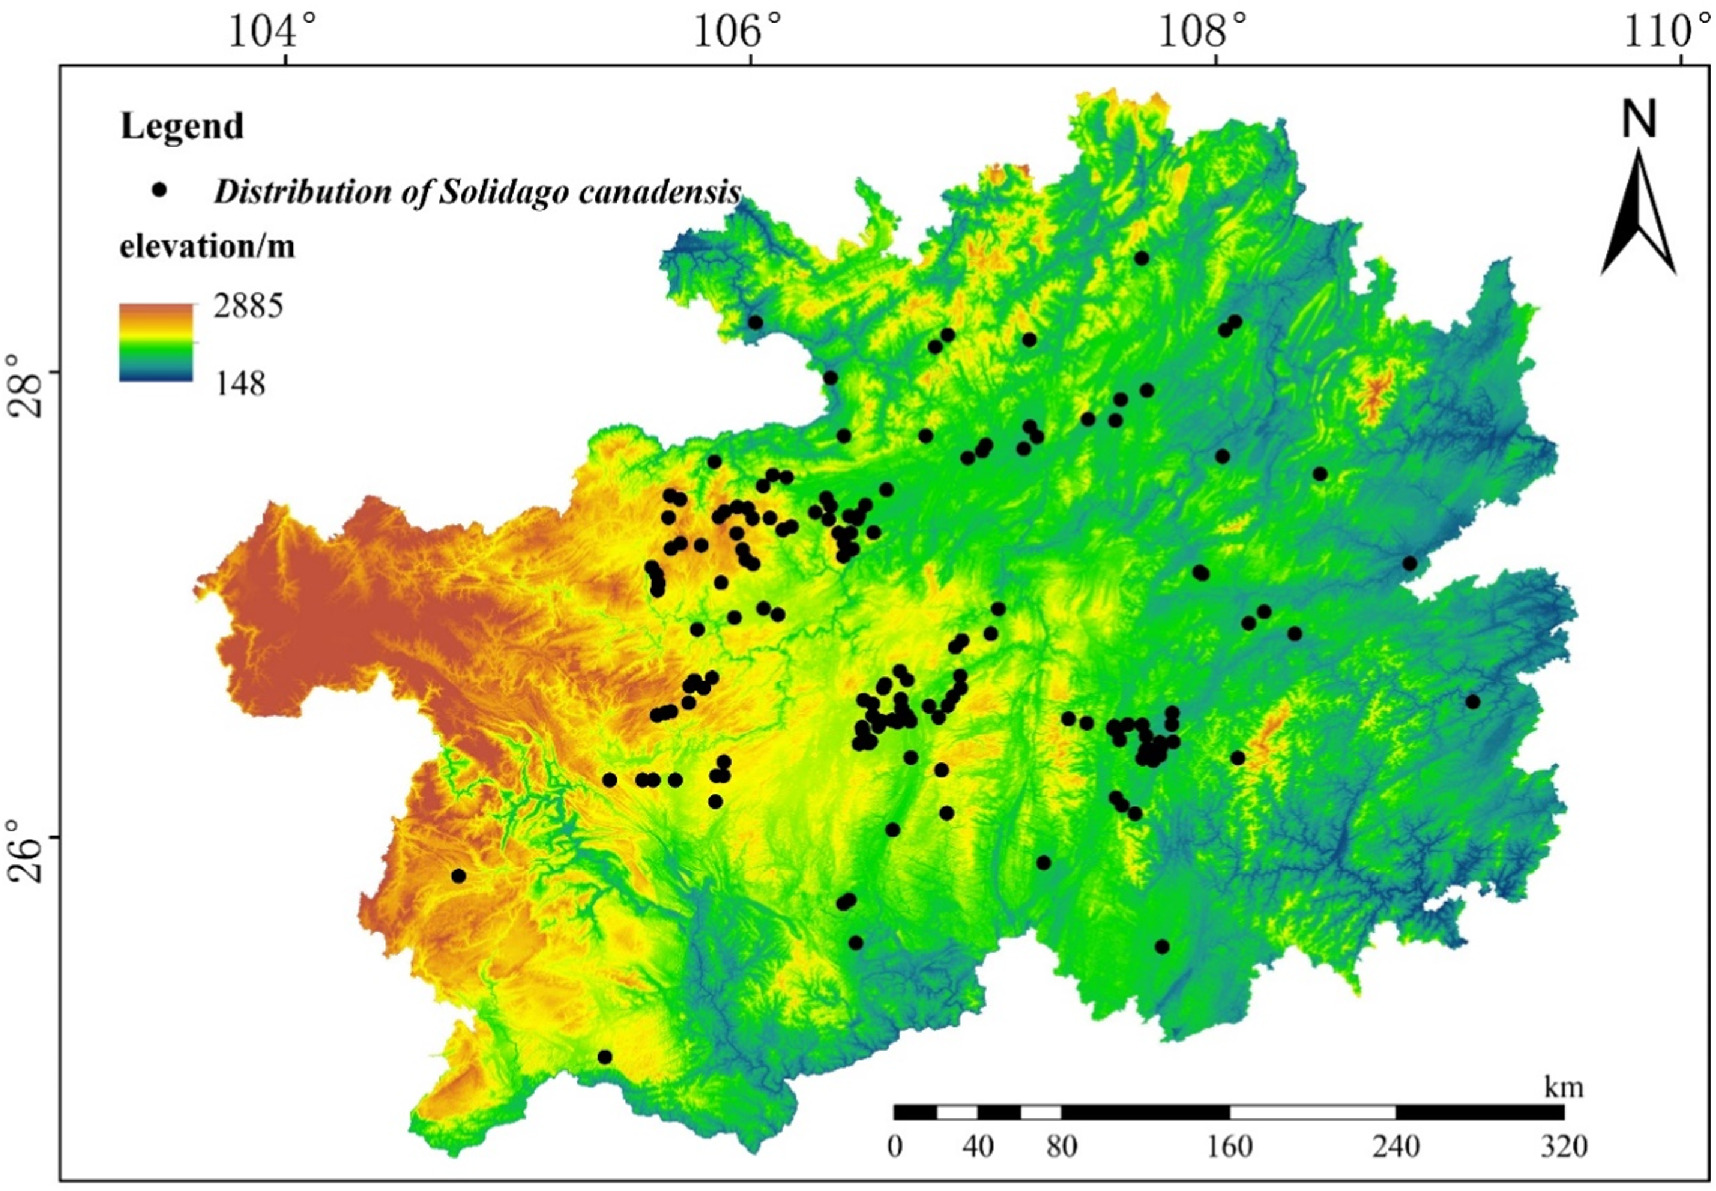
Figure 1. Distribution of Solidago canadensis in Guizhou Province.
Download figure:
Standard image High-resolution image2.1.3. Relevant geographic information and environmental data
The Guizhou Province vector base map used in this study was downloaded from the China Basic Geographic Information System (http://nfgis.nsdi.gov.cn).
Environmental variable data included bioclimatic, topographic and soil factors and human activity intensity, totaling 60 environmental factors. Bioclimatic variables and elevation data for current (1970–2000), future (2050s; 2041–2060 mean) and 2070s (2061–2080 mean) were derived from the Worldclim v2.1 dataset (http://www.worldclim.org), The future climate model data adopted the ssp245 scenario under the BCC_CSM2_MR model developed by the National Climate Center of China, and represents the intermediate development path under medium radiative forcing. The spatial resolution was 30' [31]. Elevation data were downloaded from the Geospatial Data Cloud (http://www.gscloud.cn) at a spatial resolution of 30m. Based on the elevation data, slope and slope direction were generated using the ArcToolbox surface analysis tool in ArcGIS [32]. Soil factor data were obtained from the World Soil Database (HWSD V1.2, http://www.Fao.org), with fields beginning with T_ indicating upper soil properties (0–30 cm) and fields beginning with S_ for lower soil properties (30–100 cm). Human activity intensity data was downloaded from https://sedac.ciesin.columbia.edu [33], specifically the 2009 human footprint. The above data were processed based on the Guizhou Province vector base map through ArcGIS10.8 software by tools such as mosaicking to new raster, reclassification, masking and resampling, with a uniform coordinate system of WGS-1984 and a uniform raster size of 30 arcseconds, and finally transformed into ASCII format files [34].
2.2. Methods
2.2.1. Data preprocessing
To avoid sampling bias leading to model overfitting, ArcGIS is usually used to divide the study area into a 1km × 1km grid, randomly retaining the unique species distribution points in the grid to reduce spatial autocorrelation [35]. However, this was unnecessary as we made the distance between the two points greater than 1km during the actual trekking process.
Each environmental factor contributes differently to species distribution prediction, and if the correlation between the factors is high, it will reduce model prediction accuracy [36]. Therefore, to ensure model prediction precision and improve accuracy, species distribution points and all environmental factor data were imported into MaxEnt version 3.4.1. Then, the knife-cut method was applied to obtain the contribution rate of each environmental factor to the model prediction, and factors with a contribution rate < 1 were excluded, leaving 17 factors remaining. The remaining factors were analyzed by Pearson correlation analysis with SPSS software, and triangular heat maps of correlation between factors were obtained (figure 2). When |r| ≥ 0.75 between two factors, the factor with the lower contribution rate was removed. The final selection of factors involved in modeling is shown in table 1 [37, 38].
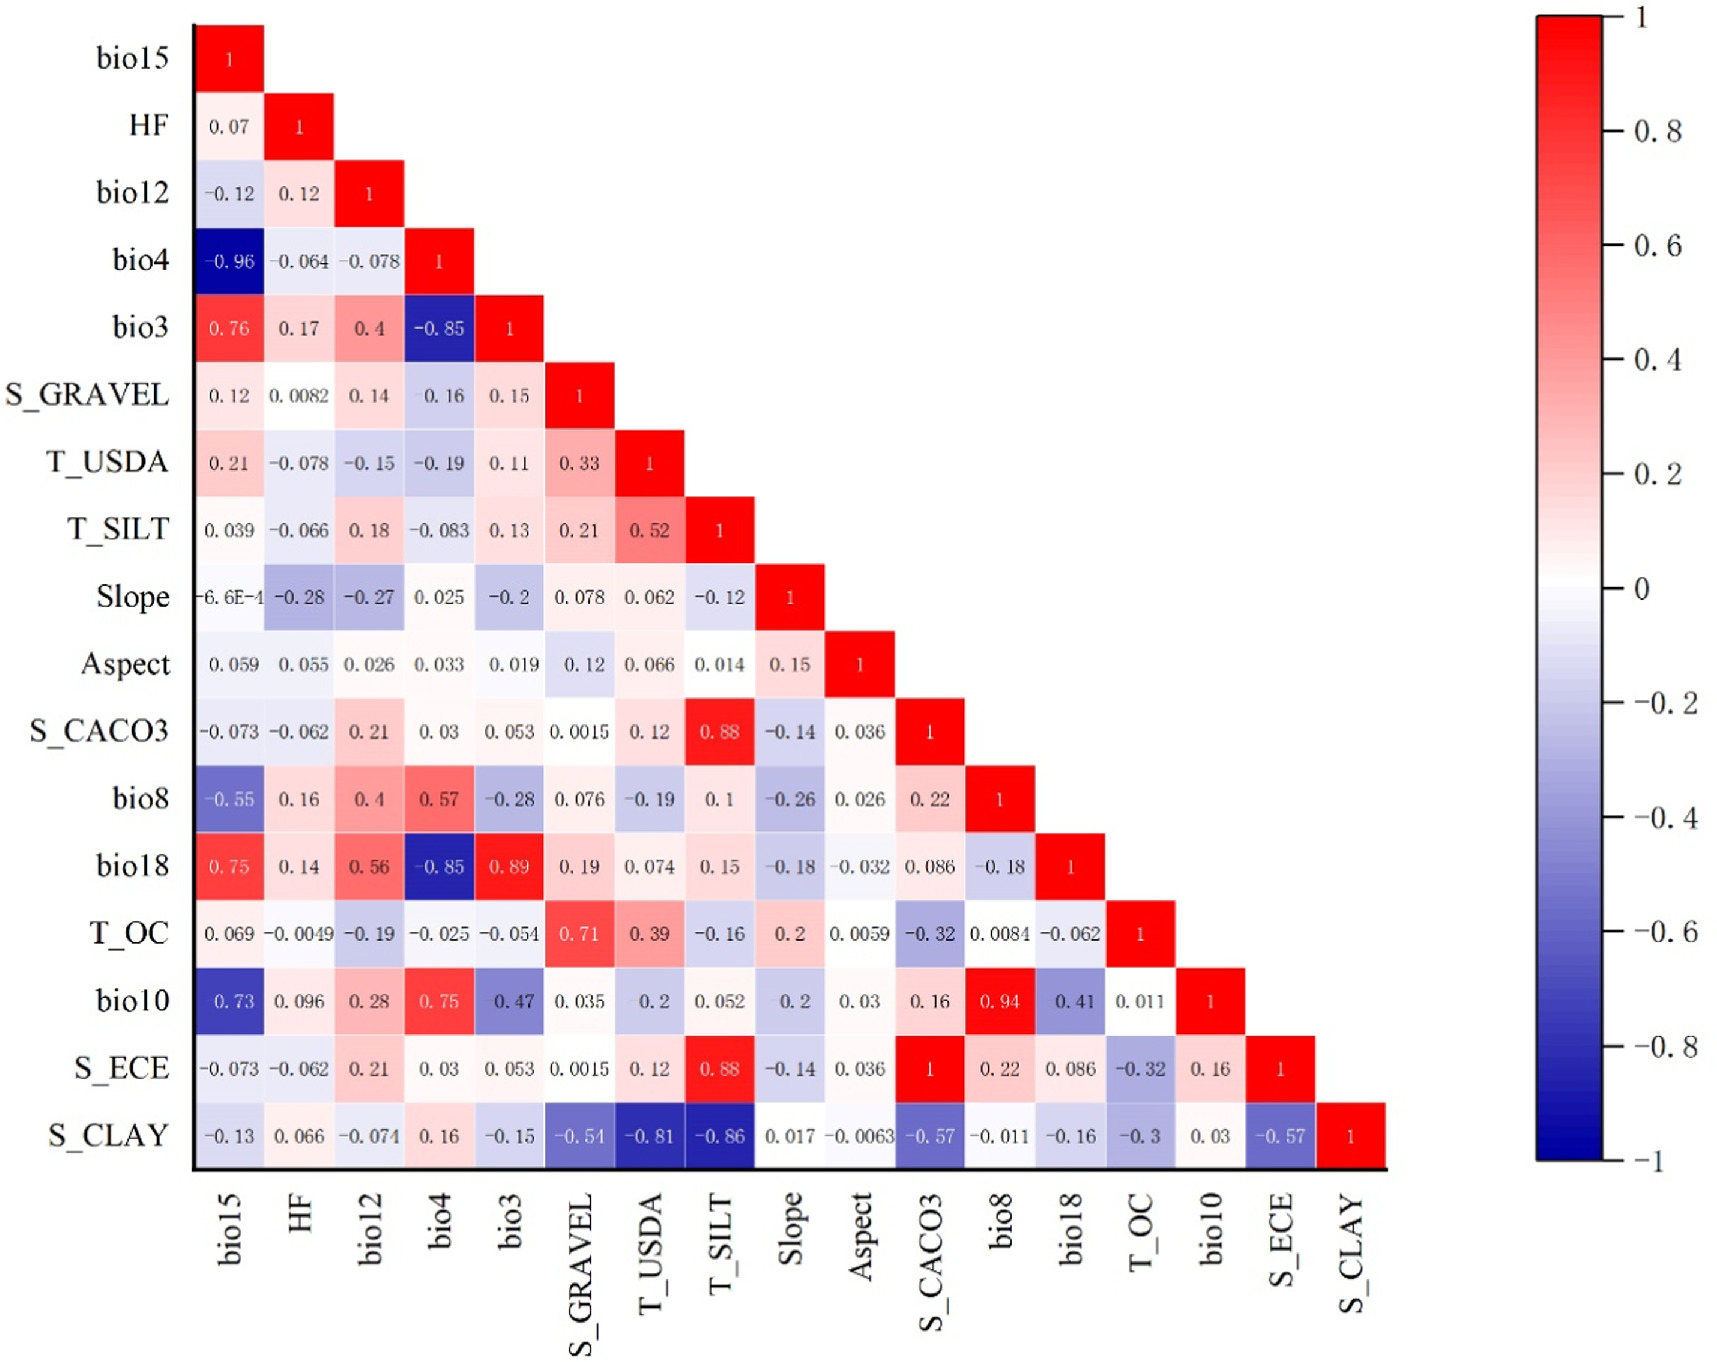
Figure 2. Heat map of environmental factors correlations.
Download figure:
Standard image High-resolution imageTable 1. Environmental factors involved in modeling.
| Category | Variable name | Description | Date sources |
|---|---|---|---|
| Climate | Bio8 | Mean Temperature of Wettest Quarter (°C) | http://www.worldclim.org |
| Bio12 | Annual Precipitation (mm) | http://www.worldclim.org | |
| Bio15 | Precipitation Seasonality (mm) | http://www.worldclim.org | |
| Soil | T_SILT | Silt content(%) | http://www.Fao.org |
| T_USDA_TEX_CLASS | Upper USDA Soil Texture Classification | http://www.Fao.org | |
| T_OC | Organic carbon content(%) | http://www.Fao.org | |
| S_GRAVEL | Volume percentage of gravel (%) | http://www.Fao.org | |
| Topography | Slope | Slope | http://www.gscloud.cn |
| Aspect | Aspect | http://www.gscloud.cn | |
| Human footprint | HF | Human footprint | https://sedac.ciesin.columbia.edu |
2.2.2. Major environmental factor identification
The MaxEnt model determines the main environmental factors through the PC-PI and knife-cut methods, where PC is the percentage contribution and PI is replacement importance. PC refers to the contribution of the environmental factor to the distribution of the species present in the MaxEnt simulation process, and PI is the degree of reduction in the simulation result AUC after randomly substituting the environmental factor of the training sample point, where the greater the reduction, the stronger the dependence of the model simulation on the factor [39]. The knife-cut method can calculate scores of environmental factors, the longer the band of 'with only variable', the higher the score, the stronger the predictive ability of this variable on species distribution; the lower the band of 'without variable', the more important this variable is to species distribution [40]. Combining these two methods, the main environmental factors that ultimately affect species distribution were determined.
2.2.3. Suitable areas prediction
S canadensis distribution points and the environmental factors obtained from the final screening were imported into the MaxEnt model. Seventy-five percent of the distribution data were randomly selected as the training set, and the remaining 25% were used for the model test. The maximum number of iterations was 10000, auto features were selected, repeated 10 times, and the remaining parameters were set to default [41].
The above output species distribution probability diagram was imported into ArcGIS, initially converted into a grid, then reclassified by analysis tools, and suitable areas for S canadensis were divided into four grades by the natural break point classification method. The Distribution Changes Between Binary SDMs tool in the SDM_Toolbox_v2.5 tool was used to visualize the center-of-mass changes in the distribution of suitable areas under current and future climatic conditions in the ssp245 climate scenario and to obtain distribution maps of regions where suitable areas remained stable, increased, or decreased [42].
2.2.4. Model accuracy evaluation
Simulation results accuracy was examined using the Receiver Operating Characteristic (ROC) curve, and the Area Under Curve (AUC) was a visualization measure between 0.5 and 1. AUC values < 0.6 were considered to be very poor simulation credibility, 0.6–0.7 credibility was poor, 0.7–0.8 credibility was fair, 0.8–0.9 credibility was good, and > 0.9 model credibility was excellent [43, 44].
2.2.5. Key monitoring areas division
Based on ZONATION4.0 software, the risk pattern of the invasion area was divided. The specific method is as follows: input the probability map of species distribution output from MaxEnt into ZONATION; select 'core-area cell removal rule' and simultaneously adopt the edge removal rule, to not only retain the species distribution core area, but also to ensure structural connectivity; set the warping factor to '1', representing the removal of one grid at a time; and set the other parameters to default values. Finally, the nested hierarchical landscape sequence was output, and the 3 level risk area was delineated according to the landscape loss curve [45], and imported into ArcGIS for graphical optimization.
3. Results
3.1. Main environmental factors affecting S canadensis distribution
The AUC value was 0.834, indicating high simulation reliability, and the simulation results of predicting S canadensis distribution were highly consistent with the actual or potential distribution range (figure 3).
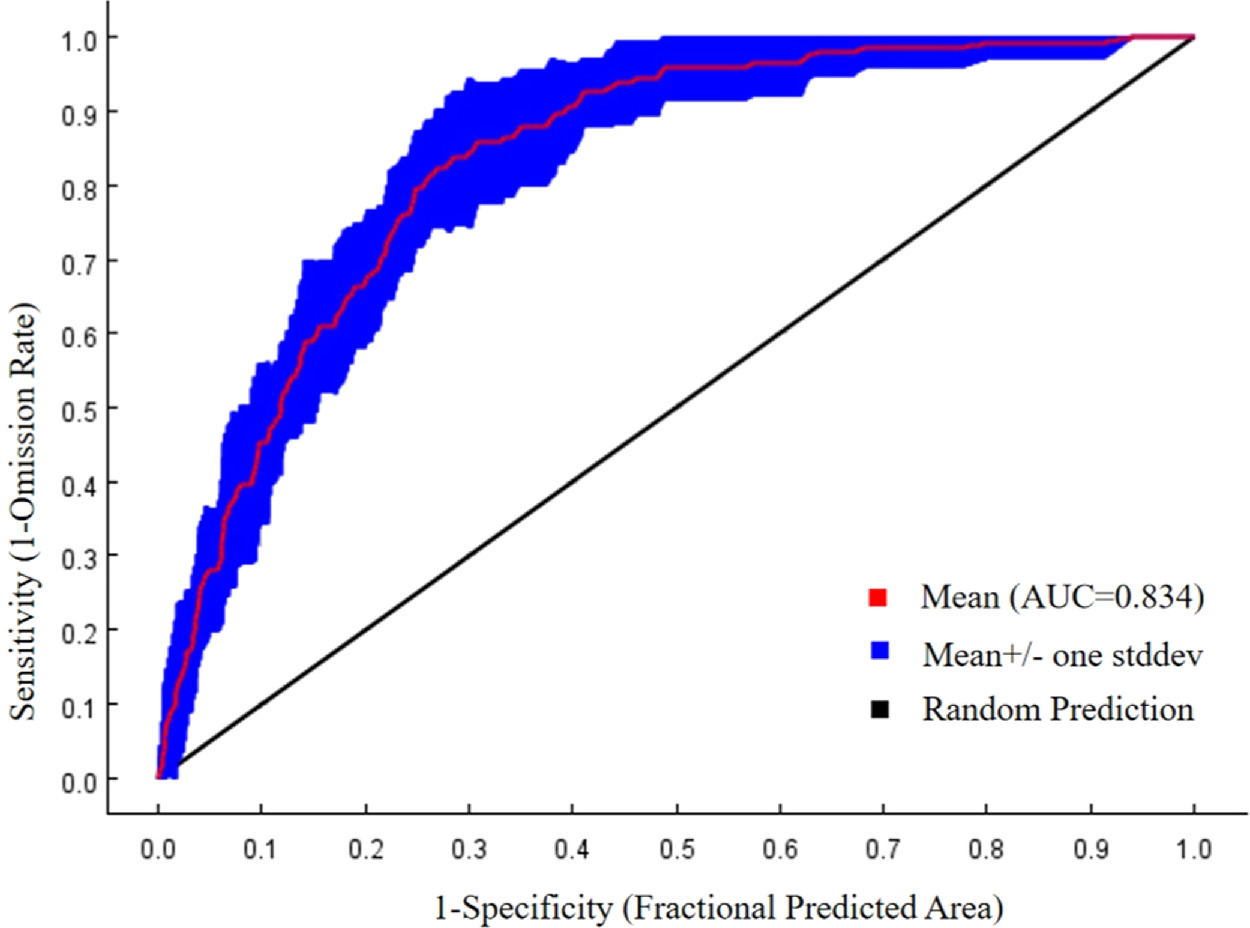
Figure 3. The ROC prediction curve of the predicted results of the potential suitable area of S canadensis.
Download figure:
Standard image High-resolution imageAmong the 10 environmental variables involved in simulation and prediction, the highest contribution rate was for seasonal change of precipitation (Bio15), indicating that it was the key factor determining S canadensis distribution (table 2). The second was human footprint (HF), which contributed 20.5%, annual precipitation (Bio12) contribution rate was 16.8%, and the contribution rate of other factors was < 10%. The contribution rate of the first three factors (74.8%), dominated S canadensis geographical distribution. When only a single variable was simulated, the effects of precipitation seasonal variation, annual precipitation and human footprint on the normalized training gain ranked from first to third, indicating that the predicted S canadensis distribution was strongly dependent on these three factors (figure 4). Therefore, precipitation seasonal variation, annual precipitation and human footprint are the main factors affecting S canadensis distribution.
Table 2. The contribution rates of environmental factors involved in modeling.
| Variable name | Description | Percent contribution (%) | Permutation importance |
|---|---|---|---|
| bio15 | Precipitation Seasonality (mm) | 37.5 | 32.5 |
| HF | Human footprint | 20.5 | 16 |
| bio12 | Annual Precipitation (mm) | 16.8 | 25.2 |
| Slope | Slope | 7.8 | 7.8 |
| T_SILT | Silt content | 5.7 | 2.9 |
| T_USDA_TEX_CLASS | Upper USDA Soil Texture Classification | 3.7 | 1.1 |
| S_GRAVEL | Volume percentage of gravel (%) | 3.1 | 4.7 |
| bio8 | Mean Temperature of Wettest Quarter (°C) | 2.5 | 3.9 |
| Aspect | Aspect | 1.9 | 2.9 |
| T_OC | Organic carbon content | 0.7 | 3.1 |

Figure 4. The Jackknife test result of environmental factors.
Download figure:
Standard image High-resolution image3.2. S canadensis distribution response to major environmental factors
When the precipitation seasonal variation is > 55 mm, species distribution probability rises rapidly to a maximum of 71 mm, then declines rapidly, and by 88 mm, it is < 0.1, indicating that as precipitation seasonal variation increases, the S canadensis distribution probability increases and then decreases (figure 5). When annual precipitation was 875 mm, species distribution probability increased rapidly, reached a maximum of 1180 mm, and then decreased rapidly, approaching 0 at 1450 mm. S canadensis distribution probability initially increased and then declined sharply with increasing annual precipitation. When human footprint was 6.5, species distribution probability increased sharply and thereafter at a lower rate, indicating that as more intense human activities increased, S canadensis distribution probability continued to increase.
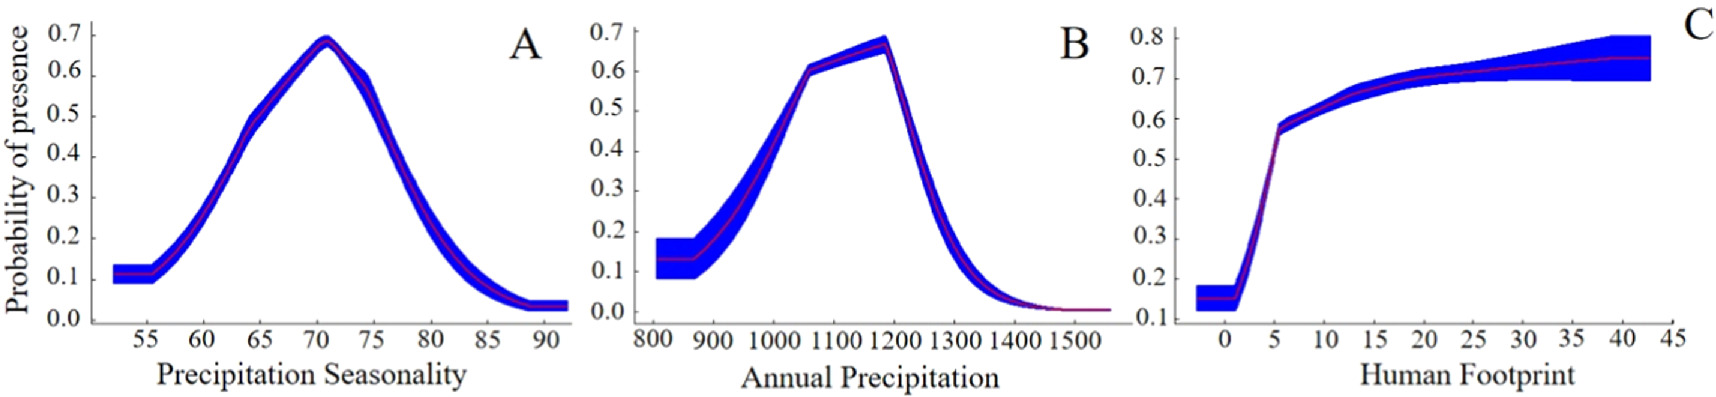
Figure 5. Response curves of important environmental factors. (A) Precipitation Seasonality; (B) Annual Precipitation; (C) Human Footprint.
Download figure:
Standard image High-resolution image3.3. Prediction of S canadensis suitable areas under current and future climatic conditions
Currently, the total suitable area is 8.13 × 10⁴ km2, accounting for 50.9% of the total study area. The highly suitable area is 1.74 × 10⁴ km2, accounting for 10.9%, and the moderately suitable area is 2.97 × 10⁴ km2, accounting for 18.6%. Highly and moderately suitable areas for S canadensis are distributed in cities and states across Guizhou province, with Guiyang, Bijie, Zunyi, Qiannan, and Anshun accounting for a larger proportion, Qiandongnan and Tongren accounting for a smaller proportion, and Liupanshui and Qianxinan having sporadic distribution (figure 6(A)).
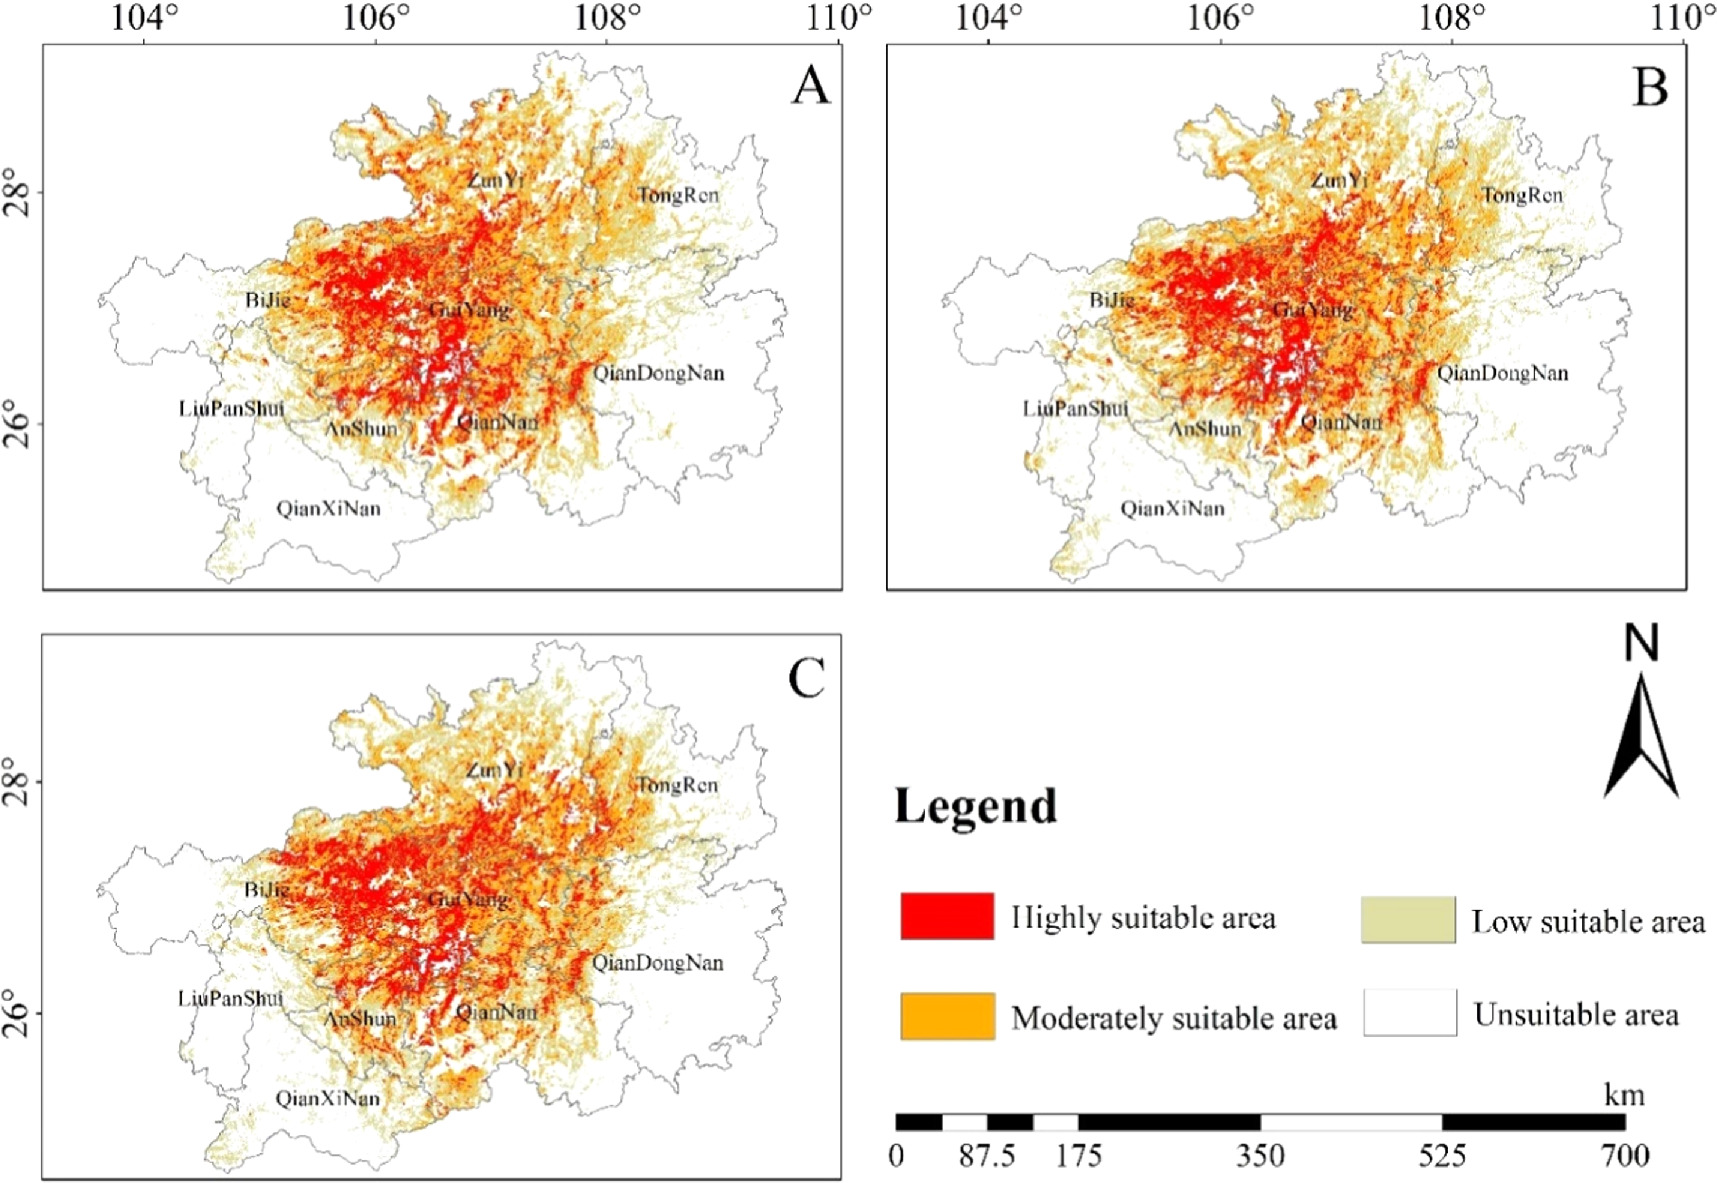
Figure 6. Suitable distribution for Solidago canadensis. in Guizhou under changing climate scenarios. (A) current (1970–2000); (B) 2050s (2041–2060 mean); (C) 2070s (2061–2080 mean).
Download figure:
Standard image High-resolution imageUnder future 2050s climate conditions (figure 6 (B)), S canadensis suitable areas decreased by 0.13 × 10⁴ km2, accounting for 0.8% of the total study area. Highly suitable area decreased by 0.05 × 10⁴ km2; moderately suitable area decreased by 0.12 × 10⁴ km2; and low suitable- and non-suitable areas increased by 0.04 × 10⁴ km2 and 0.12 × 10⁴ km2, respectively. Under 2070s climatic conditions (figure 6(C)) S canadensis suitable area increased by 0.18 × 10⁴ km2, 1% of the total study area, compared with the current period. High, moderate, and low suitable areas increased by 0.15 × 10⁴ km2, 0.01 × 10⁴ km2, and 0.02 × 10⁴ km2, respectively, and the unsuitable area decreased by 0.19 × 10⁴ km2. Under the ssp245 climate scenario, S canadensis suitable areas in Guizhou Province shrink slightly from now to the 2050s, but the change is insignificant, and suitable areas expand in the 2070s (table 3).
Table 3. Suitable area of Solidago canadensis in Guizhou under changing climate scenarios.
| Climate scenario | Year | Unsuitable area | Lowsuitable area | Moderately suitable area | Highly suitable area | Totally suitable area |
|---|---|---|---|---|---|---|
| Current | 7.85 | 3.42 | 2.97 | 1.74 | 8.13 | |
| Ssp245 | 2050s | 7.97 | 3.46 | 2.85 | 1.69 | 8.00 |
| 2070s | 7.66 | 3.44 | 2.98 | 1.89 | 8.31 |
3.4. Change in the spatial pattern of S canadensis suitable areas under future climate conditions
Under 2050s climate conditions, the extent of suitable areas in western and northern Zunyi, western and central Tongren, northern Qiandongnan, central Qiannan, central Anshun, eastern Liupanshui and northern Bijie decreased, but in Guiyang City, southern and southeastern Qiannan, southwestern Qianxinan, central Bijie, and Liupanshui, and the confluence of Zunyi, Tongren, Qiandongnan, and Qiannan expanded, and the overall size of suitable areas decreased slightly (figure 7, left). Under 2070s climate conditions, there was a large reduction in the range of suitable areas in northern and northwestern Zunyi City, followed by sparse reductions in Liupanshui, Tongren, Bijie, Qiannan and Qiandongnan; however, there was a significant range expansion of suitable areas in southern Anshun City, eastern Qianxinan, southwestern Qiannan, central Bijie, and at the intersections of Zunyi, Tongren, Qiannan and Qiandongnan, as well as sporadic expansions in Guiyang city, southwestern Qianxinan, and southeastern Qiannan (figure 7, right). In strong contrast to the 2050s, the junction of Anshun, Qianxinan and Qiannan had a significant expansion in suitable areas, followed by Liupanshui City, with an overall increase in suitable area. Over time, under the current and future climate conditions of the 2050s and 2070s, the center of suitable areas will move from north to south, mainly between Kaiyang and Xifeng Counties (figure 8).
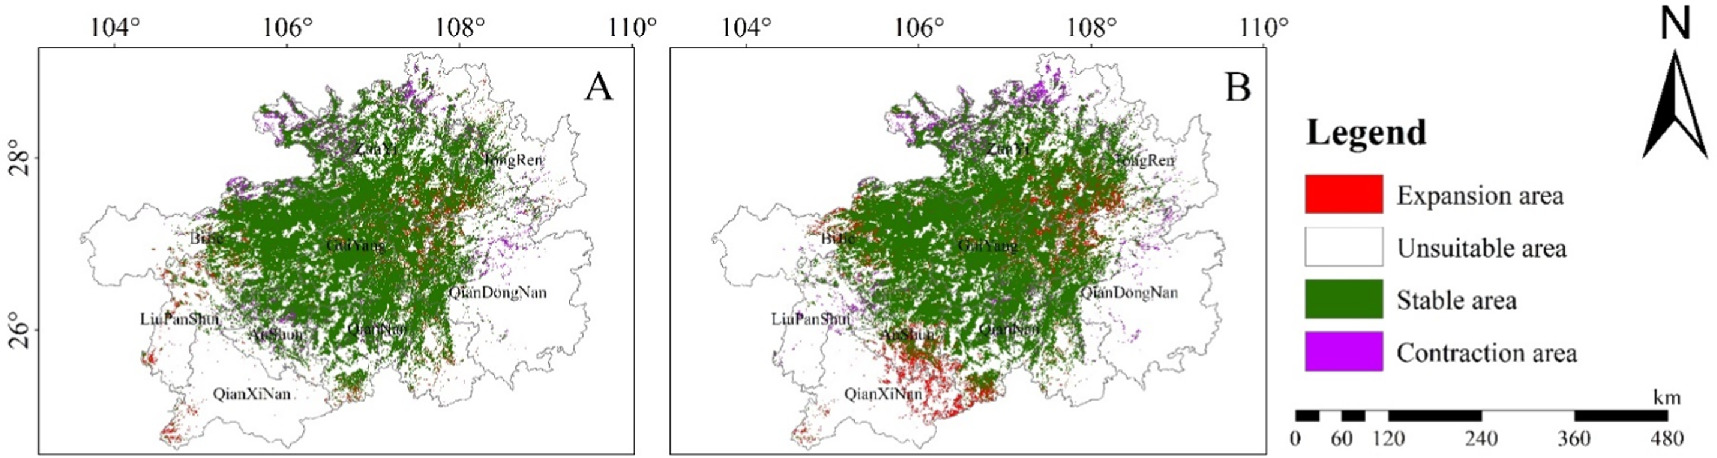
Figure 7. Spatial pattern changes of potential suitable area of Solidago canadensis under future climatic conditions in Guizhou Province. (A) 2050s (2041–2060 mean); (B) 2070s (2061–2080 mean).
Download figure:
Standard image High-resolution image
Figure 8. Centroid change of Solidago canadensis in the suitable area of Guizhou Province under future climatic conditions.
Download figure:
Standard image High-resolution image3.5. Key monitoring areas identified
With an increase in the landscape loss ratio, the S canadensis residual distribution ratio gradually decreased (figure 9). When the landscape loss ratio in the study area reached 50%, S canadensis distribution probability still remained at 90%, i.e., there was still a 90% species distribution probability in the remaining 50% of the study area. Therefore, 50% of the landscape area of the study area was selected as the monitoring area, and the relationship between species distribution probability and study area change was considered. In ArcGIS, 5% of the area with the highest invasion risk was taken as the primary monitoring area, 5%-20% as the secondary monitoring area, and 20%-50% as the third-level monitoring area.
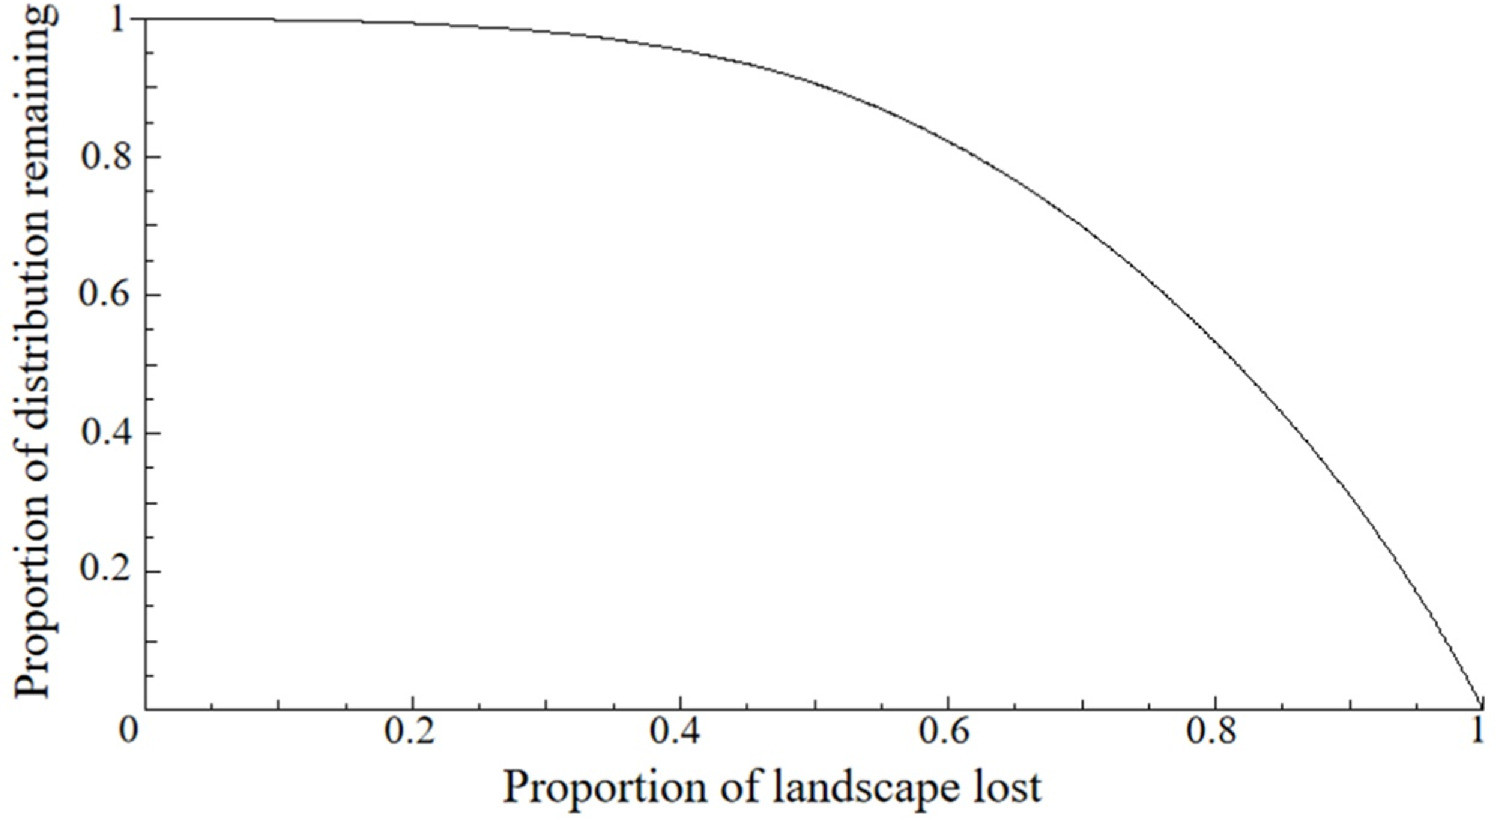
Figure 9. Performance curve of ZONATION solution.
Download figure:
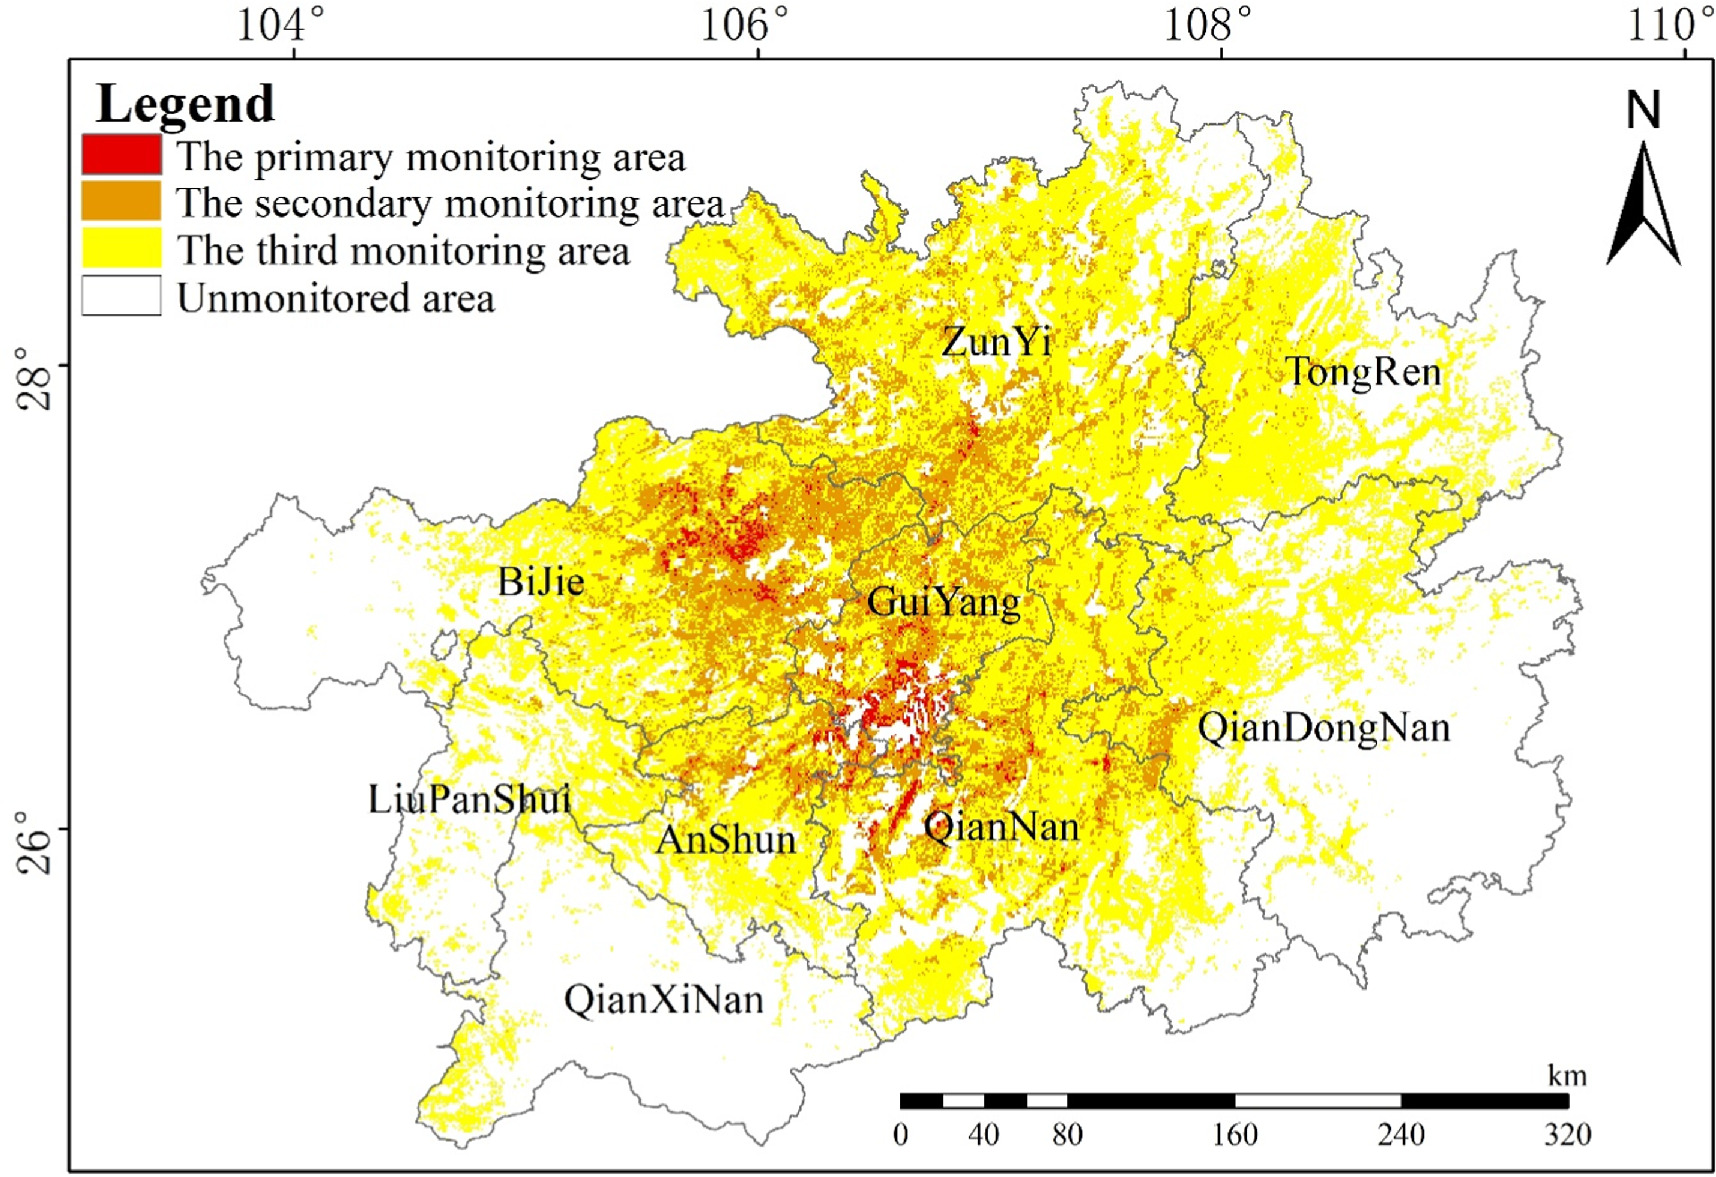
Standard image High-resolution imageThe primary monitoring area was mainly distributed in Guiyang, eastern Bijie and northeastern Anshun, showing a multi-point aggregation distribution (figure 10). Guiyang is the Guizhou Province transportation hub, and if S canadensis is not controlled, it is likely to hinder social development. The secondary monitoring area was mainly distributed on the periphery of the primary monitoring area, with Bijie City occupying the largest area, followed by Guiyang and Zunyi. The third monitoring area was mainly distributed in the east of the primary monitoring area, mainly in Zunyi, Tongren, Qiannan and Qiandongnan, and also in the west, mainly in Bijie and Anshun.
Figure 10. Key monitoring areas distribution of Solidago canadensis.
Download figure:
Standard image High-resolution image
4. Discussion
The MaxEnt model has been widely used in the prediction of economy, crops, wild protected plants, invasive plants and in other suitable areas [31, 32, 46–48]. In this study, MaxEnt combined with ArcGIS and ZONATION software was used to predict suitable areas for S canadensis in Guizhou Province and determine its invasion risk areas. The AUC value was 0.834, indicating a reliable prediction result.
The research results show that, the main drivers of S canadensis distribution were precipitation seasonal variation, annual precipitation and human footprint. The above factors have also been mentioned in other scholars' predictions of the potential distribution of S canadensis. Yu Yan predicted the distribution of S canadensis in China, and the annual precipitation was one of the main factors that significantly affected its distribution [49]. The results of Li Lihe and Jiao Xinyu showed that human activities were the main factors affecting the distribution of S canadensis [22, 45]. However, the influence curves of related factors on species distribution probability are not exactly the same, which may be caused by differences in the environmental variables selected to participate in modeling in respective studies. S canadensis often occurs near bushes and grasslands, and soil moisture changes have significant effects on its growth and reproduction [50]. The seeds are numerous, crested and light, spreading mainly carried by wind, sunny days are more conducive to seed dispersion, whereas increased air humidity inhibits it [51], but sufficient rainfall and frequent rainy days greatly improve seed germination [52]. In asexual reproduction, water is also closely related to S canadensis asexual reproduction, as suitable soil moisture is conducive to the growth of underground rhizomes and population expansion [53]. Additionally, human activities increase the possibility of species invasion, research shows that, as invasive plants initially invade habitats frequently disturbed by human activities and then invade natural habitats [54]. Seidin et al found a 54.5% contribution rate of human activities to the distribution of Solanum rostratum [55]. Invasive plants are closely related to urbanization, and the closer they are to urban centers, the more severe the invasion [56]. S canadensis seeds are light and feathered, and easily adhere to objects such as clothing and vehicles, so human activities unintentionally increase their spread. Furthermore, strong human activities may lead to a decrease in biodiversity, break the ecological balance, and create an invasive environment for invasive plants.
Some studies used climate data to simulate the potential distribution area of S canadensis in China, and the results showed that Guizhou Province belonged to the moderately or highly suitable area [23, 49, 57]. The results of this study found that under current climate conditions, suitable areas for S canadensis in Guizhou Province are mainly concentrated in Guiyang, east of Bijie, Zunyi, Anshun and Qiannan. Under future climate conditions, S canadensis suitable areas in the 2050s will be slightly lower than presently, but will expand in the 2070s. The trend of first decreasing and then expanding was the same as that predicted by Yu Sanpeng for the suitable area of the invasive plant Eupatorium adenophorum in Guizhou, however, different from Zeng Xiaoli's prediction of the potential habitat of invasive plant Mikania micrantha in Guizhou and its change trend, and Yu Sanpeng's prediction of the habitat of Chromolaena odorata is in Guizhou, the species will first expand and then decrease or continue to expand under future climate change [58, 59]. Differences in environmental factors and species biological characteristics involved in modeling may contribute to this result. This may make the whole region of Guizhou subject to more invasive species, increasing the difficulty of prevention and control. Invasive species can break away from their adapted environmental conditions and depart from the inherent environmental model during the invasion process [60]. In this study, under the ssp245 climate scenario, S canadensis suitable areas in the 2050s and 2070s first shrank by 0.13 × 10⁴ km2 and then expanded by 0.18 × 10⁴ km2, which may be attributed to the following reasons. Firstly, the species needs a period of time to adapt before it can expand. Secondly, as we showed, precipitation changes may be cyclical and unstable [61], so may variably affect invasive plant spread. In addition, this study showed that the diffusion trend of S canadensis in Guizhou Province was north to south, which was contrary to the study of Yu Sanpeng and Zeng Xiaoli on the diffusion trend of E. adenophorum and M micrantha [58, 59]. The reason for this difference may be related to the invasion routes of different species.
In our study area, the key monitoring area was 79857km2, including a primary monitoring area mainly distributed in Guiyang, east of Bijie, northeast of Anshun and northwest of Qiannan, a secondary monitoring area outside the primary monitoring areas, and a third monitoring area widely distributed in Zunyi, Tongren, Qiannan, west of Qiandongnan, and east of Bijie and Anshun. The above research results are obtained based on the ZONATION model, the model is based on not only the potential distribution of S canadensis, but also the connectivity of the landscape when identifying invasion risk areas [62], therefore, the simulation results obtained by combining MaxEnt and ZONATION are closer to the actual risk distribution. In the future, S canadensis will spread from north to south, so governments should pay attention to the implementation of different degrees of dynamic monitoring of the level 3 monitoring areas, hierarchical control and regional governance, and pay more attention to similar habitats that often occur, such as beside roads, and in abandoned fields. In flowering period, inspection should be increased, physical cutting should be carried out to reduce seed occurrence. Moreover, they will need to strengthen publicity, conduct public awareness meetings, and organize eradication activities, so that the public can personally experience the harm of invasion, take the initiative to participate in invasion prevention and control, and achieve early detection, morning reporting, and early eradication. Recently, there have been more and more studies on S canadensis bio-utilization, and so in addition to physical, chemical and biological prevention and control measures, resource utilization and other approaches should also be explored in the future.Although this study provides some reference value for the prevention and control of S canadensis in Guizhou, we must admit that there are inevitably some defects in our study, which leads to some uncertainties. Our model was only based on bioclimate, topography, soil factors and human activity intensity factors, without considering the above factors. In the future, more factors affecting species distribution should be considered. Finally, although the MaxEnt model is widely used, its accuracy is still not 100%, although recently more research has been done to improve model accuracy [63, 64]. There are many factors affecting species distribution, which are mutual and dynamic, so more factors should be added to predict species distribution in the future. In addition, the accuracy of the prediction model should be improved.
5. Conclusions
We used MaxEnt and ZONATION to predict potential suitable areas for S canadensis in Guizhou Province and to determine key monitoring areas. That provide an effective way to prevent and control foreign invasion in karst areas. Based on our results and discussion we conclude that: (1) the distribution of S canadensis in Guizhou Province is related to changes in precipitation and human activities, which may be related to the effect of moisture and humidity on seed dispersion and rhizome reproduction. Therefore, we should pay more attention to the change of precipitation, and increase the inspection and monitoring of the riparian zone, preventing or avoiding unnecessary human activities and establishing relevant regulations; (2) compared to under current climate conditions, the potential distribution of S.canadensis area drops slightly (2050s) and then expands (2070s) under future climate conditions and the spread trend move toward the south. But the high-risk areas are still concentrated in Bijie and Guiyang. Therefore, In addition to increasing the monitoring of moderately-highly risk areas, and to continue to pay attention to its southward spread in future.
Data availability statement
All data that support the findings of this study are included within the article (and any supplementary files).
Funding
This research was funded by National Natural Science Foundation of China, grant number 41561109.
Author contributions
Conceptualization, W L and Q Z; methodology, Q Z and M L; software, Q Z and M L; investigation, J W, C L, Y S and J W; writing—original draft preparation, Q Z; writing—review and editing, W L, J W, Y S and C L All authors have read and agreed to the published version of the manuscript.
Conflicts of interest
The authors declare no conflict of interest.