

Abstract
Understanding the climate impact of residential emissions starts with determining the fuel consumption of various household activities. While cooking emissions have been widely studied, non-cooking energy-consumption activities in the residential sector such as heating and lighting, have been overlooked owing to the unavailability of data at national levels. The present study uses data from the Carbonaceous Aerosol Emissions, Source Apportionment and Climate Impacts (COALESCE) project, which consists of residential surveys over 6000 households across 49 districts of India, to understand the energy consumed by non-cooking residential activities. Regression models are developed to estimate information in non-surveyed districts using demographic, housing, and meteorological data as predictors. Energy demand is further quantified and distributed nationally at a 4 × 4 km resolution. Results show that the annual energy consumption from non-cooking activities is 1106 [201] PJ, which is equal to one-fourth of the cooking energy demand. Freely available biomass is widely used to heat water on traditional stoves, even in the warmer regions of western and southern India across all seasons. Space heating (51%) and water heating (42%) dominate non-cooking energy consumption. In comparison, nighttime heating for security personnel (5%), partly-residential personal heating by guards, dominant in urban centers and kerosene lighting (2%) utilize minimal energy. Biomass fuels account for over 90% of the non-cooking consumption, while charcoal and kerosene make up the rest. Half of the energy consumption occurs during winter months (DJF), while 10% of the consumption occurs during monsoon, when kerosene lighting is the highest. Firewood is the most heavily used fuel source in western India, charcoal in the northern hilly regions, agricultural residues and dung cake in the Indo-Gangetic plains, and kerosene in eastern India. The study shows that ∼20% of residential energy consumption is on account of biomass-based heating and kerosene lighting activities.
Export citation and abstract BibTeX RIS

Original content from this work may be used under the terms of the Creative Commons Attribution 4.0 licence. Any further distribution of this work must maintain attribution to the author(s) and the title of the work, journal citation and DOI.
Introduction
Globally, one-third of the population (about 2.8 billion people) relies on biomass to meet their daily residential energy requirements (World Bank 2020). In rural areas within India, biomass fuels such as firewood, agriculture residue, dung cake, and charcoal as well as fossil fuels like kerosene (Aklin et al 2021) are dominant energy sources for residential activities, including cooking, water heating, and space heating (Census 2011). However, the devices (technologies) used to extract energy from these fuels often have very poor efficiency. This leads to leakage of useful energy into the atmosphere and incomplete combustion, which in turn results in high emissions of greenhouse gases (GHGs) and air pollutants (Bhattacharya et al 2002, Jetter and Kariher 2009). Such emissions deteriorate air quality and adversely affect ecology and human health (Chowdhury et al 2018, Balakrishnan et al 2019, Pandey et al 2021). Further, GHGs and aerosols, such as black carbon (BC), alter the radiative balance of the Earth and cause positive radiative forcing (Butt et al 2016, Lam et al 2012, Gao et al 2018).
Climate impact assessment calls for a comprehensive estimation of energy consumption from the residential sector. However, most studies on residential energy consumption in India have mainly focused on cooking (Rao and Reddy 2007, Pohekar et al 2005, Viswanathan and Kavi Kumar 2005, Pandey and Chaubal 2011, Sehjpal et al 2014). Non-cooking activities, such as water heating, space heating, and kerosene lighting, have not been addressed in detail because of unavailability of national or global level data (Lam et al 2012, Pandey et al 2014, Sadavarte et al 2019, Yawale et al 2021).
Some scholars ascribe the lack of space heating data in India to its subtropical weather conditions (Pachauri 2007, Yawale et al 2021). The present study is an upgrade to Pandey et al (2014) which is one of the first studies that evaluate biomass-focused non-cooking residential activities in India, but it has a number of limitations. First, it relies on broad assumptions of user fractions for biomass and fossil fuels. These assumptions are disparate across activities, for instance, only firewood is considered as a source of energy for space heating, water heating is assumed to have the same fuel distribution as cooking, and data on secondary kerosene lighting are derived from expert judgments of the extent of electricity outages. Second, variations in fuel-device combinations are often not captured, which, together with fuel-use fractions and temporal variability, are essential for accurate estimation of climate-relevant emissions. Third, the estimate for BC emissions from kerosene lighting overlooks efficient technologies such as petromax and hurricane lamps. Fourth, regional differences in the availability of primary energy sources (e.g., electricity) are not considered. For instance, the estimates do not account for frequent electricity outages in eastern India (CEA 2020), which possibly influences secondary usage of kerosene lighting in the region. Finally, estimates of fuel consumption by water heating are based on assumptions of uniform water requirements, temperature thresholds, and cooking fuel use across the country, even though temperature tolerance and bathing habits tend to change with region. A similar set of considerations are also taken by Sadavarte et al (2019), while estimating the fuel consumption for heating in Nepal. Some of the previous studies have looked at energy consumption through residential heating appliances, but overlooked the spatial information on biomass driven heating that dominates rural part (Isaac and Van Vuuren (2009), van Ruijven et al 2011).
Additionally, a challenge with previous studies that measure fuel consumption from non-cooking residential activities is the bottom-up approach that uses Census 2011 data (Lam et al 2012, Pandey et al 2014). These data do not account for various schemes introduced in the last decade to promote cleaner energy sources, such as Saubhagya Yojana and Ujjwala Yojana (Aggarwal et al 2018, Jairaj and Kumar, 2019, Saubhagya, 2020). Further, the study by Lam et al (2012) possibly underestimates the actual climate impact of kerosene lighting because it uses national survey data, which reports primary users of kerosene but not households that use kerosene during power outages (i.e., secondary users) (Census 2011). Thus, owing to the complexity involved in understanding fuel consumption by non-cooking residential activities, residential sector emissions continue to be characterized by large uncertainties.
In the present study, we attempt to overcome some of these limitations by analyzing data from COALESCE residential surveys (covering ∼6000 households, 49 districts). Specifically, we evaluate non-cooking fuel consumption by determining spatial heterogeneity in fuel and device choices, the duration of the energy-consumption activities, and the number of users of different fuels and devices. Further, a predictive regression model is developed from the survey information, with demographics, housing, and meteorological data acting as predictors. The model is applied to all districts to calculate India-wide fuel consumption. A new sectoral methodology is used to estimate both energy consumption and fuel diversity for the three major non-cooking residential activities, and seasonal and regional patterns of high energy requirements are identified to aid emission estimations.
Coalesce residential surveys
As part of the COALESCE project (Venkataraman et al 2020), a residential questionnaire survey was conducted in the rural areas of 49 districts (∼6000 surveys) spread across India (see figure S1). The questions were asked only after obtaining the necessary consent from the participants. The questionnaire consisted of ∼50 items that sought information about residential fuel use, device choices, kitchen specifications, seasonal data, power outages, warm bathing water requirements, room heating needs, activity duration, etc. For qualitative responses (e.g., fuel and device names), the modal frequency of each class was determined for the respective district and converted into a fraction of the total responses. Quantitative information (e.g., activity duration) was averaged over the district. District-level outliers were manually verified against collected data to avoid any data-capture errors. Dummy entries added for server testing were identified from the remarks and removed.
The survey locations are selected heterogeneously to cover every part of India, where 5% randomly chosen households of 4–6 villages (with 500–700 households' population) in each selected district but in different talukas are surveyed (figure S6). These districts together are representative of fuel use characteristics of the state, as per Census 2011. A similar approach is used to choose villages within the district. A previous survey-based study by Gupta (2014) in the Punjab state used similar representative samples to understand state-wide variation. A minimum of 10 km distance between the villages is ensured to capture intra-district variation in the fuel and device choices (if any). Field data collection was severely affected by COVID-19 restrictions, access to participants and logistic constraints. Despite that required data was collected from a total of ∼6,000 households in 49 districts across the country by conducting in-person questionnaire surveys between 2018 and 2020. These districts cover 21 out of 24 initially planned states.
In this study, we analyzed only dominant fuels and devices from the COALESCE surveys: firewood, agriculture residue, dung cake, charcoal, and kerosene under fuels and traditional stove, improved stove, firespace (i.e., small pit or space to burn biomass), and wick lamp under devices. We also included a category titled 'Others' to account for devices with small user fractions: traditional stove, bukhari, Hamaam, and kangri used for space heating as well as hurricane and petromax lamps used for kerosene lighting. Owing to negligible use of liquified petroleum gas (LPG), electricity, and biogas for non-cooking residential activities in rural areas, they were not considered in the study. All fuels and devices under each activity were normalized (traditional stove user fraction + improved stove user fraction = 1) (See table S4).
Methodology
Stepwise multivariate linear regression
To predict information for the non-surveyed districts, multivariate stepwise linear regression analysis was performed using demographic, housing, and meteorological data (from 49 districts) as predictors. Secondary information sources for housing and demography were Census 2011 and India National Family Health Survey (NFHS 2016), considering these are the latest and nation-wide available surveys. Precipitation and minimum temperature data were obtained from Climate Research Unit TS4.03 dataset (Harris et al 2020). A similar exercise, using multi-year census data, has also been previously done on global scales (Lam et al 2012).
A stepwise multivariate regression model was generated for each target variable by adding and removing predictors based on the significance of their contribution toward the overall  Akaike information criterion (AIC) was used to prevent overfitting and ensure a balance between model complexity and predictability. Additionally, each variable included in the final model was checked for statistical and logical connection with the target. The generalizability of these regressions was assessed by the leave-one-out cross-validation (LOOCV) method, where a model is rebuilt as many times as the number of data points with the same predictors but with one data point removed. The predicted estimates for the removed data point are compared with actual values. While building the regression models, the number of predictors is restricted to avoid overfitting. In general, we have kept one predictor per ten observational data points to ensure lesser complexity with higher predictability. In this study, some variables in kerosene lighting were taken as constants due to unpredictability, whereas some were normalized based on the prediction of the dominant variable. All fuels were normalized after prediction to have a total user fraction of one.
The model was also tested using the following: residual diagnostics, such as the visual trend in residual distributions, White test and Engle ARCH test for heteroscedasticity (Engle, 1982), Durbin-Watson test for auto-correlation (Durbin and Watson, 1950), p-value of each predictor from t-statistic test, and root-mean-square-error.
Bottom-up approach
When consumer information is available, a bottom-up approach is considered useful for arriving at estimates. Many earlier studies have used this approach to estimate fuel consumption (Gao et al 2019, Gately et al 2013, Habib et al 2004, Zhao et al 2011, Lam et al 2012, Pallavidino et al 2014, Pandey et al 2014, Sadavarte et al 2019). Pandey et al (2014) and Habib et al (2004) used specific energy (energy per capita) to evaluate fuel usage, while Lam et al (2012) and Sadavarte et al (2019) used specific fuel consumption (fuel consumed per household). In the present study, we use the COALESCE survey data to estimate specific fuel consumption at the district level, using the equation below (figure S3).

This bottom-up approach equation (equation (1)) estimates fuel consumption  over ith district and jth population type (urban or rural), where
  is the maximum number of available consumers (total households [HHs] for water heating, space heating, and kerosene lighting, total number of security personnel for nighttime heating),
  is the fraction of users performing a non-cooking residential activity using mth fuel with kth device in lth month,
  is the number of days (fixed at 30 for simplicity) per month,
  denotes the duration of the activity per day that varies with district (nighttime heating for security personnel assumed to be 7 ± 1 h per day), and
  indicates activities performed per day (number of members per HH for water heating, rooms per HH for space heating, and kerosene lamps per HH for kerosene lighting). Predicted variables are indicated by a cap. Because COALESCE survey does not cover urban populations, the urban user fraction for heating activities was estimated by multiplying rural user fractions with the ratio (between 0 to 1) of urban to rural biomass users for cooking, derived from the latest NFHS 2016. Similarly, for kerosene lighting, a ratio of non-electricity users was considered. Population estimates for 2017–18 were obtained from data shared by the Ministry of Health and Family Welfare, India (MHFW 2019), and the 4 km spatial grid pattern was taken from Ravishankara et al (2020).
Many assumptions made by earlier studies, owing to non-availability of non-cooking residential data, are refined or eliminated in the present study. For instance, data on secondary kerosene users, which has been considered in this study, were missing from the estimation by Lam et al (2012) or were assumed to be constant across India by Pandey et al (2014). Earlier studies used an end-use-energy approach for water heating, whereby 4.87 MJ HH−1 day−1 was assumed as the total required energy (Pandey et al 2014, Sadavarte et al 2019). Further, the monthly user fraction for heating was considered a constant if the temperature fell below 20 °C, else it was zero (Pandey et al 2014). However, the regression model developed in this study associates user fractions for heating with temperatures specific to the district. Pandey et al (2014) assumed the non-cooking fuel user fractions to be the same as cooking fuel user fractions given in Census 2011, but our fuel-user fractions are based on survey data and verified against demographic and housing data sources. However, it must be mentioned that this study manages nighttime heating separately due to its partly-residential and urban dominant features. In addition, the study uses a temperature threshold for nighttime heating due to the unavailability of monthly information in the COALESCE surveys.
An uncertainty estimate is included for each variable, mainly from the regression model at 5–95th confidence interval (90% confidence level), while standard deviation is obtained from a t-statistic table. This uncertainty or error propagates into the final estimate as multiple variables interact with each other, as shown in equation (1) above. Refsgaard et al (2007) support uncertainty estimation in environment models, and a similar approach is used in the present study: the square root of the sum of squared error is taken for the first-order operations (add or subtract), and a similar method is used but with the ratio of error to mean (relative uncertainty) for the second-order operations (multiply or divide).
Results and discussion
Surveys and regression
Data from around 6000 household surveys conducted across 49 districts along with the newly developed sectoral methodology and regression models have allowed this study to go beyond previously held assumptions and provide first-time estimates of the total fuel and energy consumed across India for non-cooking residential sector activities. The survey results present new and vital information about fuels and devices used in the non-cooking residential sector.
The traditional stove dominates the devices used for water heating in India, with almost negligible (∼3%) use of the improved stove. Similarly, simple wick lamps are used by 78 [±29] % of the households, while the rest rely on lamps such as hurricane and petromax. Such high heterogeneity in kerosene lighting devices has not been reported previously (Lam et al 2012). Further, an earlier study (Pandey et al 2014) assumed a constant duration of power outages in the evening (4 h) across India for 365 days, however, the current study corrects that assumption by reporting an average power outage of 1.7 h a day for one-third of a year (table 1). Such information was not available earlier, therefore, Pandey et al (2014) only considered wick lamps to estimate kerosene consumption for lighting, which in turn could have misled the climate impact assessment of residential emissions. With regard to space heating, this is one the few studies that examine fuel consumption from regional devices such as kangari (firepot), Hamaam and bukhari (space heater), which are widely used in the Jammu and Kashmir region for warmth.
Table 1. Summary of the COALESCE residential surveys.
| Name | Description | Mean | STD | Min | Max |
|---|---|---|---|---|---|
| WH_TS | Fraction of traditional stove users for WH | 0.97 | 0.09 | 0.61 | 1.00 |
| WH_IS | Fraction of improved stove users for WH | 0.03 | 0.09 | 0.00 | 0.39 |
| WH_FW | Fraction of firewood users for WH | 0.71 | 0.33 | 0.00 | 1.00 |
| WH_CR | Fraction of agriculture crop residue users for WH | 0.07 | 0.16 | 0.00 | 0.68 |
| WH_DC | Fraction of dung cake users for WH | 0.22 | 0.29 | 0.00 | 0.98 |
| WH_Mem | Members per HH using warm water to bathe | 4.90 | 1.32 | 2.40 | 6.95 |
| WH_Time | Time required to heat water per person (minutes) | 22.52 | 8.79 | 10.36 | 53.98 |
| Mon_WH | Monthly WH users | 0.25 | 0.29 | 0.00 | 0.93 |
| SH_FS | Fraction of firespace users for SH | 0.36 | 0.38 | 0.00 | 1.00 |
| SH_Other | Fraction of other device users for SH | 0.64 | 0.38 | 0.00 | 1.00 |
| SH_FW | Fraction of firewood users for SH | 0.52 | 0.40 | 0.00 | 1.00 |
| SH_CR | Fraction of agriculture crop residue users for SH | 0.14 | 0.23 | 0.00 | 0.63 |
| SH_DC | Fraction of dung cake users for SH | 0.22 | 0.28 | 0.00 | 1.00 |
| SH_Char | Fraction of charcoal users for SH | 0.12 | 0.28 | 0.00 | 0.93 |
| SH_Room | Rooms heated per HH | 1.39 | 0.78 | 0.09 | 3.03 |
| SH_Time | Duration of SH per room (hours) | 4.14 | 4.00 | 1.15 | 13.59 |
| Mon_SH | Monthly SH users | 0.10 | 0.23 | 0.00 | 0.96 |
| KL_Pri | Fraction of primary users of KL | 0.04 | 0.13 | 0.00 | 0.63 |
| KL_Sec | Fraction of secondary users of KL | 0.25 | 0.27 | 0.00 | 0.96 |
| KL_WL | Fraction of wick lamp users within KL | 0.78 | 0.29 | 0.25 | 1.00 |
| KL_Other | Fraction of other lamp users within KL | 0.22 | 0.29 | 0.00 | 0.75 |
| KL_Time | KL used hours per day [power outage in the evening] | 1.69 | 1.10 | 0.18 | 4.00 |
| KL_Lamp | Number of lamps per HH | 1.72 | 0.47 | 0.93 | 2.60 |
| Mon_KL | Monthly KL users | 0.34 | 0.37 | 0.00 | 1.00 |
Our results offer new information about user fractions for different fuels utilized for space and water heating. Firewood, agriculture residue, and dung cake are the major biomass fuels used by 71%, 7%, and 22% of the households, respectively, for water heating. The use of charcoal for space heating is significant (12%), especially in Jammu and Kashmir. Interestingly, although earlier studies have reported the regional usage of charcoal, they have not been able to quantify the fractional use of biomass fuels (Akhtar, 1992, Bhat and Rubab 2008, 2009). With negligible use of commercial fuels like LPG for heating, the share of biomass fuel users is large, significantly higher than that for cooking. Surveys showed that 4% of households use kerosene as the primary fuel for lighting, which is significantly lower than the 31% reported in Census 2011. Our finding is supported by data from the Ministry of Statistics and Programme Implementation (2021), which has shown a sharp (4 times) decline in kerosene consumption since 2011, possibly due to massive electrification projects undertaken in India (Jairaj and Kumar, 2019, Saubhagya, 2020).
Other variables estimated from the survey, to calculate energy use for heating, include heating time, number of rooms heated per household, and members per household using heated water. The time required for heating water per person is 22 [±9] minutes, while the duration of space heating varies from 1 to 14 h a day depending on the location of the households. While earlier studies have explained the seasonality of heating activities by the temperature threshold method (T < 20 °C) (Pandey et al 2014, Sadavarte et al 2019), we found that water heating in the western and southern parts of India is a round-the-year activity. In contrast, space heating is more sensitive to temperature (Pawar and Sinha 2022). Further, to the best of our knowledge, none of the previous studies have reported seasonality in kerosene consumption for lighting, however, we observed a reasonable increase in kerosene users during summer, possibly due to the rainy season that often causes power disruptions.
Regression models were used to understand and estimate the surveyed variables over non-surveyed districts, where secondary data from Census 2011, NFHS 2016, and meteorological data were used as predictors (see table S3). The final predictive models shown in table 2 feature a logically explainable association between the target and predictors, with reasonable prediction strength (Radj 2 > 0.3). Fuel and device-related variables rely on socioeconomic, housing, and demographic data, while heating frequency and time variables are mainly temperature driven. It is important to mention that some variables—user fraction for wick lamps, primary kerosene users, number of kerosene lamps, monthly user fraction for water heating, and monthly fraction of kerosene users—are not predicted because of spatial variation or unavailability of predictor data, thus, they are considered constant (table 2).
Table 2. Prediction models details. (N is the number of observations and meaning of each predictor variable is provided in the table S3).
| Target | Description |

| RMSE | N |

|
|---|---|---|---|---|---|
| WH_TS | 1.02 + 0.0005 (DC_R_11)—0.0120 (4W_R_11)—0.0005 (DC_R_11:4W_R_11) | 0.77 | 0.04 | 44 | 0.53 |
| WH_FW | 0.0928 + 0.0098 (FW_R_11) | 0.45 | 0.25 | 44 | 0.43 |
| WH_CR | 0.7762–0.0078 (Elec_R_16) | 0.63 | 0.09 | 44 | 0.58 |
| WH_DC | −0.1644 + 0.2211 (North) + 0.0024 (NoLat_R_11) + 0.0158 (DC_R_11) | 0.70 | 0.15 | 44 | 0.66 |
| WH_Mem | 7.9908 + 0.8611 (West) −0.0574 (HH1–3_R_11)—0.1001 (Tmin_CRU) | 0.46 | 0.97 | 44 | 0.41 |
| WH_Time | 42.7845–7.3 (Tmin_CRU) | 0.33 | 7.17 | 44 | 0.20 |
| SH_FS | −0.2461 + 0.0158 (AgriLab_R_11) | 0.35 | 0.31 | 20 | 0.28 |
| SH_FW | 0.8069 + 0.0101 (FW_R_11) | 0.56 | 0.26 | 21 | 0.42 |
| SH_CR | 1.0288–0.0102 (Elec_16) | 0.66 | 0.14 | 21 | 0.62 |
| SH_DC | 0.6044–0.0068 (FW_R_11) | 0.40 | 0.22 | 21 | 0.32 |
| SH_Char | 0.8254–0.0406 (Tmin_CRU) | 0.79 | 0.13 | 21 | 0.72 |
| SH_Room | 2.7744–0.0801(Tmin_CRU) | 0.40 | 0.60 | 20 | 0.26 |
| SH_Time | 13.2904–0.5280 (Tmin_CRU) | 0.65 | 2.37 | 21 | 0.57 |
| SH_Mon | 0.4155–0.0181 (Tmin_CRU) | 0.47 | 0.17 | 252 | 0.43 |
| KL_Sec | 0.1510 + 0.5398 (East) −0.0288 (Coal_R_11) | 0.52 | 0.19 | 26 | 0.21 |
| KL_Time | 6.2397–0.1044 (Tmin_CRU)—0.0228 (Elec_R_16) | 0.36 | 0.88 | 49 | 0.27 |
| WH_Mon | Averaged over 4 regions and 12 months. | ||||
| KL_Mon | Averaged over 4 regions and 12 months. | ||||
| KL_Prim | Averaged over 4 regions. | ||||
| KL_Lamp | Averaged over India [σ ≤ μ] | ||||
| KL_WL | Averaged over India [σ ≤ μ] | ||||
| WH_IS, SH_OT, and KL_OT are calculated by normalizing them with the paired device. | |||||
Note: DC_R_11: % rural HHs uses dung cake for cooking, Census 2011, 4W_R_11: % rural HHs have 4 wheeler, Census 2011, FW_R_11: % rural HHs uses firewood for cooking, Census 2011, Elec_R_16: % rural HHs uses electricity for lighting, NFHS 2016, North: Categorical variable represent North, NoLat_R_11: % rural HHs do not have latrine, Census 2011, West: Categorical variable represent West, HH1–3_R_11: % rural HHs with 1 to 3 members, Census 2011, Tmin_CRU: Minimum temperature (averaged 2011–2018) (°C), AgriLab_R_11: % agriculture labour in rural India, Census 2011, East: Categorical variable represent East.
Regression models for fuel and device users show that usage is mainly driven by users' choice of cooking fuel. Higher user fractions for cooking with dung cake (DC_R_11) are associated with more users of traditional stoves and dung cake for water heating. Similarly, more firewood users for cooking (FW_R_11) at the district level indicate higher consumption of firewood for heating. Further, we also note that more members per household use warm water for bathing in low-temperature regions (Tmin_CRU). Regions with a higher fraction of agricultural labor (AgriLab_R_11) have more users of firespace for space heating, which possibly suggests that firespace (FS) use is associated with a low socioeconomic status. Interestingly, electricity use (Elec_16) is inversely linked to users of agriculture residue for heating activities. Secondary users of kerosene lighting are higher in eastern India (East), which is consistent with data from Census 2011. However, primary users have become secondary users in the same region with the introduction of the National Electrification Scheme (Kundu and Bhattacharya, 2018). High use of coal/charcoal for cooking (Coal_R_11) is a proxy for less kerosene usage, it indicates the possibility of coal availability in the district and/or proximity to thermal power plants (NTPC, 2019). Regions with low temperatures such as north and north-eastern India experience higher power outages, which is consistent with power supply reports (CEA, 2020).
Fuel consumption
Heterogeneity in fuel consumption helps understand the dominant fuel and device combinations. The quantity of firewood used for water heating, space heating, and nighttime heating (NH) for security personnel is 22773, 22343, and 3129 Gg y−1, respectively (table 3). Heating activities consume 8619 and 9123 Gg y−1 of agriculture residue and dung cake, respectively. This study finds that the consumption of charcoal for space heating (4232 Gg y−1) is significantly more than that of other biomass fuels, which has not been reported previously as fuel fractions in space heating have not been examined (Pandey et al 2014, Sadavarte et al 2019). About 85% of the charcoal is consumed in hilly northern states, especially in Jammu and Kashmir, mainly during winter, and it affects the region's BC emissions (Bhat et al 2017). These fuel consumption estimates are 50% less than previous values (Pandey et al 2014) mainly because the temperature thresholds considered earlier resulted in overestimation of seasonal usage. We find that residential lighting uses 439 Gg y−1 of kerosene, with wick lamps accounting for 50% of the consumption. This highlights the need to consider other types of kerosene lamps when assessing fuel consumption for climate impact. We also notice a four-fold decline in total kerosene consumption for lighting since 2011 (MSPI 2021, Pandey et al 2014), owing to massive electrification of regions undertaken as part of the Saubhagya Yojana (Saubhagya 2020). However, kerosene continues to be used as a secondary fuel, mainly during disruptions in electric supply in some regions, despite a sharp decline in primary users. An earlier study showed that replacing kerosene-based subsidies with solar subsidies for users, manufacturers, and stakeholders can be a more sustainable option (Laan et al 2019).
Table 3. Technology and activity-specific fuel consumption.
| Activity | Device | Fuel | Value (Gg year−1) | Standard deviation (Gg year−1) |
|---|---|---|---|---|
| WH | TS | Firewood | 22551 | 3298 |
| WH | TS | Agriculture residue | 3027 | 473 |
| WH | TS | Dung cake | 4477 | 678 |
| WH | IS | Firewood | 222 | 44 |
| WH | IS | Agriculture residue | 33 | 9 |
| WH | IS | Dung cake | 160 | 27 |
| SH | FS | Firewood | 5844 | 753 |
| SH | FS | Agriculture residue | 2054 | 233 |
| SH | FS | Dung cake | 1164 | 168 |
| SH | FS | Charcoal | 296 | 71 |
| SH | Other | Firewood | 16499 | 1835 |
| SH | Other | Agriculture residue | 3505 | 441 |
| SH | Other | Dung cake | 3322 | 410 |
| SH | Other | Charcoal | 3936 | 314 |
| NH | — | Firewood | 3129 | 1176 |
| KL | Wick | Kerosene | 217 | 76 |
| KL | Other | Kerosene | 222 | 115 |
Figure 1 shows regional heterogeneity in fuel consumption. Firewood consumption is higher in the western and southern regions, which can be attributed to the relatively higher use of biomass-based fuels for water heating. Taken together, the northern and eastern regions of India use ∼80% of agricultural residue and dung cake for heating purposes: the use of dung cake (60%) is dominant in the east whereas the northern region is dominated by agricultural residue (35%). Space heating in the northern hilly regions of India accounts for nearly 90% of the charcoal consumed. Similarly, eastern India consumes 70% of the total kerosene for lighting because of higher secondary user fractions (figure 1). Pandey et al (2014) reported a higher prevalence of primary kerosene users in the eastern part of India, however, recent policy interventions under Saubhagya Yojana have enabled many users to transition from primary to secondary users (Saubhagya 2020). Additional efforts toward ensuring uninterrupted electricity supply to the eastern region will likely help eliminate kerosene lighting and its associated climate impact.

Figure 1. Fuel consumption in the non-cooking residential sector (in Gg year−1). (A) Firewood, (B) agriculture residue, (C) dung cake, (D) charcoal, (E) kerosene, and (F) stacked bar chart showing region-wise percentage fuel consumption.
Download figure:
Standard image High-resolution imageSectoral energy distribution
The fuel consumed by different residential non-cooking activities is compared by converting it to energy using the calorific value given in table S1. The use of biomass for water heating is higher in the western and southern regions, while hilly northern regions, such as Ladakh, show lesser dependency on biomass, possibly because of more than 100 installed solar water heating facilities that cover a total area of 15000 m2 (LREDA 2011, Lohan and Sharma 2012, Lohan et al 2012). However, hilly northern regions of India use biomass (especially charcoal in kangari) for the extended hours (>10 h) for space heating. A few states—Arunachal Pradesh, Himachal Pradesh, Jammu and Kashmir, Sikkim, and Uttarakhand—use more than 25 GJ y−1 HH−1 of energy, of which >90% is utilized for space heating (figure S4) and >30% comes from charcoal (figure S5). In contrast, a negligible amount of energy is consumed by the southern states for space heating (figure 2) owing to the warm tropical conditions in the region. Nighttime heating is a dominant activity in the metro cities because of the high demand for security personnel in places such as Delhi and Chandigarh. However, nighttime heating for security personnel is also equally dominant in rural parts of India, which is supported by the observations of bonfire activity during night in rural locations of Gujarat (Gautam et al 2018). Almost 5% of the biomass energy is used by security persons for heating. Eastern parts of India and western Maharashtra show significant energy consumption by kerosene lighting, mainly because of a high number of secondary users and relatively frequent power outages.

Figure 2. Biomass and kerosene energy consumption (in TJ year−1) from the non-cooking residential sector. (A) Water heating, (B) space heating, (C) nighttime heating for security personnel, (D) kerosene lighting, and (E) stacked bar chart showing state-wise percentage sectoral energy consumption.
Download figure:
Standard image High-resolution imageOverall ∼1.1 [±0.2] exajoules (1 EJ = 1018 J) of energy is consumed by the non-cooking residential sector in India, with Uttar Pradesh, Maharashtra, and Madhya Pradesh accounting for ∼40% of the share (figure 3) owing to their large populations. Half of the total energy consumption occurs in the winter season, however, northern hilly regions consume significantly higher levels of energy throughout the year because of cold weather conditions. This finding is also supported by the low seasonal variation in charcoal consumption. Northern and eastern parts of India have clear seasonal variation: consumption is the least during summer and higher in winter. Southern India does not have any seasonal extremes in consumption of energy (figure 3). Similarly, kerosene consumption for lighting shows low seasonal fluctuation, but 40% is consumed during summer.
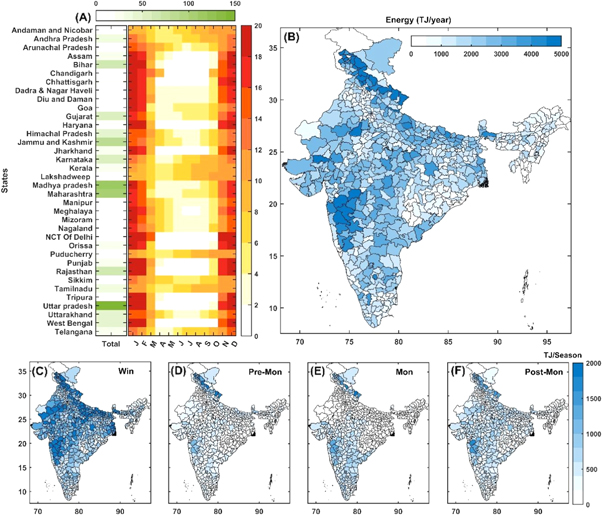
Figure 3. State-wise total energy consumption by non-cooking residential activities. (A): Green) Total energy consumed (PJ year−1), (A): Red) Percentage of total state energy consumption. (B) Spatial variation in non-cooking residential energy (TJ yer−1). (C), (D), (E), and (F) are measures of energy consumed in winter, pre-monsoon, monsoon, and post-monsoon respectively (TJ/season).
Download figure:
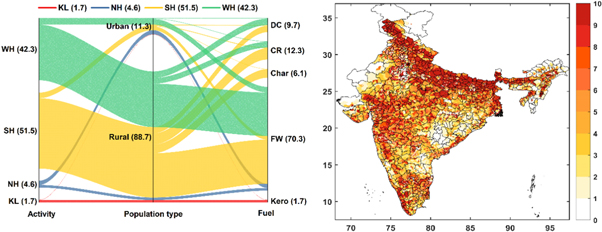
Standard image High-resolution imageDetermining the spatio-temporal distribution of fuel consumption is vital to developing efficient region-specific mitigation plans. The spatial pattern of cooking and non-cooking residential activities is almost identical, except in hilly northern India where non-cooking residential energy consumption is high and in West Bengal where cooking is the dominant energy-consuming activity (Kumari et al unpublished). The Indo-Gangetic plain shows higher energy consumption per unit area owing to high population density (figure 4). Around 20% of the biomass and kerosene-based energy consumption is associated with non-cooking activities, which highlights the importance of such highly overlooked activities (Kumari et al unpublished). Figure 4 shows that rural and urban parts of India account for 89% and 11% of the total non-cooking energy consumption, respectively, and 94% of it is used for residential heating activities. About 2% of the total non-cooking energy is fueled by kerosene, however, the BC emission factor is 100 times higher with kerosene lighting than with biomass burning. Thus, kerosene lighting can contribute heavily to BC emissions and have severe adverse consequences for the climate (Lam et al 2012). Firewood, agriculture residue, dung cake, and charcoal make up 70%, 12%, 10%, and 6% of the non-cooking energy, respectively (figure 4).
Figure 4. Alluvial plot of percentage energy share from non-cooking residential events, population type, and fuel (left). Non-cooking residential energy at 4km × 4km grid in TJ pixel−1 year−1 (Right).
Download figure:
Standard image High-resolution image
Future policies
Future policies addressing clean energy in the residential sector, would need to account for energy consumption for heating and lighting activities. India has launched various schemes in the last decade targeting the residential activities, such as Saubhagya Yojana (Electrification), Ujjwala Yojana (LPG promotion for cooking) and Ujala LED program for lighting. However, our estimates show a significant contribution from the heating sector, which addresses previously present underestimation in the residential sector. Thus, amendment of policies to mitigate emissions from the biomass dominated heating sector is necessary. In addition, implementation of policies can be optimized through the region-specific fuel-device energy consumption details provided in the present study. Hiremath et al (2010) showed that individual districts could be self-reliant with decentralized planning, and areas with large wastelands can produce biomass feedstock for power generation that can meet electric heating needs. States such as Rajasthan, Gujarat and Karnataka, with high solar potential, can create a conducive environment for the adoption of solar powered devices, involving incentives for solar device manufacturing and use, boosting India's pace toward achieving sustainable development goals (Veeraboina and Ratnam, 2012). For example, solar powered centralized heating systems in the Ladakh region significantly lower the dependency on biomass (LREDA 2011, Lohan and Sharma 2012, Lohan et al 2012). Hybrid solar and wind energy systems (Adomavičius and Watkowski 2008) are viable in hilly northern parts of India and western India, where wind power density is high (Charles Rajesh Kumar et al 2019). Regions of high wind energy density in India (Charles et al 2019) could also benefit from wind power alone, similar to other world regions, where wind energy has been successfully harnessed (∼5 MW wind farm) to supply almost all of heating energy demand of small communities (Hughes 2010). Thus, successful implementation of programs is needed focusing on heating and lighting sectors.
Conclusions
This study estimates fuel and energy consumption within the highly overlooked non-cooking residential sector in India for the year 2017 with the help of a bottom-up approach, based on survey data, as well as regression models. It overcomes various assumptions made earlier to examine such discounted activities in the residential sector. We observe that non-cooking activities consume as much as one-fourth the energy used for cooking in India. Biomass fuel consumption for heating constitutes 95% of the total non-cooking energy use, and among biomass fuels, firewood is the most used (70%) and is associated with significant aerosol emissions. While kerosene covers only 2% of the energy consumption, the high levels of BC emissions from kerosene burning are a key source of concern from a climate perspective.
In terms of regional distribution of various activities, the study highlights the dominance of water heating in western and southern India, where the yearly energy consumption averages 2 PJ for each district. Very high prevalence of space heating, for ∼10 h a day, is seen in hilly northern parts of India, and the majority of this activity is fueled by charcoal burning in special devices such as the kangari. Kerosene consumption is concentrated in eastern India due to a relatively high proportion of secondary users of kerosene lighting. Nighttime heating for security personnel is a significant energy-consuming activity in the states with financially active metro cities such as New Delhi and Mumbai. A few hilly states consume 5–6 times more energy per household, and 90% of it is utilized for space heating. States at higher latitudes use more biomass for space heating than water heating as space heating is a long-duration activity, and other sources of energy (electricity and solar heater) are available for water heating. Installing renewable energy-driven heaters could significantly reduce the biomass dependency of these regions.
A key contribution of this study is that it overcomes the assumptions of the temperature threshold approach, which may overestimate fuel consumption, and provides a better understanding of the seasonal variation in non-cooking residential activities by using the state-of-the-science regression approach. Results show that 50% of the non-cooking energy is consumed in the winter season, whereas the remaining half is distributed evenly across other seasons. Unlike in other regions where heating is a temperature-sensitive activity, in southern and western India, biomass-based water heating is carried out in all seasons despite the warm weather. Kerosene consumption for lighting in all regions shows a slight peak during monsoon, which has not been reported earlier.
The present study uses limited data gathered through extensive questionnaire surveys as COVID-19 lockdown disrupted the plan; however, future studies can improve data collection by increasing the number of surveys, conducting them during an active heating season (winter), including urban regions, and examining other overlooked residential activities that emit pollutants such as garbage burning. Future studies can be improved by including other electric non-cooking appliances and updated user fractions from the upcoming Census. In addition, prediction models can be improved by increasing the number of data points and relevant predictors, as a few response variables in the present study are predicted with lower confidence or a satisfactory prediction model could not be developed. A better understanding on nighttime heating of security personnel can be developed by collecting survey data. Overall, the current findings provide extensive and novel information about fuel and energy consumption from the non-cooking residential sector in India, which will aid efficient climate assessment in future. We believe that comprehensive data collection within these discounted sectors can strengthen energy estimates and facilitate the development of sustainable solutions to reduce climate impact.
Acknowledgments
This work was supported by the Indian Ministry of Environment, Forest and Climate Change under the NCAP-COALESCE project {Grant No.14/10/2014-CC(Vol.II)}. The authors thank the internal review committee of the NCAP-COALESCE project for their comments and suggestions on this paper. We would also like to thank all the study participants and the village heads for their whole-hearted support in conducting our study. The views expressed in this document are solely those of authors and do not necessarily reflect those of the Ministry. The Ministry does not endorse any products or commercial services mentioned in this publication.
Data availability statement
The data cannot be made publicly available upon publication because they contain sensitive personal information. The data that support the findings of this study are available upon reasonable request from the authors.
Conflict of interest
The authors declare that they have no conflict of interest.
Supplementary data (1.3 MB PDF)