

Abstract
Atmospheric nitrogen deposition has large eco-environmental effects such as ocean acidification, eutrophication in coastal areas. However, knowledge of the source and the pathway of N deposition in coastal areas is limited, especially during tropical storms, hindering the accurate quantification of how anthropogenic activities influence the ocean ecosystem. In this study, the Nested Air Quality Prediction Modeling System was used to investigate the wet deposition of N induced by typhoon Hagupit over eastern coastal China from an in- and below-cloud process perspective. Our results reveal for the first time an enhancement mechanism of N deposition related to the 'pumping effect' of the typhoon. Different from the non-typhoon conditions, air pollutants in the typhoon-affected regions were pumped into the higher altitudes and deposited via the in-cloud scavenging process in the moving path of the typhoon-affected regions. This study updates our understanding of the source–receptor relationship on atmospheric wet deposition caused by tropical cyclones.
Export citation and abstract BibTeX RIS

Original content from this work may be used under the terms of the Creative Commons Attribution 4.0 licence. Any further distribution of this work must maintain attribution to the author(s) and the title of the work, journal citation and DOI.
1. Introduction
Atmospheric nitrogen (N) deposition has important eco-environmental effects, including acid rain (Page et al 2008, Du 2018), corrosion of buildings (Knotkova and Barton 1992), ocean acidification (Doney et al 2007), nutrient anomalies (Hao et al 2011) and biodiversity reduction (Pitcairn et al 2003). The economic development in the country around the Chinese inland sea and North Pacific Ocean has resulted in gradually increasing level of the nutrient concentration such as dissolved inorganic nitrogen (DIN), turning these oceanic regions into nitrogen-rich basins. Statistically, atmospheric N deposition has been proven to be a larger contributor to the DIN input into the ocean than the riverine input, providing 10%–40% of the N in N-limited coastal regions (Okin et al 2011, J Zhang et al 1999). Wang et al (2019) estimated that about 25.81% of the total DIN input in the Yellow Sea and Bohai Sea derives from the atmospheric N deposition. The contribution of N deposition from China reported by Ge et al (2014) and Kajino et al (2013) is about 40%–60% and 51%–76%.
Typhoons usually carry associated hazards, such as strong winds, storm surges, and rainfall, which can cause considerable damage and disruption. In addition to these direct forms of damage, the wet deposition of nitrogen caused by typhoons, which also serves as a lager contributor of DIN, has also drawn much attention in coastal regions (Lin et al 2000, Sakihama and Tokuyama 2005, Fang et al 2009, Chen et al 2015, Toyonaga and Zhang 2016, Yan et al 2016, Tan et al 2018), especially against the background of global climate change, which has resulted in an increased frequency and intensity of typhoons over the past two decades (Webster et al 2006, Bender et al 2010, Knutson et al 2010). Lin et al (2000) reported that wet deposition caused by typhoons represented 20% of the total deposition based on three years of observations in a subtropical rainforest in Taiwan. Toyonaga and Zhang (2016) conducted continuous field measurements of wet deposition fluxes of ions at a coastal site in Japan from 1996 to 2003 and estimated an N wet deposition flux rate associated with typhoons of 1 meq m−2 yr−1. To a certain extent, these studies help us to understand the wet deposition of N caused by typhoons.
As we know, the wet deposition is governed by two main processes: in-cloud scavenging and below-cloud scavenging (Santachiara et al 2012, Ge et al 2014, Seinfeld and Pandis 2016, Xu et al 2017, 2019). For strong convective system (cold vortexes/typhoon), in-cloud contributions of inorganic nitrogen (IN) wet deposition are higher than thought, achieving 82% during continuous observations from 2013 to 2017 (Ge et al 2021). This reveals that the study on the source-receptor (S/R) of IN wet deposition during the typhoons should focus on the source of in-cloud IN wet deposition. However, knowledge of the source and pathway of N deposition by model simulation in coastal areas remains limited. Previous studies on the S/R relationship of deposition (Holloway et al 2002, Lin et al 2008, Kajino et al 2011, Kajino et al 2013), as well as multi-model comparisons (e.g., MICS-Asia III, HTAP II) (Tan et al 2018, Ge et al 2020), were able to quantitatively investigate the source of total wet deposition via sensitivity experiments but not in-cloud wet deposition. The sensitivity experiments to obtain the S/R of deposition inevitably introduce nonlinear errors caused by the changes in emission sources (Grewe 2004). Besides, these S/R relationship of IN deposition during non-typhoon period could not be applicate to that during typhoon due to different air conditions caused by typhoon (Chiang et al 2005, Fang et al 2009). This indicates the S/R relationships of N wet deposition during deep convective process of the typhoon, especially the source and pathway of N deposition should be explored to help us to improve the knowledge of the new mechanism of typhoon induced wet deposition.
In this study, we carried out simulations of the wet deposition of inorganic N (IN) during typhoon Hagupit (3–6 August 2020) induced by in- and below-cloud scavenging using the Nested Air Quality Prediction Modeling System (NAQPMS) (Wang et al 2001) coupled with the online tracer tagging method. Based on the simulation results, the influence of the typhoon on the wet deposition of IN, especially the in-cloud wet deposition in eastern China, is discussed. Besides, the source contributions of the in- and below-cloud wet deposition with the movement of the typhoon after it made landfall in the Yangtze River Delta (YRD) were quantified. The purpose of this study is to update our knowledge on the S/R relationships of in- and below-cloud wet deposition in typhoon-affected regions and explore the new mechanism of influence of typhoons on wet deposition.
2. Materials and methods
2.1. Model description and setup
NAQPMS is a 3D Eulerian terrain-following air quality model, which is developed by Wang et al (2001). It has been widely used to simulate the air pollutants, such as ozone (Li et al 2011, 2016), dust (Tian et al 2020), anthropogenic aerosols (Chen et al 2017, Wang et al 2017, Yang et al 2018, Du et al 2019), and even toxic pollutants like Mercury (Chen et al 2015), as well as the sulfur and nitrogen wet depositions over China (Ge et al 2014). Recently, NAQPMS has been invited to participate in the Model Inter-Comparison Study for Asia III (MICS-Asia III) to compare the simulated air pollutants (Li et al 2019, Kong et al 2020) as well as the depositions (Ge et al 2020, Itahashi et al 2020) over East Asia among 14 regional and global air quality models. In this study, the cloud processes schemes for in-cloud scavenging (Dennis et al 1993, Ge et al 2014) and the below-cloud scavenging scheme (Xu et al 2017, 2019, 2020) have been updated in NAQPMS to better simulate the wet deposition of air pollutants. In order to investigate the S/R of wet deposition of IN, an online tracer tagging module is also implemented in NAQPMS to track the formation and evolution of air pollutants (Li et al 2008, Wu et al 2017). Unlike other studies that can only track the source of the total wet deposition (Lin et al 2008, Kajino et al 2013), NAQPMS coupled with the on-line tracer tagging module can quantitatively estimate the S/R of the below- and in-cloud wet deposition without introducing errors by nonlinear chemistry. Further technical details about the NAQPMS can be found in Text S1-S2 and in Li et al, (2011;2013;2016) and Ge et al (2014).
The model domain covers the East Asia (15.4°S–58.3°N, 48.5°–160.2°E), which is set on a Lambert conformal map projection with 180 × 170 grids at 45 km horizontal resolution. Vertically, the numerical model has 20 terrain-following layers from the surface to the height of 20 km with the lowest 10 layers below 3 km. The global atmospheric chemical transport model MOZART v2.4 provided initial and lateral boundary conditions for the NAQPMS. The meteorological fields for NAQPMS were provided by the Weather Research and Forecasting (WRF) model, version 3.4.1 (Skamarock et al 2008) driven by National Centers for Environmental Prediction Final Analysis reanalysis data (1° × 1°). More detailed descriptions of the WRF model including the Physics schemes can refer to in Text S3 and in Ge et al (2021). Emissions for NAQPMS are obtained from the emissions inventory in MICS-Asia III (Li et al 2017), and considering the yearly projections of the variations through the satellite-constrained NOx and ammonia (NH3) emissions based on vertical column density (VCD) values in 2020. More detailed descriptions of the updated emission can be found in Text S4. The model's output of IN wet deposition can be classified as oxidized N (Nox), including particulate nitrate, gaseous nitrate acid and NOx, and reduced N (Nrd) including NH3 and particulate ammonium. The simulation period was from 24 July to 6 August 2020, with 8 days of model spin-up time from 24 to 31 July 2020.
Figure S1 shows 22 identified areas (ID) in the NAQPMS model simulation domain. Fifteen land areas in the territory of China (i.e., YRD, FJ, SD, NCP, SX, HN, AH, HB, JX, SW, TW, West, Middle, NW, and NE) are marked in different colors, together with North Korea (NK), South Korea (SK) and Japan. The three major oceanic regions along the pathway of typhoon Hagupit (green line depicted in figure S1) are marked as ECS (East China Sea), WP (West Pacific), and JS (Japan Sea), respectively. The definitions of the 22 IDs are listed in table S1.
2.2. Observational data
Ground-based observations of wet deposition collected at sites shown in figures 1(a)–(c) during 1–6 August 2020 by the China National Environmental Monitoring Centre (CNEMC) (http://www.cnemc.cn) and Acid Deposition Monitoring Network in East Asia (EANET) ) (http://www.eanet.asia/, last access date: 25 June 2022) were used to validate the performance of the model with respect to the wet deposition of Nox and Nrd. Six of 48 stations are in SW, 9 in HN, 8 in SD, 11 in YRD, 4 in West, 4 in FJ, 2 in Middle, 1 in WP, 2 in Japan and 1 in SX (table S2). The CNEMC observations of wet deposition included daily average inorganic ion concentrations (SO4 2−, NO3 −, NH4 +, F−, Cl−, Ca2+, Mg2+, Na+, and K+) and daily accumulated precipitation from 1 to 6 August 2020. Because CNEMC sites mainly covered inland China, EANET sites located in coastal area over East Asia is additionally analyzed in this study (More information about the EANET observation can refer to Ge et al (2020)). After quality control (Text S5), the measured anion and cation concentrations of precipitation samples from 48 stations were nearly in balance and there were no large deficiencies of major inorganic ions. Surface observations of hourly PM2.5 and NO2 concentrations at the 48 stations from 1–6 August 2020 were also used in this study. Ground meteorological observations of daily precipitation and wind were obtained from China Meteorological Administration. The best-track data of typhoon Hagupit provided by the Japan Meteorological Agency were used to identify the location of the typhoon (https://www.jma.go.jp/jma/jma-eng/jma-center/rsmc-hp-pub-e.g./besttrack.html, last access: 16 December 2021).
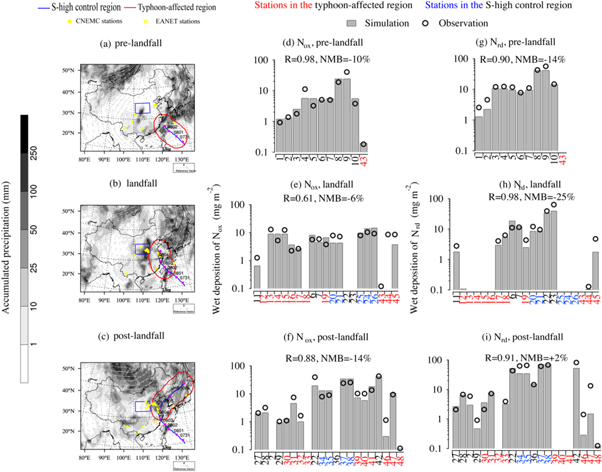
Figure 1. Comparison between observed (circles) and simulated (bars) wet deposition of (a)–(c) Nox and (d)–(f) Nrd during the pre-landfall (1–2 August), landfall (3–4 August) and post-landfall (5–6 August) stages. The stations are numbered and listed in order from south to north. The locations and characteristics of the stations can be referred to in table S2. The statistical parameters, i.e., R and NMB, are shown in the inset, and their formulae can be referred to in table S6.
Download figure:
Standard image High-resolution image2.3. Model validation
The NAQPMS was able to simulate the precipitation and wet deposition of IN both in typhoon-affected regions and in the other regions of China. The simulated accumulated precipitation in the typhoon-affected region during the pre-landfall (1–2 August), landfall (3–4 August), and post-landfall (5–6 August) stages shows good correlation, with a correlation coefficient (R) of 0.79 (N = 11), 0.78 (N = 110) and 0.75 (N = 92), and normalized mean bias (NMB) of −19%, −12.6% and 12.7%, respectively (figures 1(d)–(f)). In the S-high control region, the R values are 0.66 (N = 48), 0.64 (N = 41) and 0.68 (N = 45) for the pre-landfall, landfall and post-landfall stages, respectively, and the NMB values are −19.5%, 17.6% and −9.1% (figures S2(a), (b)). Compared to the reported statistical scores in MICS-Asia III (Ge et al 2020, Itahashi et al 2020), our modeling performance in this study have been confirmed as better. In accordance with the good model performance for precipitation, the simulated wet deposition of IN agrees well with the observations, with the NMB ranging from −25% to +2% (figures 1(d)–(i)). At stations in the typhoon-affected region especially YRD, the simulated wet deposition values of Nox and Nrd are very close to their observed counterparts, with NMBs of 4% and 8%, respectively. At stations in the S-high control region, the wet deposition of Nox was overestimated by the model, with an NMB of +32%. Such positive bias in the simulated IN wet deposition is mainly due to the overestimation of N precursors, up to +20% for NOx as reported by Ge et al (2020).
3. Results
3.1. Typhoon track and typhoon-affected regions
As the track of Hagupit in figure 1(b) (blue lines) shows, the typhoon impacted eastern China after it made landfall in the YRD on 3 August. According to the MODIS true-color image taken on 3 August (figure S3(a)), the location of mostly the cloud-free typhoon eye overlaps with the typhoon position at 00:00 UTC on 3 August. Then, the typhoon continued to move in a northeasterly direction after it entered the Bohai Sea. Finally, it made landfall in SK. The model performance of typhoon track simulation is important to reproduce the structure of typhoon surface precipitation and cloud hydrometeors (Merrill 1984, Irish et al 2008, Chavas and Emanuel 2010, Hong et al 2020, Kumar et al 2020). Besides the well-simulated precipitation by WRF, the typhoon track was also consistent with that obtained from Japan Meteorological Agency (Text S3 and figure S4). The whole typhoon track can be divided into three stages, as figures 1(a)–(c) show, i.e., the pre-landfall stage (1–2 August), the landfall stage (3–4 August), and the post-landfall stage (5–6 August).
3.2. Pumping effect of the typhoon
Figure S5 shows latitude–height cross-sections of the ratio of the PM2.5 concentration to that at ground level with the vertical wind vector superimposed. More than 30%–49% of the PM2.5 concentration at ground level could be lifted to altitudes higher than 2–3 km in less than 10 h. All cross-sections over the landfalling regions of the typhoon simulated by NAQPMS captured these fast and violent uplifts of PM2.5. The gaseous precursor of nitrate and ammonium, NOx, and NH3 in the same cross-sections, were also found to be uplifted to high altitudes within a very short time (figures 2 and 3). In particular, NOx was strongly lifted to as high as about 4 km altitudes (figure 2(c)) due to the strong upward winds in the typhoon, while the lifting of NH3 was significantly weaker than that of NOx and PM2.5. This is reasonable that NH3 is mainly emitted by agricultural sources (e.g., livestock and synthetic fertilizers) located on the surface (Aneja et al 2003), whereas NOx pollution occurs primarily through emissions from the industry at higher altitudes, for example, stack chimney emission (Aneja et al 2001). The higher altitude the emission source is, the easier for the pollutants to be uplifted to a higher altitude and hence the more contribution to long-range transport.

Figure 2. Latitude–height cross sections of the ratio of the NOx concentration to that at ground level with the vertical wind vector superimposed at (a) 120°E, 26°N–29°N, (b) 119.5°E, 28°–31°N, (c) 120°E, 28°–30°N, and (d) 120.5°E, 30°–32°N. Note that the pink boxes in the left inset represent typhoon locations at 00:00 UTC, while the black ones represent the typhoon locations every 6 h.
Download figure:
Standard image High-resolution image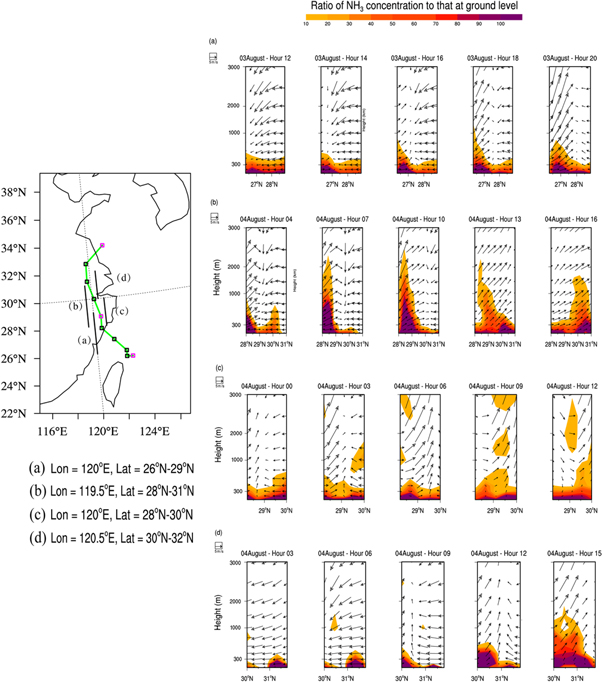
Figure 3. Same as figure 2, but for NH3.
Download figure:
Standard image High-resolution imageVertical transport of air pollutants can be caused by different mechanisms. Boundary layer turbulent mixing can contribute to the vertical transport of pollutants, but it is limited by the boundary layer height (0.6–0.8 km). The cold-front structure of most cyclones can also lift pollutants to 1–2.5 km above the ground (Kang et al 2019). However, only very strong cyclones such as typhoons may lift air pollutants to almost double the high altitudes that most cyclones can. This indicates that pollutants in the surface layer, such as PM2.5 and NOx, were quickly lifted to altitudes higher than 2–3 km when typhoon Hagupit made landfall. This elevation of pollutants influenced by the typhoon is hereafter referred to as the typhoon's 'pumping effect' (figure 4).

Figure 4. Schematic diagram of the 'pumping effect' which means the pumping up to the cloud of typhoon. The number (a)–(j) is in- or below-cloud wet deposition of Nox (unit:  10–3 mg m−2) while that in parentheses and red are the in-cloud contributions from YRD (unit: %).
Download figure:
Standard image High-resolution image3.3. Contributions from in- and below-cloud scavenging
In order to illustrate the influence of the 'pumping effect', wet deposition of IN from in-cloud and below-cloud fractions was recorded by NAQPMS. The typhoon-affected regions in YRD as well as the precipitation region in Shanxi province affected by subtropical anticyclone (hereafter called S-high) are selected to compare the different mechanisms of IN wet deposition. The definition of the S-high region is followed by He et al (2015), who use the 5880m geopotential height at 500 hPa to relate with the S-high regions as shown in figure S6, and hence was displayed as the blue rectangle in figure 1.
Box plots of the below- and in-cloud wet deposition and their contributions to the total wet deposition of Nox and Nrd during the pre-landfall, landfall, and post-landfall stages in the YRD and S-high region are displayed in figure 5. In YRD, with the average precipitation increasing from 5.6 to 21.6 mm, the in-cloud Nox wet deposition contribution changed from 75% during pre-landfall to 89% during landfall. In the S-high region, however, in-cloud Nox wet deposition contribution increased only slightly from 63% to 67%, with the average precipitation increasing from 14 to 27.6 mm. A similar phenomenon is found for Nrd wet deposition. Xu et al (2017) pointed out that the in-cloud contributions to the total wet deposition will increase with the increase in rainfall as the effect of the washout process weakens. However, the increase of in-cloud contributions is limited by the concentrations of pollutants within the clouds. The larger increase in the typhoon-affected region than in the S-high region indicates the significance of the typhoon's 'pumping effect', which elevates the surface air pollutants to high altitudes and contributes more to the in-cloud scavenging during precipitation events. It is noteworthy that the upper limit of the in-cloud contribution of Nox (Nrd) reached 89% (80%) during the typhoon, which is significantly higher than the average value of 39% (53%) in 2014 observed in China (Xu et al 2017) and the value of 34% observed in Japan (Aikawa and Hiraki 2009, Aikawa et al 2014). The highest value (82%) was found in the cold vortex events during the four years observation in Beijing, China reported by Ge et al (2021). This observation confirms that in-cloud contributions for strong convective weather systems like typhoons and cold vortexes can be much higher than thought (figure 6, figure S7).
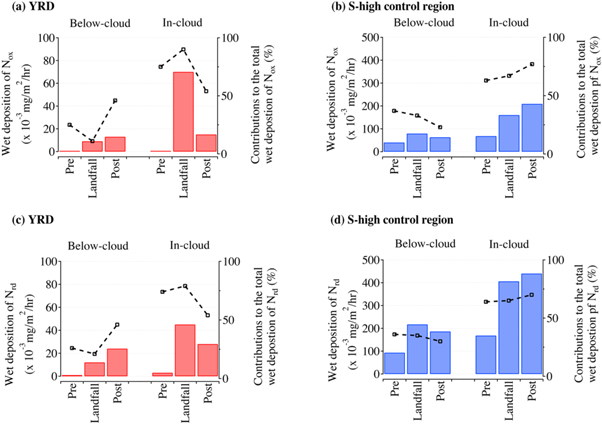
Figure 5. Box plots of below-cloud and in-cloud wet deposition and corresponding contributions to total wet deposition of Nox or Nrd during the pre-landfall (1–2 August), landfall (3–4 August) and post-landfall (5–6 August) stages in the (a), (c) YRD and (b), (d) S-high control region.
Download figure:
Standard image High-resolution image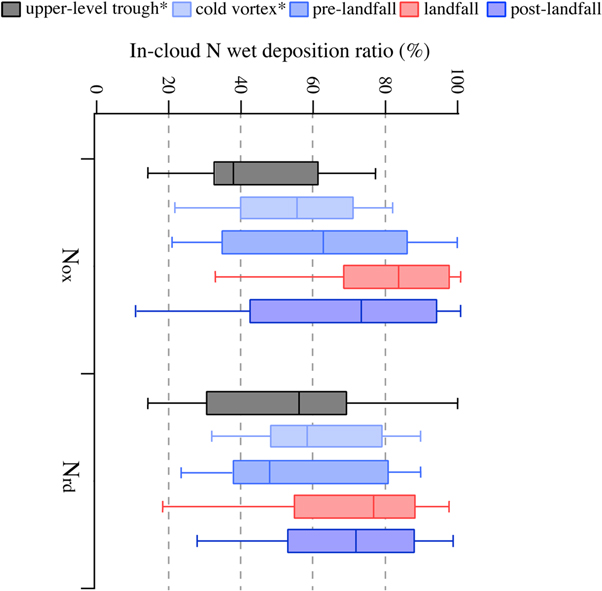
Figure 6. In-cloud wet deposition contributions of Nox and Nrd for upper-level trough, cold vortex and three different typhoon stages (pre-landfall (1–2 August), landfall (3–4 August) and post-landfall (5–6 August)). Note that the two observation results i.e. upper-level trough and cold vortex marked with stars are derived from Ge et al 2021.
Download figure:
Standard image High-resolution image3.4. Source identification into the scavenging pathways
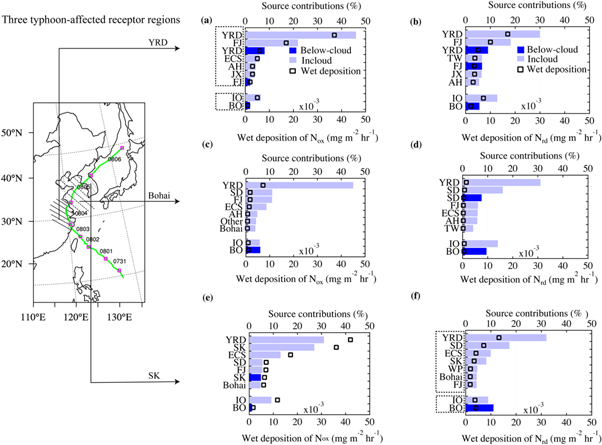
To better characterize the mechanism of nitrogen deposition induced by typhoons, detailed simulations were done using the updated NAQMPS. Different from the previous studies, the source of wet deposition during the typhoon event was firstly identified in relation to wet scavenging processes (figure 7). Three typical typhoon-affected regions, i.e., YRD, Bohai, and SK were chosen as the receptor regions under the influence of typhoon Hagupit to quantitatively investigate the source of in- and below-cloud wet deposition.
Figure 7. Source contributions to the in-cloud (light blue) and below-cloud (dark blue) wet deposition of Nox (left) and Nrd (right) when typhoon Hagupit made landfall in three typhoon-affected receptor regions: (a), (b) SK, (c), (d) Bohai, (e), (f) YRD. The left-hand coordinate is the abbreviation of the source region, which can be referred to in figure S1. Except for the top seven sources regions in terms of source contributions, the rest are replaced with IO and BO, which represents other sources of in-cloud and below-cloud, respectively. Note that the pink boxes in the left-hand inset represents the typhoon locations at 00:00 UTC, while the green line represents the 6-hourly typhoon track.
Download figure:
Standard image High-resolution image
For the YRD, the largest source contribution to the in-cloud wet deposition in the YRD was from local emission (table S3), accounting for 52% (38%) of the in-cloud wet deposition of Nox (Nrd). The relative contribution to the below-cloud from YRD was 68% (48%), corresponding up to 8% (9%) of total wet depositions of Nox (Nrd). This reveals that local emissions were the dominant source of both in-cloud and below-cloud wet deposition in the YRD. For Bohai, the largest contribution was from emissions in the YRD, reaching up to 47% of the total wet deposition of Nox, which was about four times higher than other sources (table S3). However, pollutants from the YRD contributed significantly less to the in-cloud wet deposition of Nrd than that of Nox (1.5 versus 7.2 × 10⁻³ mg m−2 h−1, table S3). For SK, the largest in-cloud contributor was also from the YRD. However, the largest contributor to the total wet deposition of Nox in SK was the local emission, which accounted for 32% of the total wet deposition, with 5% from the below-cloud part. Detailed analysis of the S/R relationship in three regions can be found in Text S6 and table S3.
Analysis of IN deposition caused by typhoons in terms of scavenging pathways can shed light on typhoons' effect on the coastal region, optimize the source identification and help to protect the marine ecological environment. This updated S/R relationship of in-cloud wet deposition during the typhoon event challenges the traditional view that the in-cloud wet deposition of acidic pollutants is mainly linked with medium- or long-range transport, which is mainly in non-typhoon events. This significantly higher contribution from the YRD region can be attributed to the 'pumping effect' of the typhoon, which influenced greatly not only the long-range transport of IN from the YRD to Bohai and SK but also the local wet deposition in the YRD itself.
3.5. Implications to the knowledge of IN wet deposition affected by typhoon landfall
What will the mechanism so-called 'pumping effect' of typhoon affect the wet deposition of nitrogen in the downwind typhoon-affected regions. We have quantified the effect of the 'pumping effect' according to the S/R relationship of Nox wet deposition as figure 4 shows. As section 3.2 described, when typhoon HAGUPIT made landfall in YRD, the PM2.5 and NOx in the multiple cross-sections, were found to be uplifted to higher than 2–3 km in less than 10 h due to deep convective transports associated with cyclones (Fadnavis et al 2011). These pollutants were scavenged by the clouds, making the in-cloud wet deposition significant increase in this study.
According to table S3, when typhoon made landfall in YRD, 106 × 10−3 mg m−2 amount of oxidized N were uplifted into the cloud by the pumping effect of typhoon. Meanwhile, with the development of rainfall in YRD, 37 × 10−3 mg m−2 of uplifted N from YRD were scavenged by in-cloud process, which accounts for 52% of the total wet deposition in YRD (a). With the movement of typhoon, the remained amount of 69 × 10−3 mg m−2 oxidized N pollutants (g) induced by pumping effect were transported into downwind typhoon-affected regions such as Bohai and South Korea. This made 7.2 × 10⁻³ mg m−2 in-cloud wet deposition of Nox (c) in Bohai and 42 × 10−3 mg m−2 in-cloud wet deposition of Nox (e) in South Korea. Different from the in-cloud scavenging, the below-cloud scavenging was much smaller. Almost 6 × 10⁻³ mg m−2 amounts of oxidized N from local region were washed out and deposited into YRD (b). Due to the airflow supported by typhoon, 5 × 10⁻³ mg m−2 amounts of oxidized N from YRD (h) were transported below the cloud to downwind areas such as Bohai (0.4 × 10⁻³ mg m−2) and South Korea (<1 × 10⁻³ mg m−2).
The contributions of long-range transport from the YRD were almost maintained above 40% in Bohai and 30% in SK mainly via the in-cloud process. This means that, as the typhoon moved to downwind areas, the long-range transport of pollutants from the YRD constantly influenced the in-cloud wet deposition in Bohai and SK. The largest source contribution to the in-cloud wet deposition in the YRD was local, which contributed to 52% of the in-cloud wet deposition of Nox. This reveals that local emissions were the dominant source of the in-cloud wet deposition in the YRD. This updated S/R relationship of in-cloud wet deposition during this typhoon event challenges the traditional view that, the in-cloud wet deposition of acidic pollutants is mainly linked with medium- or long-range transport. The above analysis reveals the importance of contributions from emissions in typhoon landing to the typhoon-affected regions. This mechanism of wet deposition due to the 'pumping effect' may have profound effects on the wet deposition of N in typhoon-affected areas.
4. Conclusions
The updated wet scavenging module in NAQPMS, coupled with the online tracer tagging method, was used to investigate the sources of in- and below-cloud N wet deposition during the landfall of typhoon Hagupit in the YRD, China. The model was able to capture the observed variations of Nox and Nrd during the movement of Hagupit. Based on the NAQPMS simulations as well as the observations, the influence of the so-called 'pumping effect' mechanism of the typhoon on the wet deposition of N was explored. This made the air pollutants easy for them to be captured by cloud droplets and deposited via the in-cloud scavenging process, which contributed to 80%–89% of the wet deposition of N in the typhoon-affected region. In addition, the present study has improved our knowledge of the S/R relationship of the wet deposition of N during the landfall stage of typhoons in China, especially the in- and below-cloud processes of wet deposition. As the landfall region for Hagupit, the YRD was found to be the largest contributor of wet deposition via the in-cloud process, not only for itself but also in the other regions of Hagupit's pathway, i.e., the Bohai Sea and South Korea. This can be attributed to the 'pumping effect', which contributes to a large proportion of the in-cloud wet deposition in the downwind typhoon-affected regions. Continuous observations of wind profile radar combined with aircraft data show that the vertical wind profile and intensity of pressure are of crucial importance for determining a tropical cyclone's radial inflow (Liao et al 2019). This means that the amounts of pollutants which typhoon pumps into are closely related to model simulation of the intensity of the typhoon itself. The simulation of intensity pressure of typhoon, especially the central pressure does not reach the actual observation. The error caused by the typhoon simulation of air pressure could affect the model performance on pumping volume. Fujita et al (2004) observed the inflow height would get stronger as typhoon moved to north-eastward. Probably, with typhoon moving north-eastward the height of 'pumping effect' can reach beyond the 2-3 km, which was found in this study, and this uncertainty will further lead to uncertainty in the amount of in-cloud scavenging, long-range transport and the deposition. Besides, improving the model performance of the central pressure of typhoon should also be considered in future. Also, different typhoons would have multiple and variable height of 'pumping effect', which should been examined with typhoon moving north-east.
Acknowledgments
This work was financially supported by the National Science Foundation of China (Grants 42122049), and the National Key R&D Program of China (2022YFC3702002) and the Strategic Priority Research Program (A) of the Chinese Academy of Sciences (Grant XDA19040204).
Data availability statement
All data that support the findings of this study are included within the article (and any supplementary files).
Supplementary data (4.4 MB DOCX)