

Abstract
Will climate change experience shape people's climate change perception? To examine the evidence, we performed a pre-registered meta-analysis using data from 302 studies, covering 351,378 observations. Our results find that climate change experience only has a weak positive correlation with climate change awareness in general (r = 0.098, 95% CI 0.0614, 0.1348), and the effect sizes vary considerably across different climate events. General hazard and temperature anomalies experiences have significant correlations, but other events exhibit no or neglectable effects. The moderator analysis showed that self-reported studies result in higher correlations, whereas studies based on victims' actual experiences report lower effect sizes. Our study suggests that people's climate change experiences may not be effective in shaping their awareness of climate change, which is likely due to people's attribution style and adaptability. The importance of proactive education thus is further emphasized to raise the awareness of climate change.
Export citation and abstract BibTeX RIS

Original content from this work may be used under the terms of the Creative Commons Attribution 4.0 licence. Any further distribution of this work must maintain attribution to the author(s) and the title of the work, journal citation and DOI.
1. Introduction
Human-induced climate change is increasing the frequency and severity of extreme weather events worldwide, such as drought, floods, heat waves and wildfires [1, 2]. Direct damages and widespread adverse impacts on human livelihood and well-being caused by these natural disasters call for inter-governmental collective actions and cooperation across different social classes [3, 4]. Climate change perception, referring to individuals' perceptions, beliefs, and concerns about climate change (table S2) [5, 6], is a prerequisite for mobilizing climate change mitigation or adaptation behaviors and is critical for massive collective behavior changes [7]. Further, awareness and perceptions can influence regional climate policymaking and nation-level climate goals through public opinion expression and public participation [8, 9]. Thus, understanding the public's perception is an important step in the effort to combat climate change. Over the past decades, from a worldwide scope, belief in climate change has been gradually increasing in all age groups according to a previous study [10]. However, climate change skeptics is still a prominent barrier to climate change mitigation and adaptation behaviours. There could be various channels promoting perspective changes, for example, better education on scientific findings, more extensive mass media coverage, as well as personal experiences with extreme weather events. Compared to knowledge and information transfer processes, experiences are the most direct way that people can feel the real impacts of climate change, thus personal experience has received particular research interest [11]. A growing number of empirical studies have probed into questions of how climate change experiences affect perceptions of climate change and what factors make this effect different. With reference to previous studies [11–13], climate change experiences in this paper refer to self-reported or objectively recorded extreme weather events. Proxy variables representing extreme weather events include temperature, precipitation, and other objective indicators as well as subjective assessment of experiences.
To date, various insights regarding the impacts of extreme weather, abnormal temperatures, and natural disasters experiences on climate change perception have been gained, but are still controversial. Some studies have reported an unambiguous causal link between climate change experiences and perception [5, 12, 14, 15]. Others doubt the correlation may be negligible [16, 17]. Based on these studies, scholars have systematically reviewed the relationship from a holistic perspective. Weber [18, 19] provided a comprehensive review of the factors influencing the perception of climate change, and concluded that either local or global-scale warming impacts on individual beliefs. Borick and Rabe [20] further concluded that these kind of experiences will shape the public's global warming beliefs and their policy preferences. Sugerman [21] found a small but significant effect focusing on the beliefs change after experiencing local temperature anomalies. Howe [11, 13] pointed out that there are moderating effects of study design, samples and measurements.
These studies contributed significantly to our understanding of the relationship between climate change experiences perceptions, but several improvements are still needed to gain a more thorough and more detailed insight. First, many of the aforementioned studies failed to cover all types of climate change events but focused only on meteorological indicators such as temperature [2, 21, 22]. However, public perception of climate change is affected not only by temperature anomalies, but also by other climate hazards [23]. Second, an update on the review is necessary due to booming of relevant studies in recent years. Third, the correlation between climate change experience and perception, as well as its assessment is interfered by many study-level variables, need to be untangled to explore possible moderators in the relationship. Finally, controversy over the conclusions need to be clarified based on a more comprehensive summary of the growing number of empirical studies. Therefore, a meta-analysis based on large samples is of great importance to provide us with quantitative evidences [24].
This paper aims at filling current research gaps by conducting a more comprehensive and updated meta-analysis 13 following open science practices. We examined the effects of various climate change experiences on perceptions, including extreme weather, unusual temperatures, long-term or short-term climatic conditions. Our data also includes studies of different regions, times, and research methods, covering more than 300 effect sizes extracted from 70 studies, which contains relatively more abundant cases compared to previous studies [5, 13, 21, 23]. With this advantage, we are able to explore the heterogeneity of existing researches and evaluate the relationship in a robust way. Below, we report our holistic evidence on how climate change experience affects public climate change awareness, perception and opinion in general and how study-level factors influence the effect.
2. Methods
2.1. Inclusion criteria and selection of studies
We first took account of all relevant literature from previous reviews [11, 18, 19, 25], and a new search for more recent ones was conducted. We searched article abstracts, keywords and titles for terms related to extreme weather and climate change in January 2022. A comprehensive search strategy was designed before pre-registration, and we selected Web of Science (WoS), PsycINFO and ScienceDirect as our searching database (ref to supporting materials to see full search process). Searching keywords used include three clusters, namely climate change related keywords (i.e., 'Climate chang*', 'Global warming*', 'Climate risk*', 'Climate variabilit*', 'Climate extrem*' and 'Climate uncertaint*'), perception-related keywords (i.e., 'perception*', 'awareness', 'opinion*', 'attitude', 'belief*' and 'experience*'), and extreme weather related keywords (i.e., 'extreme', 'weather*', 'cyclone', 'drought', '*fire', 'flood*', 'hail storm', 'heat wave', 'sea level rise', 'storm', 'tornado', 'thunder', 'tropical storm', 'typhoon', 'wildfire', 'wild fire' and 'cold wave'). Additionally, we manually checked the following high-related journals, which are: Environment and Behavior, Global Environmental Change, Journal of Environmental Psychology, Climatic Change, Environmental Politics. The PRISMA flowchart of this paper is reported in supporting materials.
Once the metadata had been retrieved, Zotero was used to import and de-duplicate the literature information, with the ability to download accessible articles in bulk. We used Rayyan [26], a web and mobile app for systematic reviews, to initially screen the metadata. Two pre-trained raters performed independent screening with the assistance of Rayyan according to the coding manual, and the results were checked by another rater. Disputes that arose during this process were addressed by the corresponding author. We then retrieved the full text of the literature after completing the abstract screening process. For articles where full text is not available, we tried to reach out by searching for author information in the metadata, and if the contact fails, the article would not be included in the analysis (figure S2). In this paper, climate change perception was defined as the attitudes, beliefs, attribution and intentions towards climate change, and we only included studies that report the correlation coefficient (or other related statistics) between extreme weather and climate change perception [11, 18, 27]. We found a variety of acceptable extreme weather events, including cold wave, cyclones, droughts, floods, heatwaves, temperature anomalies, wildfires, and precipitation anomalies, etc. An overview of this criterion is provided in our research protocol.
2.2. Effect size calculation and moderators
We adopted Ringquist's suggestion that for r-based effects [28], we used the following rules for their calculation: (1) If an article reports correlation coefficients, we directly converted the correlation coefficients to Fisher's z. (2) If an article reports regression coefficients or t- or z- type statistics, we first converted the statistics to r and subsequently converted them to Fisher's z. (3) If an article uses an experimental design, we first calculated Cohen's d, and then converted it to Fisher's z. The calculation of effect sizes is shown in detail in the pre-registration file. In addition to the calculation of effect sizes, other possible moderators were also extracted from the article, such as the types of extreme weather, the way perception was measured, the country or region, the sample size, the duration of the disaster, etc. These moderating variables were used in the subsequent meta-regression analysis.
2.3. Research synthesis
Since most of the included studies have multiple outcome variables, to harmonize the dependency of effect sizes within studies, we estimated a multi-level meta-analysis model [29, 30], using the R package metafor [31]. The three-level model is consisted of three different levels of variability regarding effect sizes : the sampling variance of the individual extracted effect sizes (level 1), the variance between effect sizes extracted from the same study (level 2), and the variance between effect sizes extracted from different clusters (level 3) [30]. Variability of level 2 and 3 are estimated, while level-1 variability is assumed to be known and computed as the observed sampling variance of the extracted effect sizes. Before modelling, we checked the anomalous studies. Using infl function in metafor package, we eliminated possible outliers by calculating metrics such as cook's d [32]. Also, since meta-analysis is sensitive to estimators, we used multiple estimators (REML, ML, HS, DL) for regression in order to ensure the validity of the results [33]. Besides, the assessment of publication bias is a crucial part of refining meta-analytical analyses. We examined publication bias using funnel plots which can reflect the bias through asymmetry of the plot. As demonstrated in figure S3, there exist an asymmetry in the effect sizes, which indicates a potential publication bias.
3. Results
3.1. Sample description
We conducted a systematic search for studies related to climate change experiences and climate change perceptions, in which the samples exhibited a high degree of diversity and a visible increment. As many as 302 effect sizes of different climate change experiences were reported in the 70 articles eventually included in the study. Over twenty types of events related to climate change such as floods [23, 34], hurricanes [35, 36], temperature anomalies [37], droughts [12], precipitation anomalies [38, 39], and other climate-related natural hazards [40] are included. These samples covered 351,378 participants in 12 countries, among which 11,831 individuals (3.4%) were directly exposed to climate change events. We grouped these events into 12 categories, i.e., general temperature anomalies, cyclone, general hazard experience, flood, drought, general weather anomalies, precipitation, snow anomalies, heat wave, cold wave, wildfire and others (all the criterions for classification are presented in method section). Table 1 shows descriptive statistics for the dataset classified by different climate events, where general temperature anomalies accounts for 33% of the samples. Drought ranks second accounting for 8%. In the included articles, effect sizes were used to measure the magnitude of the correlation between climate change perception and personal experiences with climate events because they are independent of the unit of measurement and are not influenced by sample size (e.g., the correlation between reported typhoon weather experiences and reported climate change perceptions can be uniformly translated into effect sizes of the same scale). A higher value means a positive relationship of the climate-related event on climate change perception (more intensive climate event is associate with belief that climate change is human-induced or support for climate change policies, etc.). The effects of all climatic hazards featured conspicuous variability, with minimum values less than or equal to zero. Flood and general temperature anomalies have the two largest values of maximum effect size.
Table 1. Descriptive statistics of the included effects.
| Climate event | No. of effects | Percentage of total sample | Max effect | Min effect | Mean sample sizes |
|---|---|---|---|---|---|
| Cold wave | 6 | 2% | 0.140 | −0.007 | 18945 |
| Cyclone | 22 | 8% | 0.154 | −0.098 | 2778 |
| Drought | 39 | 13% | 0.214 | 0.000 | 8595 |
| Flood | 22 | 8% | 1.033 | −0.063 | 4555 |
| General hazard experience | 20 | 7% | 0.427 | −0.035 | 5387 |
| General temperature anomalies | 97 | 33% | 0.929 | −0.623 | 3123 |
| General weather anomalies | 17 | 6% | 0.460 | −0.064 | 1633 |
| Heat wave | 16 | 6% | 0.203 | −0.020 | 8687 |
| Others | 10 | 3% | 0.637 | −0.121 | 4331 |
| Precipitation | 24 | 8% | 0.365 | −0.182 | 6266 |
| Snow anomalies | 15 | 5% | 0.289 | −0.034 | 4123 |
| Wildfire | 2 | 1% | 0.026 | −0.007 | 16125 |
Meanwhile, measurements of climate change events (e.g., self-reported or objective data) and types of climate change perceptions were extracted and used to explain the heterogeneity in effect sizes. A full table of these data is displayed in supplementary information table S1.
3.2. Overall weak and limited correlation between climate change experience and climate change perception
By implementing multilevel meta-analysis, we first synthesized the effect sizes for all studies. After controlling for individual study errors, sampling error, and effect size dependency, we found positive but very weak effects (r = 0.0981, 95% CI: 0.0614,0.1348; outliers were dropped, see Method section for detail). Considering the results of the meta-analysis are very sensitive to different models and estimators, we re-calculated the pooling effect using a different method [33]. In the most basic random effects model, the DerSimonian-Laird estimator was used, and the corresponding r was estimated to be 0.0544 (Hunter-Schmidt: 0.0542, Maximum-likelihood: 0.0629, Restricted maximum-likelihood: 0.0629; figure 1(A)), which still shows a negligible correlation. Despite substantial heterogeneity (Q = 8513), evidence shows that in general across all types of events, climate change experience is not correlated with climate change perception, and that the causal relationship between them is, furthermore, likely to be negligible [41].

Figure 1. The sensitivity and the cumulative plot of the effect sizes. A): The x-axis denotes different model and estimations; the y-axis represents cluster robust estimate. The error bar in the plot indicates 95% confident interval. B) Cumulative results are marked in the plot by color where grey indicates past effect sizes and black means updated effect sizes..
Download figure:
Standard image High-resolution imageWe further successively explored the temporal evolutionary trends of effect sizes. In figure 1(B), the x-axis denotes the effect size (correlation coefficient between climate change awareness and climate change experience) and the y-axis represents the heterogeneity in the samples. The trajectory from gray to black reveals the evolutionary trend over time. This illustrates the process of changes in effect sizes as the number of studies increases, starting with the first paper in 2006 (denoted in light grey) and ending with the last study in 2022 (denoted in black). It is evident that the heterogeneity is low at the beginning (because the lack of literature), then increases as more studies of different designs are involved, and finally decreases again. The effect sizes fluctuate drastically in early years, then gradually stabilize and aggregate as the results accumulate. It is worth mentioning that during the entire time span covered by involved studies, the effect sizes fall into the weak effect interval less than 0.3 at most moments.
3.3. Most climate events have low effect on perception
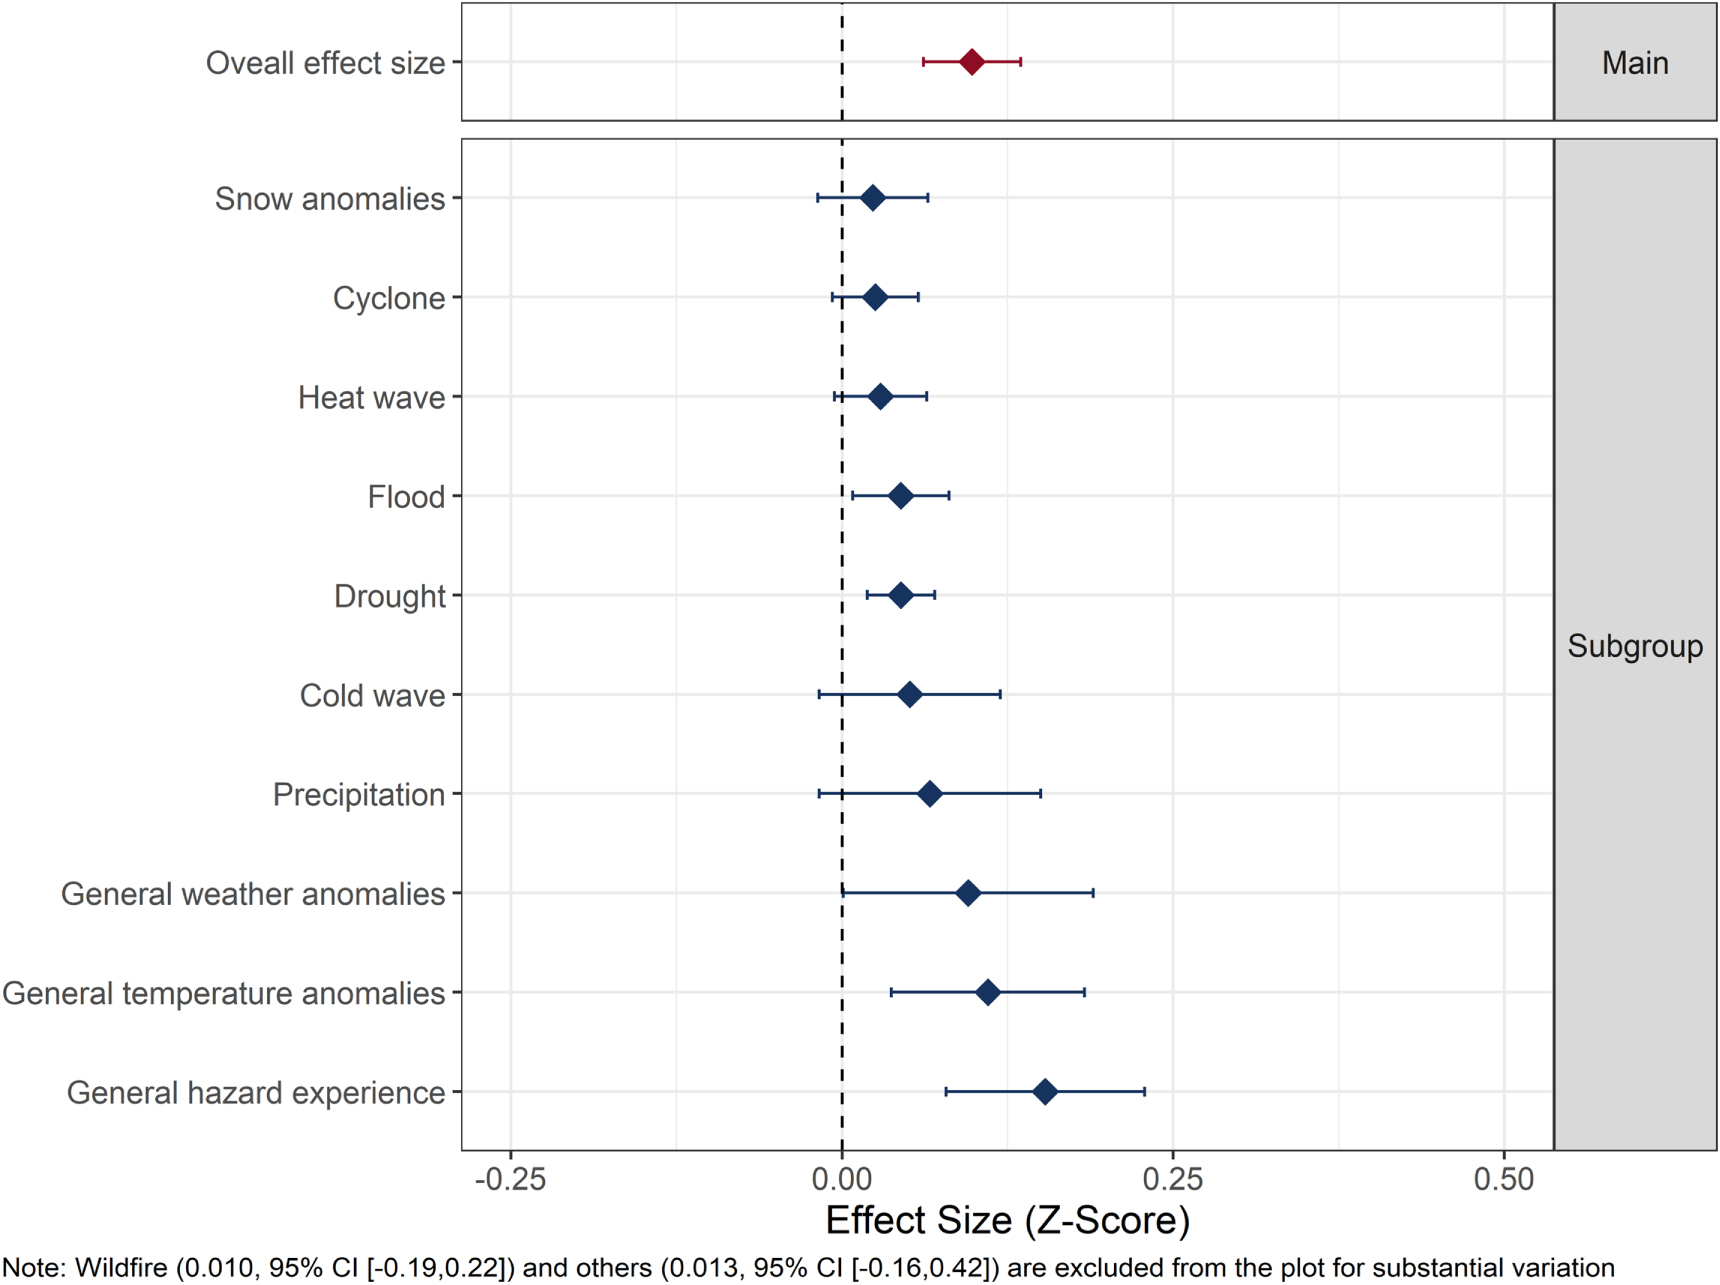
Subgroup analysis was conducted to examine the heterogeneity associated with different types of climate-related events. Does exposure to a specific climate change event results in different levels of climate change perception? Based on the classification above, we performed a multilevel meta-analysis for each group, and as before, we controlled for correlation in the same article, heterogeneity across experiments, and statistical error. As shown in figure 2, the point estimates for all climate events are greater than zero, but the 95% confidence intervals for most estimates contain zero, which implies insignificant correlations. Only the effect size for floods, droughts, general temperature anomalies and general hazard events are significantly higher than zero, indicating a valid but weak correlation.

Figure 2. Effect sizes of different climate event with overall effect size as reference above.
Download figure:
Standard image High-resolution imageGeneral hazard experience exhibits the highest correlation with climate change perception (z = 0.154 corresponding r = 0.153, d = 0.312). General hazard experience includes studies that did not clearly indicate a specific classification, such as studies using the description 'experience of a natural disaster' or 'personal experience with climate change' in the questionnaire. Also, a few studies using synthetic indices, such as the Climate Extreme Index, are also included in this category [42, 43].
General temperature anomalies likewise exhibit a result that is significant and close to the general extreme experience. In this subgroup, most studies use local temperatures or deviations of local temperatures from normal to measure climate change experiences. In a previous meta-analysis, the researchers included 31 climate change experiences specified as local temperatures to examine the relationship between the remaining climate change belief [21]. In their study, a low effect size was summarized (d = 0.17, corresponding r = 0.085). By expanding the sample size, we included 97 effect sizes for temperature or temperature anomalies (Heat wave was separated from Cold wave when high and low temperatures could be identified). We obtained a slightly larger effect size (r = 0.10, corresponding d = 0.201), and such effect size indicates a limited influence of temperature on the perception of climate change.
Droughts and floods both show weak but significant effects. Droughts include directly identifiable dry weather events, while precipitation anomalies (unspecified restricted or excess precipitation) are not included in this classification. Overall, compared to floods (z = 0.0362, corresponding r = 0.0362, d = 0.072), droughts (z = 0.0437, corresponding r = 0.0437, d = 0.087) reflect a higher effect size, but both of their effects are small.
Also, it is noted that the error of some types of climate-related events is substantial, such as the two categories: wildfires and others (see note in the figure 2). They both have small sample size (only two for wildfires), and the category of others contains a variety of events or measurement such as wind speed, sea level rise, and diseases due to climate change, which leads to high heterogeneity and errors.
Overall, our subgroup analyses suggest that the relationship between climate change experience and climate-related hazards is likely not significantly influenced by different climate change events. Most of the specific climate change experiences do not have a correlation with perceptions. However, general hazard experiences and general temperature experiences are weakly correlated with climate change perceptions, while negligible correlations existed for floods and droughts. Next, we will take a closer look at the other variables that predict the effect size in the moderation analysis.
3.4. Impact of moderators on the correlation
Meta-regression is used to examine the effect of experimental design on effect sizes. Key characteristics of the studies were selected as moderating variables, including the method of measurement (self-reported or objective), directly or indirectly exposure to climate event (victims or not), region of the research, whether it is a temperature-based study, whether behavior is studied, whether the sample size is large (namely, N > 500, follow the categorization of Nisa's study [44]), and the time of publication. These variables were treated as dummy variables if they are discrete, and we used multilevel meta-regression with REML estimators to compute the model.
As shown in table 2, we find that three moderating variables show significant impact on the value of effect size: method of measurement, whether the climate event was directly experienced, and the sample size of the study. Among these, climate change experiences measured by self-report significantly increased the effect size (p-value = 0.0009, standard error = 0.0370), implying that higher correlations may be observed in studies that use solely questionnaires rather than external indicators of experience. This result also indicates that, compared to actual climate change experiences, perceived climate change experiences are more correlated with climate change perception, confirming the hypothesis brought by previous systematic review [11]. Peoples' recognition of experiences of climate change events may be determined by their knowledge about the physical characteristics of climate change and their prior beliefs about the phenomenon. Thus, people who report such experiences may tend to have a better understanding of climate change and be more likely to believe that human-caused climate change is happening and poses a threat. Interestingly, direct exposure to climate change events (i.e., studies that used external indicators of direct exposure to climate-related events as a sample) reports a lower correlation compared to indirect exposure (p-value = 0.0199, standard error = 0.0623). A possible reason for this is that some people's feeling of negative impacts will elicit a state of aversive arousal [45] and people's refusal on attributing their extreme weather experience to the climate change [14]. Finally, studies with a broader spatial scale are more likely to report lower effect sizes, compared to studies focusing on small areas. The regression result for sample size is marginally significant(p-value = 0.0610, standard error = 0.0559), suggesting that small-scale studies may tend to report an overestimation of correlations.
Table 2. Meta-regression table: effect sizes as dependent variable.
| Variables | Coefficient | Standard error | 95% Upper bound | 95% Lower bound | P-Value |
|---|---|---|---|---|---|
| Intercept | 18.5898 | 14.8451 | 47.8125 | −10.6329 | 0.2115 |
| Measurement: (Baseline: Objective) | |||||
| Self-reported c | 0.1248 | 0.0370 | 0.1977 | 0.0520 | 0.0009 |
| Exposure: (Baseline: Indirect) | |||||
| Direct b | −0.1459 | 0.0623 | −0.0232 | −0.2685 | 0.0199 |
| Region: (Baseline: America) | |||||
| Asia | −0.0456 | 0.0753 | 0.1028 | −0.1939 | 0.5459 |
| Europe | 0.0862 | 0.0706 | 0.2251 | −0.0527 | 0.2230 |
| Oceania | 0.0196 | 0.1407 | 0.2967 | −0.2574 | 0.8891 |
| World | −0.0103 | 0.1513 | 0.2876 | −0.3081 | 0.9460 |
| Temperature or not: (Baseline: Non-temp) | |||||
| Temperature | 0.0057 | 0.0171 | 0.0393 | −0.0279 | 0.7382 |
| Behavior/Perception (Baseline: Behavior) | |||||
| Perception | 0.0667 | 0.0429 | 0.1511 | −0.0177 | 0.1211 |
| Large study (N > 500) (Baseline: Non-large) | |||||
| Yes a | −0.1051 | 0.0559 | 0.0049 | −0.2151 | 0.0610 |
| Year |
4. Discussion
Can climate change experience influence climate change perception? Our answer is yes, but the influence is negligible. Based on current outcomes, we find that overall climate change experiences have positive but very weak effects on climate change perception. Such results can also be confirmed in most of the subgroup analyses, with only a few particular types of climate change-related experiences marginally influencing climate change perception (namely, general hazard and temperature anomalies, and drought and flood experiences). Of these, general hazard experience showed the highest effect size, and the inclusiveness of this subgroup may be the reason, as respondents may have grouped a variety of experiences into this category and amplified its impact on their own perceptions. The results are similar to previous meta-analyses with smaller samples [13] and corroborate the current controversial debate on this topic [11, 25].
We believe that there are several possible explanations for the weak correlation. First, for most studies, there may be temporal variations in subjects' perceptions when using large-scale research data matched with meteorological data. As in the case of climate change attention, the public's attention tends to peak after a climate change campaign occurred and then to decline rapidly in the following days [46]. Therefore, it is unlikely that an invariable state of people's perceptions of climate change can be obtained, considering the impact of extreme events on perception fades quickly over time [47]. Second, previous research suggested that there may be other strong moderating or mediating variables that determine whether climate change experiences increase climate change perception (e.g., pre-existing political orientation and environmental awareness) [48]. For example, some previous studies shew a strong social desirability effect in climate change communication, with some people even getting irritated and denying the existence of climate change due to their political association [14]. Third, it is somehow possible that climate change experiences will not successfully trigger reflection on climate change attribution [14]. Experience with climate change may only enhance physical knowledge of the environment, which has either a negative or no significant effect on perception [49]. Finally, cultural and geographical differences could also make the effect insignificant. Previous cross-cultural studies have illustrated that perceptions of temperature can increase climate change awareness only in Asia and Africa [5], whereas most of the studies included in the current paper are from North America and Europe, which may have led to a weak effect [5]. Overall, we believe that there are complex psychological mechanisms linking climate change experience and climate change awareness. Future research needs to further explore causal relationships behind the phenomenon.
On the other hand, self-reported studies show more significant correlations compared to studies using external indicators of climate-related experience. This partially supports the previous view that the subject's perception of climate change arises only if he/she relates the experience to climate change [45]. We subsequently infer that this may come from the individual's bias about the questionnaire setting, which helped subjects to make attributions by answering questions about their climate change experiences. This led to higher scores of perceptions on the follow-up question about climate change perception. At the same time, self-reporting also implies the influence of other uncertainties such as social desirability [50] effects and forgetfulness [51], which may have led to additional biases.
Paradoxically, a lower effect size may be reported for disaster victims: respondents who have directly experienced harm from actual climate change-related events. A possible explanation for this is that the first-hand experience of the disaster is more likely to trigger individual's intrinsic psychological defence mechanism. This occurs in studies of climate change proximity [45]. For example, when people feel negative emotions, they may mitigate such feelings by avoiding or not caring about the cause of the negative emotions, if they also have low self-efficacy to address or adapt to these kinds of experience. It is worth noting that since the investigation of disaster victims is likely to elicit their adverse emotional reactions, this may further deepen their harm while creating resistance to the research. Due to the limitations of the current research sample, we are unable to further explore such psychological mechanisms, but we stress that such research must be conducted in accordance with research ethics and give victims the most support and assistance.
Grounded on our study, we propose some challenges for future research: (1) Current research lacks theoretical explanations. One third of the research included in this paper do not provide a theoretical explanation for the correlation between climate change experience and climate change perception (figure S1). (2) Climate change perception has predictive power for climate change adaptation and mitigation behaviours, but there are still many potential barriers that prevent behaviours from occurring. Although there have been many studies focussing on inaction in environmental psychology [52, 53], different pro-environmental behaviours with high or low impact have different psychological mechanisms [54–56]. Upcoming studies may focus on the possible pathway of promoting climate change perception to actual behaviour. (3) Research in regions other than the United States needs to be expanded. Currently, 73% of involved studies are from U.S. samples, 12% from EU countries and there is a shortage of research in developing countries except China (9%) (figure 3). (4) Other climate change experiences that deserve attention, such as sea level rise and diseases due to climate change, are rarely seen in current studies.

Figure 3. Heatmap of region versus extreme weather.
Download figure:
Standard image High-resolution image
At the same time, our research brings policy insights for those who communicating about climate change and decision makers. As we find that greater experience with the direct effects of climate change may be insufficient to prompt major changes in public opinion, we emphasize that improving attribution to the public may be essential for effective climate change communication. Media can increase communication of climate change reflection in the occurrence of extreme weather events thus to enhance public's attribution. Also, more measures need to be taken to overcome the denial or little reflection of climate change related extremes brought about by political positions, conflicting personal values, and research design.
Acknowledgments
The authors gratefully acknowledge the financial support from Jiangxi Social Science Foundation (21ST06) and 'Shuguang Program' (21SG22) of Shanghai Municipal Education Commission.
Data availability statement
The data that support the findings of this study are openly available at the following URL: https://osf.io/be9us/?view_only=d23f3a1ba4e842d4afed479c0842d360.
Code availability
The codes generated for this paper are available in the Open Science Framework repository:
https://osf.io/be9us/?view_only=d23f3a1ba4e842d4afed479c0842d360.
Footnotes
- 13
This meta-analysis is pre-registered at AsPredicted, and the protocol can be found in OSF page (https://osf.io/be9us/?view_only=d23f3a1ba4e842d4afed479c0842d360).
Supplementary data (0.3 MB DOCX)