

Abstract
Anthropogenic climate change is influencing the frequencies of extreme weather events. Considering the adaptability to extreme climatic risks in the future, we focused on determining whether humans have been exposed to the risks before. We define the rim of two-dimensional histograms of population under 20-year extreme temperature and precipitation as a climatic risk boundary. More than 30% (16.3%) of world population in South Asia, sub-Saharan Africa, and other regions will transgress the climatic risk boundary by the end of this century under RCP8.5 (RCP2.6) scenario. While many areas with large cities will remain within the global climatic risk boundary, they will transgress their regional climatic risk boundaries. This study shows that it is also necessary to consider the limits to adaptation for each appropriate area, considering the cultural, technological, and social transferability of adaptation. This study will help refine public perceptions of extreme climatic risks and lead to more efficient policy making.

Original content from this work may be used under the terms of the Creative Commons Attribution 4.0 licence. Any further distribution of this work must maintain attribution to the author(s) and the title of the work, journal citation and DOI.
Introduction
Human-induced climate change is increasing the frequency of heat waves and heavy rainfall [1–5], and their impacts have begun to manifest themselves in the form of various health hazards [6, 7], wildfires [8], floods [9], and other types of damaging events [10, 11]. Since the Paris Agreement, in addition to mitigation efforts that alleviate the progress of climate change, adaptation efforts, that symptomatically reduce the damage caused by climate-related events, have been promoted [1–3]; however, the limitations of these measures are of concern [12].
Climatic conditions may change to the levels not previously experienced by the flora and fauna of various regions; hence, organisms will either need to adapt to the new climate conditions or change their habitats and behaviours to survive [13, 14]. Human beings are no exception, and people are striving to transform their socioeconomic systems to adapt to the changing climate, such as introducing different varieties of crops from other regions [15, 16]. However, human society's ability to adapt is not always sufficient in relation to the speed of climate change [17]; in recent years, an increase in the number of physical health problems caused by extreme weather events has been reported [6–8, 17].
Significant risks can arise when the magnitudes of climate change exceed the adaptive capacity of a region [1–3, 12]. An unprecedented climatic risk could potentially have serious impacts on socioeconomic systems [1–3, 12, 18–20]. These studies identified when and from which region climate departures from the range of past changes will occur [18, 19], and how human habitation niches will shift as a result of climate change [21]. For each region, the magnitude and the speed of climate change within the region was of the utmost interest [2]. However, there is no analysis of how large a region has the capacity to transfer experience from past climate variability and adapt to future extreme event.
Moreover, for humanity as a whole, departure from known climatic conditions would be highly problematic. Indeed, it is the extreme weather events that have the potential to adversely affect human health [6, 7] and physical safety [8, 9]; these deserve increased attention.
In the present study, we used changes in temperature and precipitation, which represent the most fundamental, representative, and influential climatic elements, to identify the climatic risk boundary outside of which the combined risks of extremely high temperatures and intense precipitation will be greater than those of past climatic conditions and virtually no human being has ever been exposed to such a risk before.
Methods
We estimated the magnitude of extreme weather events from six general circulation models (GCMs) [22–27] employed in the Coupled Model Intercomparison Project Phase 6 (CMIP6) [28] , and these were selected according to the availability of temperature and precipitation output data for all of the results of the RCP8.5-SSP5 scenario and RCP2.6-SSP1 scenario [29, 30], as well as historical experiments when this study was initiated. Since estimates by different versions of GCMs from the same institutions cannot be considered as independent; here, only the latest ones for individual GCMs were used even though there were multiple submissions for different versions of the GCMs, and the number of models adopted is relatively small in this study.
The daily precipitation and daily maximum temperature data from the GCM output data were used to predict the changes in extreme temperature and precipitation, and the combined risk of extreme temperature and precipitation in each grid within human settlements was estimated for the past climatic conditions (1980–2009) and for future climatic conditions (2070–2099) under two scenarios: RCP8.5-SSP5 and RCP2.6-SSP1.
For the distribution of the annual maximum series of temperature and precipitation, the best fit distribution was selected for each grid among the Generalised extreme value distribution, Gumbel distribution, Normal distribution, and Log Normal distribution, and then, the probabilistic values were calculated [31]. Because the available data for the GCMs had a relatively small duration (30 years), the parameters of each distribution were estimated by using the Probability Weighted Moment method [31]. The goodness of fit of the distribution was evaluated by using the c-AIC (Akaike Information Criterion) [32], and the best fit distribution was used for each type of experiment and grid. Because the six GCMs had different resolutions [22–27], the estimated intensity of extreme weather events was interpolated to an equal-area grid with a resolution of 0.5° longitudinally and latitudinally, i.e. approximately 50 km × 50 km, and averaged. Because each of the GCM's output was considered to have a different bias, bias correction was conducted by using the extremes of temperature and precipitation calculated from the Climate Prediction Centre's (CPC) Unified Precipitation Project's product [33, 34].
The 2D histograms of population under once-in-20-year (hereafter 20-year) temperature and precipitation for each scenario were developed by using 0.125° longitudinally and latitudinally population data [35]. Each axis of the two-dimensional histogram was binned with 0.5 degrees for temperature and 1 mm for precipitation as the smallest unit. Only those bins in each bin of the two-dimensional histogram with at least one person per square kilometer and a total of at least 10 persons were retained, and the perimeter line of the set was defined as the Climatic Risk Boundary. To identify unfamiliar climatic risks from future histograms, the grids with a past value of the 20-year temperature and precipitation and the grids with a value smaller than 1 standard deviation above the mean of the past were excluded in order to eliminate small defects in the 2D histograms. Then, the remaining future grids that satisfied the condition of having a 20-year weather risk over 1 standard deviation above the mean value of the 20-year value in the past for both temperature and precipitation were defined as the grids exposed to unfamiliar climatic risks.
Result
Supplementary figure 1 shows the changes in the magnitude of 20-year temperature and the coefficients of variation among the models for each scenario. Under RCP8.5-SSP5 scenario, the 20-year temperature (Supplementary figure 1(a) (available online at stacks.iop.org/ERC/4/081001/mmedia)) is expected to rise significantly over the Northern Hemisphere mid-latitudes and the Amazon region with a maximum increase of ∼6 °C. In the equatorial regions of Africa and Asia, the changes will be smaller but will still amount to nearly a 2 °C rise. Similarly, the predicted increase of the 20-year temperature under RCP2.6-SSP1 scenario (Supplementary figure 1(b)) will be a maximum of ∼3 °C in the mid-latitudes of the Northern Hemisphere and a minimum of ∼1 °C in the low latitudes of Africa and Asia.
The rate of increase in 20-year precipitation and the coefficients of variation among the models are shown in figure S2. Under the RCP8.5-SSP5 scenario, the 20-year precipitation in the Sahel and southern Arabian Peninsula will be more than double than that in the past. Similarly, in the RCP2.6-SSP1 scenario, the increase rate will be ∼1.5-times higher in the Sahel, Arabian Peninsula, and western India than that in the past.
Figure 1 and Supplementary figure 3 show the 2D histograms of population under the 20-year precipitation and temperature estimated for past and future conditions under the RCP8.5-SSP5 and RCP2.6-SSP1 scenarios, respectively. The colour density corresponds to the population under the climatic risks of 20-year temperature and precipitation. The blue histogram represents the past (1980–2009), and the red histogram represents the future (2070–2099). A greater shift can be observed in the histogram from the past to the future under RCP8.5-SSP5 compared to the shift under RCP2.6-SSP1, and correspondingly, a larger population will transgress the climatic risk boundary. Here, the term ' transgress' does not mean that people will face a specific climate, as in the case of 'exposure,' but rather that the climate they face will change due to climate change and that they will face a climate beyond the scope of the Climatic Risk Boundary defined in this study.
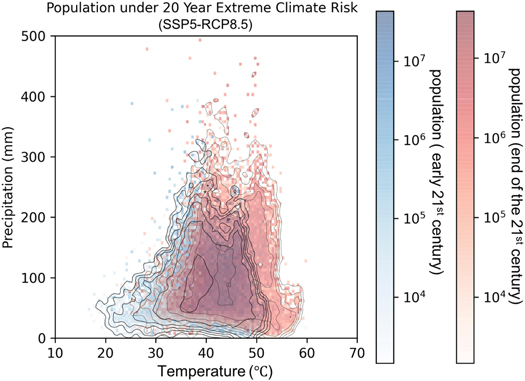
Figure 1. Projected change in the population exposed to extreme weather risks.
Download figure:
Standard image High-resolution imageTwo-dimensional histogram representing the population exposed to the combination of extreme climatic risks, calculated by the 20-year temperature and 20-year precipitation occurrences divided by bins of 0.5 °C and 10 mm, respectively. The blue histogram shows results for 1980–2009; the red histogram shows results for 2070–2099. These data are for the RCP8.5-SSP5 scenario. See figure S3 for a 2D histogram of the RCP2.6-SSP1 scenario.
Figure 2 and Supplementary figure 4 show the locations of the populations outside of the climatic risk boundary at the end of the 21st century under the RCP8.5-SSP5 and RCP2.6-SSP1 scenarios, respectively. Under the RCP8.5-SSP5 scenario, central India and portions of the Sahel region will transgress the climatic risk boundary and be exposed to unfamiliar climatic risks with regard to both temperature and precipitation that human beings have not been previously exposed to. Similarly, the Arabian Peninsula, northern India, and the Sahel region will be exposed to unfamiliar extreme temperature risks. People in Southeast Asia and East Asia also will be exposed to unfamiliar extreme precipitation risks. In total, approximately 2.52 billion people, 34.2% of world population under SSP5, will transgress the climatic risk boundaries for the RCP8.5 scenario, whereas for the RCP2.6 scenario, it will be approximately 1.1 billion people, or 16.3% of world population under SSP1 (Supplementary table 1).

Figure 2. The population expected to transgress the climatic risk boundaries and be exposed to unfamiliar extreme climatic risks, with insets showing close-up views of the geographic distribution trends.
Download figure:
Standard image High-resolution imageIn yellow and blue grids, people will be exposed to unfamiliar extreme temperature and precipitation risks, respectively, while in the red grids, people will be exposed to a combination of unfamiliar extreme climatic risks. Colour shades correspond to the density of the residents; dark: > people, mid-range: > people, and light: at least 1 person in grids with spatial resolution of 0.5° × 0.5°, i.e. approximately 50 km × 50 km. See figure S4 for the original maps pertaining to the RCP8.5-SSP5 and RCP2.6-SSP1 scenarios.


Discussion
Unlike the planetary boundaries [36, 37], this study elucidates the data-driven boundaries of human settlements in terms of the climatic risks whether anybody in the world has been exposed to. Extreme climatic risk beyond the boundary is unfamiliar to us and could be potentially catastrophic to human beings in the form of health hazards and climatic disasters [6–11].
The Intergovernmental Panel on Climate Change's Special Report on Managing the Risks of Extreme Events and Disasters to Advance Climate Change Adaptation (IPCC SREX) report [2] estimates of changes in extreme weather events have used two basic climatic elements, viz. temperature and precipitation, for their assessments. In this study also, we focused on the extremes of temperature and precipitation to delineate the climatic risk boundary, however, the climatic risk boundaries in terms of extremely low temperatures and/or droughts can be assessed by the same methodology if needed [38].
Human beings are influenced by a variety of climatic factors, including wind speed, humidity, pressure, and sunshine hours, in addition to temperature and precipitation [39, 40]. Therefore, the construction of climatic risk boundaries that also consider the extremes of other climatic elements would make the potential risks of climate change even clearer. In addition, extreme evets associated with precipitation can be assessed at various time scales, such as weekly or monthly extremes, corresponding to the time scales of floods and droughts on local or continental scales. Longer or shorter return periods, such as once in 10 years [41] or ∼100 years [42], can be examined. The results for the return periods of 10 years and 1 year are shown in Supplementary figures 4(c) and 4(e). The results are quite similar with those for the return period of 20 years (figure 2) even when the risk level (return period) is changed, and the number of people experiencing unfamiliar climatic risks at the end of this century will be 2.55 billion and 2.26 billion, respectively, that are close to 2.52 billion for 20-year extremes. Even though the currently available dataset cannot allow us to consider events with a long recurrence period with confidence due to the limited sample size, we expect the distribution and the number of people under unfamiliar climatic risks at the end of this century will be similar for longer return periods, such as once in 100 years or 500 years, and it will be revealed when a large ensemble, such as d4PDF [43], by multiple climate models will be available.
In this study, uncertainty in climate models has been taken into account. In addition, climatic risk boundaries may depend on the selection of the climatic elements to be assessed, and the methodology employed. Therefore, climatic risk boundaries should be set with regard to the intent of the assessment. Furthermore, it should be noted that even within the climatic risk boundary proposed in this study, i.e. the domain of known weather risk, the damage may not necessarily be minor if climate change progresses rapidly and the changes are significant [44, 45].
Furthermore, we presumed that the known climate risks can be adapted to if human beings somewhere in the world have already been exposed to the risks, without considering any barriers to the transfer of adaptation measures and the situation people are struggling to adapt. However, there is no guarantee that weather risks can be effectively managed by learning best practices from the people in the regions already under higher extreme risks. Cultural, social, or economical gaps may also prevent smooth transfer of knowledge and experiences from the regions where extremely high climatic risks have been managed to the regions that will be exposed to the risks for the first time [12].
For example, the existence of people living under the risk of hotter and wetter weather does not necessarily mean that people in other parts of the world will be satisfied with the way they adapt to the weather risk. The acceptability of the adaptations currently being employed by people in other regions cannot escape the influence of cultural and social aspects [12]. Figure 3 shows the regional climatic risk boundaries of populations in East Asia, South Asia, Central Europe, and East North America. The change in climatic risks for some grids with large cities are shown as arrows to illustrate the representative changes in the areas within the region. It should be noted that the names of cities are used here to complement the geographical information of the grid, and urbanization effects are not considered in this study. The heat island effects will change the urban climate more drastically, and the advances in community ESM and other methodologies will enable more detailed prediction of urban climate in large cities [46].

Figure 3. Projected change in climatic risk boundaries of the 20-year temperature and precipitation in (a) East Asia, (b) South Asia, (c) Central Europe, and (d) East North America.
Download figure:
Standard image High-resolution image
Arrows show the shifts in extreme climatic risks in large cities represented by the direction of the arrow from the past climatic conditions (1980–2009) to the future climatic conditions (2070–2099) under RCP8.5-SSP5 scenario. See figure S5 for the regional classifications and Supplementary figure 6 for the change in climatic risk boundaries of the 20-year temperature and precipitation in the other regions.
Compared to the histogram for the entire world (figure 3), the majority of the population in each region will still be within the global climatic risk boundary of 20-year temperature and precipitation at populated places in the world. Nonetheless, the regional 2D histograms for the past and future are almost exclusive for each region, and results indicate that most of the population will be living outside of the past climatic risk boundaries for that particular region. The results show that some regions in East Asia and South Asia will be exposed to truly unfamiliar extreme climatic risks (figures 3(a) and (b)). This result is consistent with the areas specifically highlighted in the IPCC's sixth report on the effects of climate change [41]. In practice, however, adaptation measures are often promoted at a specific geographic scale, such as a country or region, and it is important to consider the limits to adaptation in each region. For example, Central Europe and the East Coast of the United States do not deviate from the boundaries of the world as a whole. This does not mean that climate changes in these regions do not have significant impacts to people in these regions. Many areas in Central Europe will transgress the climatic risk boundary, and people in the region will be exposed to unfamiliar risks, even though somebody in other region should have already been exposed to these risks (figure 3(c)) in the past. Similarly, people in the regions on the East Coast of the United States will be exposed to unfamiliar climatic risks for that region. (figure 3(d)) Without appropriate knowledge and experience transfer, it will be difficult to adapt in these areas. Conversely, however, if appropriate knowledge and experience transfer is made in these regions, the difficulty of adaptation to climate in the future may decrease, and the results of this study can be used to decipher from which regions knowledge and experience should be obtained. As a future development, it will be important to identify appropriate geographic scales for climate change risk boundaries and to use analyses that are tailored to these scales.
These figures allow us to examine human beings in which region will be exposed to unfamiliar extreme climatic risks in the future. Rapid implementation of urgent mitigation measures is critical to reducing the adverse effects of these risks on humanity, but even if mitigation measures are implemented rapidly and extensively, it will be difficult to completely limit climate change [3, 41]. When climate conditions change, humanity must transform its socioeconomic systems to adapt [15, 16]. If the risks are within the climatic risk boundaries, we can identify which regions are currently under the similar climatic risk and learn and implement appropriate adaptation measures. More reasonable assessments of the risks will also be enabled by considering the transferability of knowledge and technologies in relation to social and economic disparities [12], however, this study will make a significant contribution to future research on climate change in that the methodology presented here can be used to perform similar analyses no matter what model or scenario is chosen. These findings highlight the importance of smooth exchanges of knowledge and technologies through global partnerships based on multilateralism for implementing applicable adaptation measures to climate change.
Acknowledgments
This work was supported by the Japan Society for the Promotion of Science [KAKENHI; 16H06291/21H05002] and by the Environment Research and Technology Development Fund (JPMEERF20202005) of the Environmental Restoration and Conservation Agency of Japan. The authors are grateful for the supports on the data handling and bias correction by Drs. Hyungjun Kim and Satoshi Watanabe at The University of Tokyo.
Data availability statement
The data that support the findings of this study are openly available at the following URL/DOI: https://doi.org/http://hdl.handle.net/2261/00079735.
Author contributions
TO and TS designed the research framework, TS conducted data analyses, and TO and TS developed and revised the manuscript.