


Abstract
To evaluate recent changes in anthropogenic Pb pollution and its sources and origins in Antarctica, Pb and Ba concentrations and Pb isotopic compositions were determined in a continuous series of 40 snow samples from a 2-m deep snow pit, covering 4 full years from 2011/12 summer to 2015/16 summer, at the Hercules Névé plateau in Victoria Land, Antarctica. The results show that more than 90% of the atmospheric Pb deposited in Victoria Land was of noncrustal origin. This result implies the persistence of a significant human impact on the atmospheric cycle of Pb in the most remote places on Earth, despite a substantial reduction in anthropogenic Pb emissions in the Southern Hemisphere during recent years. The Pb isotopic fingerprints indicate that South America, particularly Brazil and Chile, has become a major source of anthropogenic Pb reaching Victoria Land. Our data highlight the need for both national and international measures to further reduce Pb emissions.
Export citation and abstract BibTeX RIS

Original content from this work may be used under the terms of the Creative Commons Attribution 4.0 licence. Any further distribution of this work must maintain attribution to the author(s) and the title of the work, journal citation and DOI.
1. Introduction
Lead (Pb) is one of the most problematic and toxic heavy metals, can affect many human organs and can be released into the environment through human activities such as mining, smelting, and manufacturing processes (Needleman 2004, Rauch and Pacyna 2009, Csavina et al 2012, Klochko 2016, Rahman and Singh 2019). The widespread use of Pb has released large amounts of Pb into the atmosphere. In particular, after the Second World War, Pb emissions rapidly increased due to the massive use of Pb alkyl additives in gasoline (hereafter referred to as leaded gasoline), reached a peak between the late 1960s and the early 1970s in the United States, and accounted for approximately two-thirds of global Pb emissions during the same period (Nriagu 1990). Since the 1970s, Pb pollution has declined in most of the world following the phase-out of leaded gasoline and implementation of strict emission standards in Renberg et al (2001).
Fine particulate Pb pollutants can be transported over long distances through the atmosphere, even reaching Antarctica, which is the most remote area on Earth, and Antarctic surface snow responds to the changing deposition of anthropogenic Pb. Thus, Antarctic snow layers provide records of past changes in Pb deposition, which helps us understand the global nature of atmospheric Pb pollution and recent changes in response to efforts to reduce Pb emissions (Wolff and Suttie 1994, Barbante et al 1997, 1998, Planchon et al 2002, Chang et al 2016). A few reliable records have demonstrated that peak Pb pollution in Antarctica occurred in the 1970s and 1980s with a small time difference between the regions; the late 1970s–1980s in the Atlantic sector of Antarctica (Coats Land) (Wolff and Suttie 1994, Planchon et al 2003), the late 1980s in the Pacific sector (Victoria Land) (Barbante et al 1997, 1998, Van de Velde et al 2005), and the 1960s–1980s in the Indian sector (Law Dome) (Vallelonga et al 2002, Van de Velde et al 2005) (figure S1 available online at stacks.iop.org/ERC/4/055006/mmedia). This result reflects the difference in relative contributions of different source regions to Pb pollution in Antarctica.
During recent decades, Pb isotope systematics have been widely used to characterize the geographical features of the potential source regions that affect the trend and extent of anthropogenic Pb accumulation in Antarctica (Rosman et al 1994, Rosman et al 1998, Planchon et al 2003, Van de Velde et al 2005, Mcconnell et al 2014, Chang et al 2016, Bertinetti et al 2020). These studies generally linked substantial changes in relative contributions from two major source regions, South America and Australia to sampling locations near each source region. For example, the dominance of South American contributions persisted in Coats Land and the central East Antarctic Plateau (Dome Fuji and Dome A) (Planchon et al 2003), while Australian sources dominated Pb inputs to Victoria Land, Law Dome, and Dome C, which is an inland site facing the Indian Ocean (Vallelonga et al 2002, Van de Velde et al 2005, Bertinetti et al 2020). However, a composite Pb isotopic record from an extensive array of 16 ice cores across Antarctica suggested that Australia was consistently responsible for the inputs of anthropogenic Pb over Antarctica (Mcconnell et al 2014).
Considering the aforementioned features, the source apportionment of Pb is very important for understanding the underlying transport mechanisms and relative contributions of different sources and source regions to the anthropogenic Pb input in Antarctica at different temporal and spatial scales. However, the investigation of such changes has proven to be very difficult because Pb concentrations in Antarctic snow are extremely low at the picogram per gram level (1 pg g–1 = 10–12 g g–1) (Wolff and Suttie 1994, Barbante et al 1997, 1998, Planchon et al 2002, Chang et al 2016). Herein, we present a new record of the atmospheric fallout of Pb and its isotopic signatures from a 2-m snow pit, which covered4 full years from 2011/12 summer to 2015/16 summer, at the Hercules Névé Plateau in Victoria Land, Antarctica. The main objective was to evaluate the atmospheric Pb level in recent Victoria Land snow and identify the sources and origins of Pb in this region between the Pacific and Indian Oceans (figure S1).
2. Materials and methods
2.1. Sampling
During the 2015–2016 Korean Antarctic Expedition, a snow pit was dug in the Hercules Névé (73° 03'10.57'' S, 165°24'38.72'' E, 2864 m above sea level) in Victoria Land (figure S1). A continuous series of 40 samples was obtained at 5 cm from a 2-m-deep shallow pit by horizontally pushing an ultraclean cylindrical Teflon container (5 cm in diameter and 35 cm in length). To prevent artificial contamination that may occur during the collection, handling, and storage of samples, only acid-cleaned sampling tools and clean protocols were used as described in detail by Hong et al (2000).
2.2. Chronology
The dating of snow uses changes in the stable isotopes of water (δ18O and δD) and major ions that show distinct seasonal changes (Legrand and Mayewski 1997). The values of δ18O and δD primarily depend on the mean air temperature at the snow deposition site with more enriched values in summer (Dansgaard 1964). Methanesulfonic acid (MSA) is the only sulfur compound of biological origin produced from dimethyl sulfide (DMS) emitted by ocean plankton through oxidation and is used as a proxy for summer snowfall, as it shows a marked increase in Antarctic snow (Minikin et al 1998). Following previous work on the Styx glacier in Victoria Land, Ca2+ in the samples accounts for more than 75%, mainly from crustal dust, which implies that Ca2+ can be used as a crustal dust proxy (Kwak et al 2015).
The δ18O and δD isotope compositions of melted snow were measured with an L2140-i isotopic water analyzer (Picarro, Inc.) using wavelength-scanned cavity ring-down spectroscopy (WS-CRDS). The measured ratios were calibrated using measurements of three reference materials from the International Atomic Energy Agency (VSMOW2, GISP, and SLAP2), and the precisions were 0.04‰ and 0.1‰ for δ18O and δD, respectively. The methanesulfonate (CH3SO3 -; hereafter referred to as MS-) and Ca2+ concentrations were obtained using a two-channeled ion chromatography (IC) system with a Dionex ICS-2000 and ICS-2100 (Thermo Fisher Scientific) in a class-1000 laboratory with class-10 laminar flow benches at the Korea Polar Research Institute (KOPRI). An ICS-2000 with an IonPac AS15 (2 × 250 mm) analytical column was used for MS-, and an ICS-2100 with an IonPac CS12A (2 × 250 mm) analytical column was used for Ca2+. The calibration curve was obtained by diluting stock solutions from Thermo Fisher Scientific (P/N 046070 for cations and P/N 057590 for anions) except for MS−. MS− was diluted from a stock solution (∼1000 μg g−1) prepared with CH3SO3Na (Sigma-Aldrich, USA). The accuracy of the analysis for anions and cations was ∼1.3–5.6 and ∼4.5%–12%, respectively (Hong et al 2012). The age of the top depth sample was set to the austral summer of 2015 when snow pit sampling was performed. The depth with minimal water isotopes was set to winter, and the depth with maximal water isotopes was set to summer. The MS− peak was confirmed in summer, and a Ca2+ peak was confirmed in spring (figure 1). Considering the stratigraphic patterns of water isotopic and ionic variations, dating from the surface to a depth of 2 m was estimated to span 4 full years from 2011/12 summer to 2015/16 summer.

Figure 1. Vertical profiles of stable isotopes (a) δ18O, (b) δD, and (c) deuterium excess (DE) and concentration profiles of (d) MS− and (e) Ca2+. Gray bars and dark gray bars represent the summer and winter seasons, respectively.
Download figure:
Standard image High-resolution image2.3. Lead and barium concentrations and Pb isotopes
Sample handling and ultraclean procedures were performed in clean laboratories at KOPRI. Subsequent cleaning of the labware was conducted in a class-10 laminar airflow booth in a class-1000 clean room. Analytical procedures were performed on a class-10 bench in a class-100 clean room (Han et al 2015).
The Pb and Ba concentrations were analyzed using an Element2 inductively coupled plasma sector field mass spectrometer (ICP-SFMS, Thermo Fisher Scientific) coupled with an APEX desolvating nebulizer system (APEX-HF, ESI). The detection limits were 0.139 pg Pb g−1 and 0.028 pg Ba g−1, which were defined as three times the standard deviation of the blank. The differences between certified and measured concentrations of SLRS6 reference water (National Research Council of Canada) were better than 10% for Pb and Ba.
For Pb isotopes, ∼10 g of the sample was evaporated to dryness with a mixture of 10 μl of 65% HNO3 (Fisher 'Optima' ultrapure grade), 20 μl of 48% HF (Merck 'Ultrapur' grade) and 4 μl of diluted H3PO4 (Merck 'Suprapur' grade; ∼5% by weight) on a Teflon-coated hot plate at ∼80 °C. Then, evaporated residue was transferred in a droplet of a PL-7 silica gel to a degassed (4 A, 30 min) zone-refined rhenium filament (99.999% Re, 0.7 mm wide, 0.04 mm thick, H. Cross Company) and dried by passing an electric current through the filament. Pb isotope analyses were performed at KOPRI using TRITON thermal ionization mass spectrometry (TIMS, Thermo Fisher Scientific). All reported values of 206Pb/207Pb were corrected for the natural and analytical stable isotope fractionation to 206Pb/207Pb = 1.093, which is the value of the common Pb isotope standard NIST SRM 981. The measurements were precise to 0.003 at the 95% confidence level. Detailed analytical procedures for Pb isotope measurements have been described by Han et al (2015).
3. Results
3.1. Lead and barium concentrations
Figure 2 shows the Pb and Ba concentrations and Pb isotope ratios from the Hercules Névé snow pit samples. The mean concentrations (± s.d.) of Pb and Ba were 6.2 ± 5.5 pg Pb g−1 and 8.5 ± 16 pg Ba g−1, respectively (table 1). Ba has been considered a proxy for dust input and enables the determination of crustal Pb contributions (Rosman et al 1998). We observed that the maximum Ba concentration (99 pg g−1) was at a depth of 100 cm and was approximately 12 times higher than the average Ba concentration. The Ba concentrations were approximately two times lower (average of 4.0 pg g−1 and range between 0.46 and 12 pg g−1) at depths greater than 100 cm than at depths (average: 8.4 pg g−1; range: 0.64–34 pg g−1) below 100 cm. This situation reflects the strong seasonal and interannual variations in dust inputs. Pb concentrations mostly originated from natural sources, such as crustal dust and volcanic activity found in the preindustrial Victoria Land ice, representing the time period from near the last glacial maximum (∼27,000 years BP) to the late Holocene (∼1,300 years BP) (Matsumoto and Hinkley 2001, Hinkley 2007). The natural background levels of Pb and Ba concentrations in Victoria Land from three Taylor Dome ice samples were determined to be 5.5 pg g−1 and 11 pg g−1 on average, respectively (Matsumoto and Hinkley 2001). The natural Pb concentration was slightly lower than that reported here for Victoria Land, while the natural Ba concentration was slightly higher.
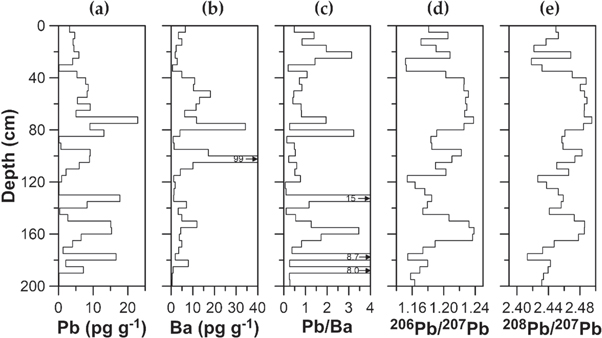
Figure 2. Variations in concentrations of (a) Pb and (b) Ba, (c) Pb/Ba ratios, (d) 206Pb/207Pb and (e) 208Pb/207Pb isotope ratios from the Hercules Névé snow pit samples.
Download figure:
Standard image High-resolution imageTable 1. Mean Pb and Ba concentrations and Pb isotopes in Hercules Névé snow pit samples and selected samples from Taylor Dome and EPICA Dome C ice for the natural background of Victoria Land and central East Antarctica. Selected Styx ice for preindustrial values in Victoria Land. Previous data obtained at Dome C snow for the same investigated time period are also shown.
| Concentration (pg g−1) | ||||||||
|---|---|---|---|---|---|---|---|---|
| Site | Age | Number of samples | Pb | Ba | 206Pb/207Pb | 208Pb/207Pb | Reference | |
| Hercules Névé | AD 2012–2015 | 40 | Mean ± s.d. (min - max) | 6.2 ±.5.5 (0–23) | 8.5 ±.16 (0.46–99) | 1.1953 ±.0.0277 (1.1515–1.2386) | 2.4582 ±.0.0230 (2.4132–2.4951) | This work |
| Taylor Dome | 2200–7000 years BP | 3 | Mean ± s.d. (min - max) | 5.5 ±.3.0 (3.3–8.9) | 11 ± 12.3 (8.1–12) | 1.2319 ±.0.0099 (1.2208–1.2400) | 2.4818 ±.0.0101 (2.4702–2.4882) | Matsumoto and Hinkley 2001 |
| EPICA Dome C | 6939–6951 years BP | 2 | Mean ± s.d. (min - max) | 0.22 ±.0.002 (0.216–0.219 | 6.8 ±.0.71 (6.3–7.3) | 1.1962 ±.0.0013 (1.1952–1.1971) | 2.4731 ±.0.0083 (2.4672–2.4789) | Vallelonga et al 2010 |
| Styx | AD 1872–1882 | 3 | Mean ± s.d. (min - max) | 2.2 ± 1.0 (1.3–3.2) | 17 ± 12 (6.9–30) | 1.2373 ± 0.0015 (1.1360–1.2390) | 2.4983 ± 0.0104 (2.4900–2.5100) | Van de Velde et al 2005 |
| Dome C snow | AD 2012–2015 | 9 | Mean ± s.d. (min - max) | 5.9 ± 8.1 (2.1–27) | — | 1.1672 ±.0.0163 (1.1350–1.1810) | 2.4293 ±.0.0171 (2.3910–2.4440) | Bertinetti et al 2020 |
3.2. Pb/Ba ratios
The natural background Pb/Ba ratio of the EPICA Dome C ice in the early Holocene was 0.032. This value is similar to the upper continental crust value, which implies that most of the Pb was introduced from rock and soil dust (McLennan 2001). In contrast, the Pb/Ba ratio of Taylor Dome ice in Victoria Land was ∼0.5 due to additional Pb inputs, which probably originated from volcanic emissions (Matsumoto and Hinkley 2001). Figure 2(c) shows the variations in the Pb/Ba ratio from the Hercules Névé snow pit samples with depth. The average Pb/Ba ratio of all 40 samples was 1.6, approximately three times higher than the reported value of Victoria Land for the Taylor Dome. Not one of the samples from the 1980s–1990s in Victoria Land was reported to have a Pb/Ba ratio of 3 or more (Van de Velde et al 2005). Among the Hercules Névé snow pit samples, six samples with a Pb/Ba ratio of 3 or more had top depths of 25, 85, 135, 160, 180, and 190 cm. Of these samples, the three taken from depths of 25, 85, and 160 cm, which show more radiogenic Pb isotope ratios, are considered to be influenced by volcanic inputs. The remaining three samples (from depths of 135, 180, and 190 cm) show Pb/Ba values higher than 8, which are thought to reflect contamination from Chilean Cu smelting (135 and 190 cm) and Australia (160 cm) based on source tracing using Pb isotope ratios (see next section). Except for the three samples with relatively high Pb/Ba values of 8 or higher, which were influenced by anthropogenic Pb, the average Pb/Ba value of the remaining samples was approximately 0.9, similar to those of the 1980s (∼1.1) and 1990s (∼0.85) in Styx ice (Van de Velde et al 2005).
3.3. Lead isotopes
The 206Pb/207Pb and 208Pb/207Pb ratios were 1.1515–1.2386 (mean value 1.1953) and 2.4132–2.4951 (mean value 2.4582), respectively. The Holocene background values of 206Pb/207Pb and 208Pb/207Pb were 1.2319 and 2.4818 in Taylor Dome ice, respectively (table 1). Although not of Holocene age, the oldest three Styx ice samples corresponding to the preindustrial period and one Taylor Dome ice sample dated to 1300 years BP had 206Pb/207Pb values of 1.23–1.24, which indicated the natural background level of the early Holocene and preindustrial periods (table 1) (Van de Velde et al 2005).
The bottom of the Hercules Névé snow pit is considered to represent early 2012 with a 206Pb/207Pb value of approximately 1.16 (figure 2(d)). The first 206Pb/207Pb increase was observed at 150–165 cm, where the Pb isotope ratios were high (approaching 1.24). The ratios then declined until mid-2013 (depth of 120 cm), when they reached their lowest value at a depth of 120 cm. Until early and mid-2014 (depth of 80 cm), the 206Pb/207Pb values were approximately 1.18–1.21. The depths between 40 and 80 cm correspond to early to late 2014 and show radiogenic values overall (mean 206Pb/207Pb and 208Pb/207Pb are 1.2288 and 2.4867, respectively). Radiogenic characteristics can be considered to reflect volcanic Pb from Antarctic and ocean island volcanoes (Hinkley 2007). Sample depths of 25–35 cm showed the lowest values in the entire section. After mid-2015 (depths between 0 and 25 cm), 206Pb/207Pb was distributed over a wide range of 1.17–1.21.
4. Discussion
4.1. Comparison of reported data with previous Antarctic research
The concentration level of Pb in the Hercules Névé snow pit sample (6.2 ± 5.5 pg g−1) is much higher than that of the Holocene background at Dome C (0.22 pg g−1) and is similar to that of the Taylor Dome (5.5 pg g−1) (table 1). Meanwhile, the averaged Ba concentration (8.3 pg g−1) of the Hercules Névé snow is slightly lower than the value of 11 pg g−1 for the Holocene background of Ba in Victoria Land (Matsumoto and Hinkley 2001). In other words, the mineral dust input is less than before, while the Pb input is increased. An earlier study of natural Pb inputs in Hercules Névé snow indicated that noncrustal Pb accounted for at least 2/3 of the total natural Pb deposited in Victoria Land, while crustal Pb sources likely contributed less than 1/3 of the total natural Pb (Barbante et al 1997). The noncrustal Pb of Hercules Névé snow pit samples was calculated using elemental proportions of the upper continental crust (McLennan 2001), which was 56%–100% (mean = 92%). Noncrustal Pb includes Pb from volcanic activity, sea salt spray and anthropogenic sources, and the proportion of anthropogenic Pb can be expected to increase significantly (Wolff and Suttie 1994, Barbante et al 1998). The Hercules Névé snow pit samples had Pb concentrations similar to those of Dome C snow (5.9 ± 8.1 pg g−1) during the same period (Bertinetti et al 2020) (table 1). However, the Pb isotope ratios show considerably different indicating that Pb comes from different sources.
Figure 3 shows the Pb isotope compositions of Hercules Névé snow, previously reported Antarctic snow samples from various locations, Patagonian dust, potential source area samples from the Southern Hemisphere, and Mt. Erebus lavas. The locations of the sampling sites of Antarctic snow samples and potential source regions are provided in figure S1. Pb isotope compositions in Hercules Névé snow pit samples are consistent with the major mixing line of Antarctic snow with a radiogenic endmember that has 206Pb/207Pb of 1.25–1.30 and 208Pb/207Pb of 2.50–2.55 and a less radiogenic endmember that has 206Pb/207Pb of ∼1.10 and 208Pb/207Pb of ∼2.38. Some samples from Victoria Land show much higher Pb isotope values than others (figure 3). This contrast appears to be related to the amount of volcanic Pb input in Antarctica, according to the differences in distance and elevation from volcanoes (Zreda-Gostynska et al 1997).

Figure 3. Lead isotope compositions in Hercules Névé snow from AD 2012 to 2015 with various reference data. Hercules Névé snow (this work and (Van de Velde et al 2005)), Styx ice (Van de Velde et al 2005), Dome Fuji and Dome A (Chang et al 2016), Dome C (Bertinetti et al 2020), Mt. Erebus lavas (Sun and Hanson 1975) and Patagonian dust and soil (Gili et al 2016, Khondoker et al 2018). Various aerosols and lichens from Australia (Kristensen et al 2016, Wu et al 2016), Brazil (Gemeiner et al 2017, Souto-Oliveira et al 2018), South Africa (Khondoker et al 2018), and Chilean copper smelters (Puig 1988). Pb ores from Broken Hill (Cooper et al 1969), Mississippi Valley (Doe 1970), and Peruvian/Mexican ores (Chow et al 1975).
Download figure:
Standard image High-resolution imageThe 206Pb/207Pb ratios of the Hercules Névé snow data for 2012–2015 show more radiogenic values than the Hercules Névé snow data dated 1986–1994 (figure 3). The 206Pb/207Pb ratios of Hercules Névé snow data for 1986–1994 were relatively less radiogenic, which indicates the predominant use of alkyl-lead additives manufactured from the less radiogenic Australian type Pb (Broken Hill) in Argentina and Chile. In Argentina and Chile, the use of Pb additives in gasoline was completely phased out in 1997 and 2001, respectively (Tchernitchin et al 2006, Oudijk 2010). In contrast, leaded gasoline in Brazil was characterized by a relatively high 206Pb/207Pb ratio because of its primary use of Mississippi Valley type Pb (Bollhöfer and Rosman 2000, Bollhöfer and Rosman 2002, Muñoz et al 2004, Geraldes et al 2015). Because the ban on leaded gasoline in Brazil started in 1975 and leaded gasoline was phased out in the 1980s, this relatively radiogenic signature of Hercules Névé snow dated 2009–2012 was presumably due to Pb emissions from industrial sources (Wolff and Suttie 1994, Paoliello and Capitani 2005). Our Hercules Névé snow data for 2012–2015 has illustrated that the source of anthropogenic Pb in Antarctica shifted from leaded gasoline to industrial activities in northern South America (figure 3).
4.2. Sources of anthropogenic Pb in Hercules Névé snow
Temporal changes in Pb isotopes in Antarctic snow samples from 1970 to 2000 have been characterized by the extensive release of anthropogenic Pb through the use of leaded gasoline (Rosman et al 1994, Wolff and Suttie 1994). After the ban on leaded gasoline in major countries of the Southern Hemisphere from New Zealand in 1996 to South Africa in 2006, the Pb concentrations in Antarctic snow decreased. Chilean copper smelter production was later identified as a major source of Pb pollution in Antarctica (Chang et al 2016). To trace the source region responsible for anthropogenic Pb reaching Victoria Land, we compared the isotopic data of the Hercules Névé snow samples spanning the period 2012–2015 with those of anthropogenic sources. Figure 3 shows the isotopic characteristics of a three-isotope plot (206Pb/207Pb versus 208Pb/207Pb) of the distinctive Pb isotope fingerprints of anthropogenic Pb in the Southern Hemisphere. At the peak of leaded gasoline use in Australia, Pb isotope ratios for environmental samples were less radiogenic 206Pb/207Pb of 1.060–1.072 and 2.339–2.346 of 208Pb/207Pb (Kristensen et al 2017). Australian sources became more radiogenic 206Pb/207Pb of 1.102–1.156 and 208Pb/207Pb of 2.368–2.456 following the ban on leaded gasoline in 2002 (Wu et al 2016, Kristensen et al 2016). However, they were lower than those from other potential source regions. Australian sources retained the second lowest isotope values after South Africa (1.069 ∼ 1.116 for 206Pb/207Pb and 2.342 ∼ 2.447 for 208Pb/207Pb) among other anthropogenic sources (Khondoker et al 2018). In contrast, Pb isotope ratios were higher (1.119 ∼ 1.189 for 206Pb/207Pb and 2.395 ∼ 2.455 for 208Pb/207Pb) in South America (Brazil, Argentina, and Chile) (Puig 1988, Khondoker et al 2018). As shown in figure 3, the isotopic compositions of the snow samples were closer to those of aerosol Pb isotopes from Brazil and Chile. This result indicates that the main sources of anthropogenic Pb in the Hercules Névé snow were anthropogenic emissions in Brazil and Chile. In our four samples with the lowest Pb isotope ratios, those from depths of 25–35 cm, 115–120 cm, and 175–180 cm correspond to mid-2015, mid-2013, and mid-2012, respectively, and a value of 206Pb/207Pb intermittently shows a less radiogenic value near 1.15, which indicates contamination from Australia.
In addition to the combustion of leaded gasoline, the largest source of Pb emissions to the atmosphere was pyrometallurgical nonferrous metal (Pb, Cu, Ni, Zn, and Cd) production (Nriagu and Pacyna 1988, Pacyna and Pacyna 2001). Accordingly, the amounts of atmospheric emissions of Pb from these sources in the Southern Hemisphere were estimated by combining mining and production data from the World Mineral Statistics of the British Geological Survey and emission factors (Nriagu and Pacyna 1988). Figure 4 shows the estimated Pb emissions from nonferrous metal production in major countries in the Southern Hemisphere. Starting in the 1970s, the estimated Pb emissions from metal production began to steadily increase peaking in 2005, maintaining high values until 2010, and subsequently decreasing. The contribution of Cu production in Chile to the total Pb emissions increased from 20% in 1980 to ∼90% in the mid-2000s. The Dome Fuji and Dome A snow pit data showed that more than 90% of the Pb deposited in the central EAP in the mid-2000s remained of anthropogenic origin (Chang et al 2016). The Pb isotope ratios of central EAP snow in the 2000s became more radiogenic because of the dominance of Pb from Chilean Cu smelters. Interestingly, the average apportionment of noncrustal Pb in the Hercules Névé snow samples between 2012 and 2015 was 92%, while Pb emissions decreased by approximately 5%–7% from 2005 to 2010, similar to the emissions in the early 2000s (figure 4). Given their limitations, our data did not confirm a reduction in Pb pollution in Antarctica, despite continued efforts to reduce Pb pollutant emissions in the Southern Hemisphere.

Figure 4. Estimates of annual Pb emissions from nonferrous metal (Pb, Cu, Ni, Zn, and Cd) production in Southern Hemisphere countries: (a) in tons; (b) relative proportion (%). Emission estimates are based on the metal production rates from the British Geological Survey's World Mineral Statistics and the emission factors (Nriagu and Pacyna 1988). Metal production includes mining, smelter production, and refinery production of Cd, Cu, Pb, Ni and Zn.
Download figure:
Standard image High-resolution image
The possibility of Australia as a source region could not be ruled out because some Australian data overlapped with Brazilian sources. The amount of Pb emissions from Australian nonferrous metal production was the second highest after Chile (figure 4). In addition, previous studies at other sites in Antarctica, including Dome C, point to Australia as the main source of anthropogenic Pb in Antarctic snow (Mcconnell et al 2014, Bertinetti et al 2020). However, whether Australia, as the major source of anthropogenic Pb, strongly affected Victoria Land, Antarctica, has remained unclear because our Pb isotope data show more radiogenic values in Victoria Land snow than in Australia.
5. Conclusions
Our data show that more than 90% of the Pb deposited on Hercules Névé snow in Victoria Land in the first half of the 2010s was of noncrustal origin. Combining with previous data, it is evident that Pb pollution in Antarctica has not significantly decreased, despite continued international efforts to reduce Pb emissions in the Southern Hemisphere during the corresponding period. The Pb isotopic fingerprints indicate that South America, particularly Brazil and Chile, has become a major source of anthropogenic Pb in Hercules Névé snow. Our observations highlight the need for further investigation into the effect of the subsequent reduction in Pb emissions from South America on Pb pollution across Antarctica.
Acknowledgments
This research was supported by a research grant (PE21100) from the Korea Polar Research Institute (KOPRI). This work was also supported by the Basic Science Research Program through the National Research Foundation of Korea (NRF) funded by the Ministry of Education, Science and Technology (NRF-2018R1A2B2006489).
Data availability statement
All data that support the findings of this study are included within the article (and any supplementary files).
Conflict of interest
The authors declare that the research was conducted in the absence of any commercial or financial relationships that could be construed as a potential conflict of interest.
Author contributions
Changhee Han: Formal analysis, data curation, methodology, visualization, and writing—original draft. Songyi Kim: Formal analysis, writing—review and editing. Ah-hyung Lee: Formal analysis, writing—review and editing. Yeongcheol Han: Data curation, writing—review and editing. Seungmi Lee: Formal analysis, writing—review and editing. Chaewon Chang: Formal analysis, writing—review and editing. Sungmin Hong: Conceptualization, methodology, writing—review and editing. Hyejin Jung: Formal analysis, writing—review and editing. Sang-bum Hong: Formal analysis, writing—review and editing. Jeonghoon Lee: Writing—review and editing. Soon Do Hur: Project administration, supervision, conceptualization, investigation, writing—review and editing.