

Abstract
The United Nations identifies ensuring 'access to affordable, reliable, sustainable and modern energy for all' as one of its Sustainable Development Goals for 2030. This article focuses on the comparatively under-investigated question of reliability within the broader goal. We empirically study experienced household electricity reliability using common frameworks in key countries such as Tanzania, Kenya, and India. Datasets represent a diverse set of technologies including solar home systems (SHS), solar pico-grids, and national electricity grids. First, the prevailing reliability metrics—SAIDI and SAIFI—are measured for all datasets. Informed by critical assessments, this article then proposes a suite of new metrics that facilitate improved reliability comparisons by considering the reasons, timing, and fairness of outage distribution. Analyses using our proposed metrics reveal key policy implications for addressing energy poverty in the Global South. Acknowledging that the systems studied provide different capacity, affordability, and carbon footprints, we find that on average, SHS provided comparable hours of lighting to local grid connections, however SHS outages were less equally distributed than those from other sources. In addition, calculations of grid reliability were highly sensitive to measurement techniques and assumptions used, necessitating high resolution data for policy decisions. Finally, economically driven outages conspicuous in pre-paid SHS systems (i.e., disconnections for non-payment) composed a significant portion of experienced unreliability. These findings quantify the important contribution of demand-side affordability to experienced household reliability, thereby allowing for a comprehensive understanding of the reliability of SDG 7.
Export citation and abstract BibTeX RIS

Original content from this work may be used under the terms of the Creative Commons Attribution 4.0 licence. Any further distribution of this work must maintain attribution to the author(s) and the title of the work, journal citation and DOI.
1. Introduction
Access to modern energy services underpins progress in all areas of development including economic growth, education, public safety, gender equity, and access to water and health services (Sovacool 2012, SDG 7 Technical Advisory Group 2021). Therefore, the United Nations (UN) included a goal of ensuring 'access to affordable, reliable, sustainable, and modern energy 4 for all' in its 2030 Agenda for Sustainable Development, aka SDG 7 (UN General Assembly 2015). The World Bank (WB) stated that with 11 years left to achieve the goal, 759 million people lacked electricity access, indicating the magnitude of SDG 7's ambition (World Bank 2021). 76% of that unelectrified population lived in twenty developing 5 countries in Sub-Saharan Africa (SSA) or South Asia. The COVID-19 crisis has further challenged electrification efforts, even reversing progress in several SSA countries. 'At today's rate of progress, the world is not on track to achieve SDG 7' (World Bank 2021). Therefore all electricity access options must be considered.
Alstone et al presented a framework that conceptualizes the options for gaining electricity access as a continuum of solutions ranging from personal 'nano' grids to solar-home-systems (SHS), to minigrids, to utility-scale systems (Alstone et al 2015). The International Energy Agency (IEA) reports that 'decentralized solutions are the least-cost way to provide power to more than half of the population gaining access by 2030' (IEA 2022). As of December 2018, 108 million people globally were living in a household with improved energy access through decentralized solar systems (GOGLA 2019). Rather than a universally appropriate approach (Bhattacharyya and Palit 2021), decentralized systems have a substantial role in energy access efforts alongside grid extension, particularly in the short term and in rural areas (Carvallo et al 2019). In their rise, decentralized systems challenge prior assumptions about energy systems and techniques used to measure them.
Several organizations have since put forward frameworks to define energy access beyond just the number of connections 6 . Starting in 2010, Practical Action's Poor People's Energy Outlook series presents an Energy Access Index that sets minimum standards and distinguishes levels of access in terms of household fuels, electricity, and mechanical power (Practical Action 2014). The most common framework is ESMAP's (The World Bank's Energy Sector Management Assistance Program) Multi-tier Framework (MTF) (Bhatia and Angelou 2015). It states: 'To be meaningful for households, productive enterprises and community facilities, the energy supply supporting that access must have a number of attributes: it must be adequate in quantity, available when needed, of good quality, reliable, convenient, affordable, legal, healthy, and safe.' Their 'tiers of access' framework recognizes that not all modes of access are equivalent, partitioning tiers—which rank from 0 (lack of electricity in any meaningful form) to 5 (aspirational goal for access)—based on attribute thresholds.
While reliability is included in the text of both the Sustainable Development Goal and ESMAP's MTF, it is understudied in comparison to wealth of research on energy access overall. Additionally, literature highlights the insufficiency of the prevailing methods for comparing reliability. Several authors have discussed the arbirarity of MTF tier thresholds, applying to only two of the six tiers of access (Aklin et al 2016, Groh et al 2016, Ayaburi et al 2020). Jacome et al focuses on the dearth of information about reliability experienced by households (Jacome et al 2019).
To fill these key knowledge gaps, this research provides an empirical comparison of household electricity reliability across the continuum of energy access solutions. We first measure the reliability of SHS, solar pico-grids (SPG), and national electricity grids using primary and secondary data from three key energy access countries: Tanzania, Kenya, and India. We then critically assess the prevailing reliability metrics (SAIDI and SAIFI) and introduce a suite of new metrics that examine the reasons, timing, and fairness of outage distribution. Analyses using our proposed metrics inform four key policy implications for addressing energy poverty in the Global South:
- 1.Studies that evaluate the impacts of unreliability need high temporal and spatial resolution data directly measured on the communities of interest.
- 2.For household electricity access in particular, the existing reliability metrics (SAIDI, SAIFI, Multi-Tier Framework) are insufficient for informing SDG 7 policy decisions.
- 3.The affordability of energy access solutions is already becoming as important as access to the solutions.
- 4.Fairness and inequality must be at the forefront of efforts to improve the service quality of electricity solutions in Sub- Saharan Africa.
2. Context and gaps
Most energy access literature that references reliability and decentralized systems identifies the opportunities for decentralized renewable energy (DRE) systems to provide improved reliability in the context of non-existent or unreliable centralized power grids at similar or lower costs (Lahimer et al 2013, Lee and Callaway 2018, Mandelli et al 2016, Numminen and Lund 2019, Utilities 2.0 2019, World Bank 2017). However, several authors such as Numminen and Lund (2019), Wolfram (2016), Barman et al (2017), and Yaqoot et al (2016) reveal concerns about the level of service and reliability of DRE systems in practice, particularly through narratives of unreliable SHS. Their concerns can be partially attributed to the poor quality of the first products to enter these markets, as well as counterfeit products, (GOGLA 2019, Saini et al 2019) but there remains a troubling lack of quantification of the reliability and service quality of DRE writ large.
An absence of transparency, standards, and reporting persists across the off-grid solar sector (Practical Action 2014, Yaqoot et al 2016) despite efforts such as Lighting Global's solar product verification program, 'resulting in huge discrepancies in reported metrics and mistrust among stakeholders' (Lee et al 2019). 'Technical reliability studies are rare ... even though service quality analyses would be important to help in capturing the full potential of these systems in the future' (Numminen and Lund 2019). Even for many utility grids in developing countries, there is almost no data on electricity reliability for even the most basic patterns of outages (Lee et al 2017) and public information is rarely available (Klugman et al 2014, Mann et al 2016). This dearth of data severely limits our ability to measure the reliability of electricity access in efforts to achieve SDG 7.
Prior economics literature evidences the severe negative impacts of electricity unreliability using a diverse set of approaches (Gertler et al 2017). Research ranges from the impact on gross-domestic product (Andersen and Dalgaard 2013), to businesses and industry (Moyo 2013, World Bank 2017), household incomes (Chakravorty et al 2014), and health (Adair-Rohani et al 2013, Burlando 2014). Literature on the willingness to pay for increased reliability, even in financially constrained environments, quantifies the value that households and businesses place on reliability (Graber et al 2018, Amoah et al 2019, Jacome et al 2019, Zemo et al 2019). With such large potential impacts on energy poverty, it is vital that reliability is measured and evaluated accordingly.
The prevailing methods of measuring distribution grid reliability, SAIDI (System Average Interruption Duration Index) and SAIFI (System Average Interruption Frequency Index) detailed in section 3.1, are not without their own critiques. Nateghi et al (2016) critiques how reliability standards and metrics in the United States insufficiently internalize the impacts and risk of large exogeneous disturbances such as natural disasters. Heylen et al 2019 article critiques the lack of quantifying fairness in the context of power system reliability and proposes both variance-based and Gini-based metrics from which our proposed fairness and inequality metrics in section 4.2.3 build. These critiques, however, still fail to evaluate the usefulness of the prevailing methods when applied on energy systems in developing countries, or on decentralized systems. Harish et al (2014) notes that the prevailing methods have the potential to misrepresent experience unreliability qualitatively, especially at the magnitude common to most developing countries. These metrics need to be more 'informed by an understanding of the context and the impacts on populations rather than merely number of hours of outages' (Tait 2017). Reliability, as a popular concept, includes many facets and is difficult to quantify and measure especially at the household level (Tait 2017, Taneja 2017). However, it is vital that the metrics used can sufficiently describe houseold reliability patterns and inequities, particularly for applied research and policy.
Therefore, this research uniquely fills the following literature gaps. While SHS are an increasingly large contributor to global electricity access, there have been no systematic evaluations of measured experienced reliability for households with SHS in Africa prior to this article. In fact, there are no empirical comparisons of reliability patterns across electricity access options whether decentralized or centralized (Tait 2017, Numminen et al 2018, Numminen and Lund 2019). Additionally, the standard reliability metrics designed for advanced power systems face challenges when applied to underdeveloped, unreliable grids and decentralized systems providing electricity access. By documenting and surmounting these challenges with validated, transparent, and systematic methods, this research demonstrates significant advantages over other existing literature on electricity reliability in the global south.
This article presents several novel and insightful contributions. First, it quantitatively compares customers' experienced reliability across different technologies using a common framework, including a detailed evaluation of experienced SHS reliability. We find that, on average, SHS in our data sets provided comparable outage frequencies to their local grids, but the distribution was less equal than for other sources. Second, it shows that the geographic scope, temporal granularity, and level of the electricity grid strongly impact the size and variability of grid reliability measurements. This variation in measured reliability indicates that assessments of the fairness of access require relatively high spatial and temporal resolution. Finally, it proposes new reliability metrics that evaluate three key overlooked factors: outage cause, timing, and the fairness of outage distribution. We show that, after categorizing SHS outages by their cause (solar resource availability, failure to pay/economic, or technical failure), each category has strongly different patterns across space and time. This finding indicates that charting a path to improved reliability requires careful consideration of what characteristics of unreliability one wishes to address. For example, economic outages (loss of service due to failure to pay bills) are conspicuous drivers of pay-as-you-go (PAYGo, pre-pay) SHS customers' experienced reliability but are rarely considered in reliability metrics and broader reliability literature. Moreover, due to solar resource availability, SHS outage timing is strongly biased towards early evening relative to other modes of access. This suggests social impacts that fall on household activities such as evening chores and homework, and points toward a focus on improving system sizing rather than technical failure rates to manage reliability impacts for these customers.
The remainder of this article is organized as follows; section 3 describes our methods by reviewing and critiquing reliability metrics and introducing the data sources; section 4 analyzes the data using existing reliability indicators and proposes new metrics for evaluation; section 5 details policy implications for addressing energy poverty; section 6 notes limitations and opportunities for future work; and section 7 concludes this study.
3. Methods
To match this article's intentions of investigating the reliability of SDG 7 with the methods available, we define and advance the term 'experienced household reliability'. It is a composite concept consisting of supply and demand-side issues that both prevent households from turning on their lights and accessing the benefits of electricity. Rather than assessing bulk system reliability (generation-side on grids), experienced reliability aligns most closely with distribution-side grid reliability metrics representing the supply reliability of the electricity access solution. Our concept then adds demand-side components relevant to households' experiences of their electricity. Section 3.2.2's differentiation of the reasons for outages and their quantitative analysis in section 4.2.1 expand upon and justify this terminology. For if power technically available, but not accessible to households, the goals of SDG 7 will not truly be achieved.
3.1. Reviewing the methods used for measuring reliability in literature
The majority of existing reliability literature investigates issues in developed countries by evaluating bulk power system reliability trends over space and time (Eto et al 2012, Dunn et al 2019), predicting interruptions using maintenance or weather data (Larsen et al 2016), or evaluating the impact of renewables (Lin et al 2014). A more recent trend distinguishes resilience from reliability (Hossain et al 2021). Fewer studies empirically evaluate reliability on electricity grids or decentralized energy systems in developing countries, and no prior reviews of methods exist. In response, table 1 summarizes the academic literature that evaluates reliability in developing countries, highlighting the methods and metrics used. We used the following criterion for inclusion in this review: peer-reviewed journal articles or conference papers, published between 2010 and 2021, provided an empirical evaluation of reliability, and located in a developing country. This review primarily focuses on studies located in SSA and is only representative (not comprehensive) of the extensive literature located in India or literature that relies exclusively on surveyed reliability.
Table 1. Literature that empirically evaluates reliability in developing contexts uses diverse methods. Articles separated by the category and specific type of metric used, and whether the focus is on centralized or decentralized systems. Each article is denoted by its data collection method whether through interviews or surveys (S), physically measured (M), modelled or optimized (O), or measured using a proxy (P). The World Bank Surveys used later this article are included here as reference points. For similar literature that did not meet our inclusion criterion: Mandelli et al 2016 presents an exhaustive review of articles that optimize or simulate systems in these contexts and use reliability as a constraint rather than evaluating it empirically. Andersen and Dalgaard 2013 and Moyo 2013 include additional economic literature that uses survey and panel data to investigate the impact of unreliability on economic growth. See Jacome et al 2019 or Quetchenbach et al 2013 for literature on power quality issues in similar contexts. The ESMAP MTF's attributes would be considered to encompass the 'availability', 'hours at peak', and 'days with an outage' metrics.
| Category | Metric | Literature—Centralized Grid | Literature—Decentralized |
|---|---|---|---|
| Duration out | SAIDI | Ayaburi et al 2020—S, Klugman et al 2019—MS, Taneja 2017—SP, WB Doing Business Survey | |
| Hours out | Correa et al 2018b—M, Farquharson et al 2018—S, Moyo 2013—S, Niroomand and Jenkins 2020—S, WB Enterprise Survey | Moharil and Kulkarni 2010—O, Numminen and Lund 2019—S | |
| Duration on | Availability | Adair-Rohani et al 2013—S, Agrawal et al 2020—S, Aidoo and Briggs 2018—SP, Chakravorty et al 2014—S, Graber et al 2018—S, Harish et al 2014—O, Kennedy et al 2020—S, Murphy et al 2014—O, Pelz et al 2021—S, Sharma et al 2020—S, Thomas and Urpelainen 2018—S | Adair-Rohani et al 2013—S, Aklin et al 2021—S, Aklin et al 2016—S, Barman et al 2017—S, Numminen and Lund 2019—S, Numminen et al 2018—M, Graber et al 2018—S, Harish et al 2014—O, Murphy et al 2014—O, Sharma et al 2020—S |
| Hours at peak | Graber et al 2018—S, Sharma et al 2020—S | Graber et al 2018—S | |
| Frequency | SAIFI | Ayaburi et al 2020—S, Klugman et al 2019—MS, Taneja 2017—SP, WB Doing Business Survey | |
| Days with an outage | Mann et al 2016—P, Thomas and Urpelainen 2018—S | Aklin et al 2021—S, Aklin et al 2016—S, Numminen et al 2018—M | |
| Outage Rate | Andersen and Dalgaard 2013—S, Correa et al 2018a—M, Chakravorty et al 2014—S, Gertler et al 2017—M, Molebe et al 2018—M, Niroomand and Jenkins 2020—S, Taneja 2017—SP, WB Enterprise Survey | Murali et al 2015—S, Numminen et al 2018—M | |
| Demand | Peak deficit | Harish et al 2014—O | Harish et al 2014—O |
| Fraction or probability of serving demand | Kanase-Patil et al 2011—O, Lee et al 2014—O, Lee and Callaway 2018—O, Moharil and Kulkarni 2010—O |
Table 1 confirm's Kennedy et al's finding that most studies survey respondents for their perception of power availability (Kennedy et al 2020). Accurate values of reliability from individual recall are notoriously poor therefore limiting the insights available from survey-based studies (Kennedy et al 2020).
While table 1 shows a diversity of metrics used in academic literature, the global prevailing metrics are defined in the IEEE 1366 Guide for Electric Power Distribution Reliability Indices. These metrics represent the total duration (SAIDI, equation (1)) and frequency (SAIFI, equation (2)) of electricity interruptions normalized per customer over one year, where an interruption is a total loss of electrical power ignoring power quality issues (IEEE 1366 2012). See supplemental information (available online at stacks.iop.org/ERC/4/055001/mmedia) section 3 (SI.3-4) for detailed methods. Therefore, SAIDI can be interpreted as the total hours of outages experienced by an average customer in one year, and SAIFI as the total number of outages experienced by an average customer in one year. Their strength lies in their ability to compare the reliability of different sized electricity systems by normalizing by customers served.


The World Bank's Doing Business Survey has increased the prominence of SAIDI and SAIFI in the developing world. By rating and ranking countries around the world on the ease of doing business, the World Bank strongly influences global regulatory policies and investments (Doshi et al 2019). 'Getting Electricity' is a major rating topic, and it includes SAIDI and SAIFI as reported by local utilities.
3.2. Methods used for measuring reliability in this article
The following analysis uses data-intensive methods informed by related literature to measure and compare the reliability of experienced household electricity access using common frameworks.
3.2.1. SAIDI and SAIFI status quo comparison
There is a clear opportunity to document the reliability of decentralized systems alongside their local grids in peer-reviewed literature using the well-respected and widely used IEEE metrics. Table 1 finds no other articles that calculate SAIDI and SAIFI using the IEEE standard for decentralized systems using measured data, therefore further highlighting the unique contribution of this work. Therefore, our preliminary analysis of the reliability of household electricity access in Tanzania, Kenya, and India provides a status quo analysis and calculates SAIDI and SAIFI from empirical data using the validated IEEE 1366 modeling approach transparently detailed in SI.3. However, there are challenges in applying these standard metrics designed for large, grid-scale power systems in wealthier countries to smaller electricity systems (including decentralized systems) in developing countries. In addition, none of the metrics of which the authors are aware of consider the distributional effects, causes, or timing of outages motivating our proposed metrics in sections 3.2.2–4 and analysis in section 4. The remainder of this section summarizes how SAIDI and SAIFI are defined in the standard, indicating when their interpretation needs further refinement for energy systems in developing countries and for decentralized systems providing energy access.
First, since SAIDI and SAIFI were designed to represent the quality of a provider's normal operating service, their calculation in IEEE 1366 included a statistical method to distinguish and remove the effect of extreme events, or major event days (MED), that are out of the control of the provider. These include hurricanes, monsoons, and other large natural disasters (IEEE 1366 2012). We refer readers to Nateghi et al (2016) and their extensive investigation of the impact of MEDs on reliability metrics in the US. The proceeding analysis follows the industry standard of reporting values excluding MEDs to investigate operating reliability.
Second, these metrics were designed to measure the delivery of electricity to paying customers. If a household does not have the means to pay for electricity even temporarily, and is therefore disconnected for non-payment, they are no longer included in the customer base. These 'economic outages' are still impactful and should be considered in a rights-based assessment of reliability such as that implied by SDG 7. They exhibit the distinction between provided reliable electricity and experienced unreliable energy poverty. However, in the absence of comprehensive data on the total household experience, reported reliability is approximated by excluding times when electricity use was limited due to non-payment. The absence of economic outages is a critical flaw in econometric literature that uses the prevailing metrics on a national-annual basis to investigate the impact of reliability on household economic growth, income, health, and education.
The third issue addressed is the unit of analysis, which is set at the household and/or meter. The IEEE standard defines one residential electricity customer as one meter or household rather than one individual. This article follows the IEEE conventions but recognizes the limitations of using the household as the unit of analysis in light of research and field observations on inequitable intra-household access to electricity, particularly for women and children (Ghanadan 2004, Jacobson 2007, Klasen and Lahoti 2016).
Finally, in developing countries, the IEEE Standard may be less likely to be followed and automatic measurement is rare (Taneja 2017); data limitations are more severe, including measurement, collection, and storage; and the outage profiles of off-grid solar + storage systems can be more representative of usage data than performance data (Lee and Callaway 2018). In response to these challenges, this article uses transparent assumptions and standardized data management practices detailed in SI.3-4. Doing so provides a uniquely systematic analysis that uniformly evaluates the reliability of decentralized and centralized systems providing energy access in Tanzania, Kenya, and India.
3.2.2. Proposed metric 1
Reasons for the outage Compiling these unique data sources and comparing the reliability across different scaled energy systems fills a critical gap in our understanding of the reliability of SDG 7 in developing contexts. However, SAIDI and SAIFI values designed to measure grids alone fail to reflect many important aspects of households' experience of electricity reliability. The case of decentralized systems makes apparent the need to differentiate between outages caused by different reasons.
In SHS, the reasons for electricity outages are very discernible to users. Resource outages begin when the battery runs out for the night and are resolved when the battery is recharged by the solar panel in the morning. Extremely cloudy weather, such as during monsoon season, may extend the duration of these outages to several days. Technical outages often occur suddenly caused by a short-circuit, over-voltage event, attempt at manipulation, or another technical malfunction. Numminen and Lund (2019) additionally identified 'operational' outages where, for example, it takes several days for the correct personnel to arrive to the site to determine the technical outage reason, and more time for the correct part to be ordered and shipped to the rural energy system's location. Here, these are grouped into the duration of technical outages. Finally, we identify and introduce the concept of economic outages, occurring when a PAYGo customer runs out of credit and resolves when the customer tops-up thereby restoring power. As detailed earlier, economic outages are never included as part of reliability evaluations of systems but are a crucial aspect of evaluating the household experience of electricity reliability.
Table 2 expands the outage categorization of SHS into a generalizable framework for energy systems across the continuum of solutions. For example, hydropower curtailed because of a drought would be considered a resource outage. With the dominance of hydropower in African grids, it is likely that resource constraints will only become more pronounced with climate change. Similarly, load-shedding because of capacity constraints is also considered as resource-driven because it derives from an imbalance between supply and demand. Planned outages are resource-driven because they could be modified or shifted 7 .
Table 2. Outage categorization framework for systems providing energy access.
| Outage categorization examples | |||
|---|---|---|---|
| Examples across scale of systems | Resource (generation) generally avoidable or shiftable through planning | Technical (transmission, distribution) | Economic (billing) |
| Off-grid SHS with PAYGo financing | Battery capacity runs out for the night, able to charge via solar the following day | Fault, broken electrical component | PAYGo customer does not put in enough credit for 24/7 access |
| Off-grid, diesel minigrid with post-pay billing | Diesel fuel unavailable because of transport difficulties (war, natural disaster, road blockages). Load shedding during peak hours due to capacity constraints | Fault, broken electrical component | Post-pay customers have electricity service cut off because of past unpaid bills |
| Grid with post-pay billing (Status Quo) | Hydropower cutailed because of drought. Natural gas or heavy fuel oil unavailable because of transport difficulties. Planned outages for regular maintenance. Load shedding due to inadequate generation | Fault, broken electrical component on transmission or distribution | Post-pay customers have their electricity service cut off because of past unpaid bills. Utilities with tariffs less than the cost of service use blackouts to limit losses |
We expect that different scaled systems, particularly between off-grid and on-grid systems, will have different proportions of the three distinct outage categories, each necessitating different solutions. However, all reasons will be present for all types of systems, and all contribute to total experienced electricity unreliability. Charting a path to improved reliability for both households and system operators requires careful consideration of what characteristics of unreliability one wishes to address.
3.2.3. Proposed metric 2
Timing of outages The timing of power outages has been qualitatively asserted as important to the experience of reliability (Tait 2017, Thomas and Urpelainen 2018, Dunn et al 2019, Zemo et al 2019), however empirical investigations of outage patterns or predictability are rare. The examples that do exist are sparce in details. For example, ESMAP's MTF only separates 'day' and 'evening' in the reliability attribute. Tait (2017) and Zemo et al (2019) both note that the time of the day that outages occur and what backup fuels households use are key to understanding impacts. Moreover, timing is a broad category of analysis rather than any specific metric. The 'timing' of outages can include: the average/median start time of an outage, the consistency or predictability in that start time, the probability that an outage will occur, the value of the moment when an outage occurs, etc. Load based metrics in the IEEE 1366 standard somewhat represent a revealed value of the time of day but consider each kVA of demand to be of equal value—omitting that a kVA for lighting or health might be considered higher value than a kVA for entertainment.
To examine multiple facets of the timing of outages, we propose two ways of depicting reliability timing explored in section 4.2.2 and in figure 3. The first shows the probability of being in an outage state at each hour of the day. The second depicts the range of outage durations for each starting hour. These metrics are applied to the SHS, KPLC feeder, and ESMI Kenya datasets. This novel empirical work validates past model assumptions in literature about the temporal patterns of reliability (Lee et al 2014).
3.2.4. Proposed metric 3
Fairness of outage distribution. Of all our proposed metrics, the fairness of outage distribution has been the most previously researched, however never for decentralized systems. Heylen et al (2019) reviews various fairness indices to assess the distribution of electricity reliability among end-users and recommends use of the Gini index and its corresponding Lorenz curves. These indices are: (i) the most used measure of inequality in economic contexts, (ii) have transparent graphical representations, and (iii) are easily interpretable and comparable. We build from Jacobson et al (2005) and Heylen et al (2019) to evaluate the inequality of electricity reliability across our datasets.
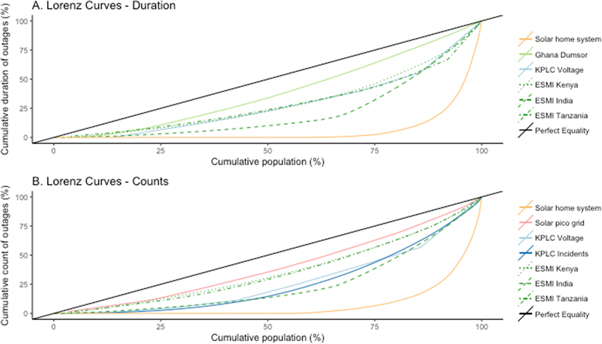
A typical Lorenz curve plots the cumulative share of the population on the X-axis against the cumulative share of income on the Y-axis. A perfectly equal share of income across a population results in a line with a slope of one. The greater the inequality in the sample, the more the curve bows down to the X-axis. Figure 4 adapts this method to show the cumulative share of the population of the energy system on the X-axis against a Y-axis measuring: A. the cumulative share of outage durations as a proxy for SAIDI, and B. the cumulative share of outage frequencies as a proxy for SAIFI. Formally, this Lorenz curve can be expressed as:

Where F(y) is the cumulative, continuous, distribution function of customers arranged in increasing unreliability, and μ is the average.
3.3. Data sources
The primary and secondary datasets detailed below should be viewed as a unique collection of case studies in a global study of the reliability of electricity access. Because of the variety across the case studies, conclusive statistical comparisons or generalizations would not be faithfully provided. We advise readers against interpreting values from surveys as truth comparable to measured data. Rather, their value lies in their ability to illuminate deeper understandings of reliability and patterns within datasets and broadly across the scale of systems. The data sets from SHS in Tanzania and grid feeders in Nairobi, Kenya are highlighted as novel primary data. Details on the scope, measurement, and links to availability of datasets are provided in SI.1 to assist future research, filling a crucial gap in the availability of electricity reliability measurements in developing countries. Figure 1 displays approximate locations of the energy systems studied.

Figure 1. Approximate locations of data sources. SHS in Tanzania are red and orange (distinguishing households and schools respectively); SPG in India are yellow diamonds; ESMI household grid sensors in are circles in Tanzania (blue), Kenya (green), and India (violet); buffers around KPLC Feeders in Nairobi are purple; and country borders represent the World Bank Surveys. The number of features represents the approximate numbers of sensors and is depicted by different sized icons. For all household systems, a random adjustment of 10 km was added before clustering for confidentiality following the rural area methodology of USAID's DHS.
Download figure:
Standard image High-resolution imageThe data sources below are organized first in terms of location starting with Tanzania, then Kenya, then India. Within each country, data sources are organized by system size (from smallest to largest) where available.
3.3.1. Decentralized solar-home-systems (SHS) in Tanzania
Off-Grid Electric Ltd is an energy services company that provides home energy solutions based on solar and storage technologies and PAYGo micro-financing mechanisms across SSA. Data was collected from their solar-plus-storage kits that range from 30–120 Wh, that are designed to provide 24/7 power for lighting, charging, radio, TV, and other loads. The authors collected and summarized the primary system data for a non-random sample of 417 SHS installed across 16 regions of Tanzania.
3.3.2. Centralized grid in Tanzania
TANESCO is the national electric utility for mainland Tanzania. TANESCO's grid reliability is reported in two global surveys conducted by the World Bank included here as secondary sources: (i) the Enterprise Survey ('Enterprise Survey Methodology,' n.d, World Bank 2018a) is a firm-level, representative sample of an economy's private sector. Because businesses report their experienced reliability, this data is denoted as 'from Businesses'; (ii) the Doing Business Survey ('Doing Business Survey Methodology,' n.d, World Bank 2018b) annually collects an array of policy and process metrics relevant to starting and operating small and medium enterprises. Annual SAIDI and SAIFI values are requested from the distribution utility company in the largest business city of each economy. These data points are denoted as 'from utilities' because the utility reports its own reliability.
The Electricity Supply Monitoring Initiative (ESMI) led by the Prayas Energy Group (ESMI n.d ) provides an additional secondary data source for the electricity grid in Tanzania through its real-time, open-source database on supply interruptions and voltage levels at consumer locations (households and commercial). Their pilot ran from January 2017 to May 2018 recording data at twenty-five locations in Dar es Salaam Tanzania.
3.3.3. Centralized grid in Kenya
Kenya Power and Lighting Company (KPLC) is the sole electricity distribution company in Kenya operating the interconnected grid as well as several regional grids in northern Kenya. Through a collaboration with KPLC's Institute of Energy Studies and Research, the authors acquired and summarized primary data on the reliability of seven 11 kV feeders in the greater Nairobi area between June 2017 and July 2018. Primary data on the counts of outage incidents on 323 feeders in Nairobi over a two-year period are also summarized.
In addition to SAIDI and SAIFI collected from the World Bank Surveys, we also summarize Kenyan grid reliability measured by the ESMI Kenya Initiative on their fifty-nine sensors in residential locations in Nairobi between November 2017 and October 2018.
3.3.4. Decentralized solar-pico-grids (SPG) in India
Numminen et al reported on reliability of seven low-power, direct current, solar-battery pico-grids in rural northern India (Numminen et al 2018). The SPG supplied basic electricity services (lighting and phone charging) 24/7 but connections were limited to 30 W. The data summaries in Numminen's journal article and supporting documentation were summarized and reprinted with permission.
3.3.5. Centralized grid in India
Secondary data on SAIDI and SAIFI representing the electricity grid of India was compiled from the World Bank Surveys and from ESMI. ESMI has over 437 locations across twenty-three states in India, eighteen of which are within one-hundred km of Numminen's SPG in rural Uttar Pradesh. The data spans September 2015 to the writing of this article.
In summary, the SHS and KPLC data represent primary datasets collected by the authors; the SHS, SPG, and ESMI datasets were measured at residential household meters; The KPLC and Doing Business datasets were measured at grid-level sensors, and the Enterprise dataset was from a representative survey of business owners. All data sources are thoroughly described in SI for transparency. This article focuses on household-level experienced electricity reliability in Tanzania, Kenya, and India. In comparison to the considerable literature dedicated to SDG 7 overall, experienced household-level reliability is under investigated, particularly in East Africa. Rather than comparing customer classes, non-household measurements are interpreted as floors for residential SAIDI/SAIFI in those same locations.
4. Analysis, results, and discussion
The following analyses seek only to compare the experienced reliability of household electricity—measured intuitively by when households can turn on their lights—provided by the above systems supplying electricity access. We acknowledge that different scaled systems can power different types of loads, are priced differently, and range in the other attributes described by the ESMAP MTF. However, reliability comparisons using common frameworks still fill key gaps in the literature's understanding of the reliability of SDG 7.
4.1. Status quo: comparing SAIDI and SAIFI
Figure 2 reports the systematic calculations of SAIDI and SAIFI from each of the various datasets in Tanzania, Kenya, and India using methods detailed in SI.2-4. Subsets are provided for regions with a separation between decentralized and centralized electricity sources.
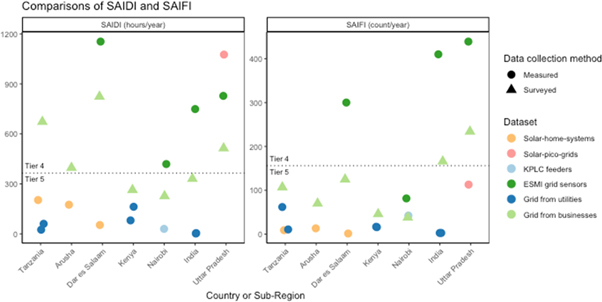
Figure 2. Status quo comparisons of SAIDI and SAIFI across all datasets in Tanzania, Kenya, and India and sub-regions. Decentralized systems are noted in warm colors (orange and pink) while centralized grid systems are in cool colors (greens and blues). Marker shape designates the data collection method. Horizontal dashed lines mark the threshold between Tiers 4 and 5 in the ESMAP Multi-tier framework. All values are taken from the closest period to 2016, are scaled by data availability to represent one full year and have momentary and MED cut-offs applied. For complete details see SI.2.
Download figure:
Standard image High-resolution imageAn initial focus on the centralized grid reveals several interesting comparisons. The non-homogeneity of electricity reliability is made evident by the vast differences across sub-regions, depicting pockets of better (or worse) grid reliability. The data from the ESMI sensors exhibited the largest SAIDI and SAIFI in all regions and sub-regions. The next largest values were recorded through surveys of the experiences of businesses via the WB Enterprise Survey. Measured grid reliability in the same year and location reported by the national utility via the WB Doing Business Survey was often an order of magnitude lower than both the values from ESMI and the Enterprise Surveys. As reported by Taneja and Tait, there is significant reason to suspect utility-reported values as under-reporting actual outages because of either omission of low-voltage data collection by the utilities or flawed incentives of utilities reporting their own performance to potential sources of funding (Tait 2017, Taneja 2017). Future research into the magnitude of under-reporting is necessary. Although caution must always be placed on data collected from surveys, the large difference between the reported reliability from the two World Bank surveys is still striking as also noted by Taneja (2017) and Ayaburi et al (2020). If the ESMI data is taken as representative of regional household electricity reliability, then the difference in reliability between ESMI and the customer surveys indicates that customers may in fact be significantly underreporting grid unreliability, contrary to most literature that indicates that customers tend to overestimate supply problems (Numminen and Lund 2019).
The SAIFI and SAIDI from the KPLC feeder voltage data in Nairobi were 2 and 14 times less, respectively, than the SAIFI and SAIDI from the ESMI sensors also measuring the grid in Nairobi. The Doing Business Survey for the whole country, which came indirectly from the same utility, had a 170% higher SAIDI and 60% lower SAIFI than the KPLC feeders. Therefore, the KPLC feeder data was investigated to explain this divergence from the other datasets and to illustrate how three factors (the level of the electricity grid, geographic scope, and temporal granularity) to impact reliability measurement in SI.5. In summary, sensors closer to residential households (in terms of geographic proximity and similar lower-voltage levels) and measured at higher temporal resolution reveal higher numbers and durations of outages. This indicates that in order to evaluate the experienced household electricity reliability for SDG 7, high temporal and spatial resolution data directly measured at the household level is necessary.
A focus on decentralized system reliability reveals comparable reliability to their local and national grids. In the first documented empirical evaluation of the reliability of SHS in a developing country, SHS had fewer outages than the local grid, even by the grid's own reporting. The annual duration of outages for SHS was dramatically lower than the other household-level datasets in all three locations. The SAIDI achieved is equivalent to approximately fifty-six minutes of outage per customer per day. When comparing SAIFI between the grid and SHS, and when examining a regional comparison of SAIDI and SAIFI in Arusha, SHS performed significantly better than the grid in terms of reliability. The SPG reported by Numminen showed a slightly larger SAIDI than the other datasets, but a SAIFI slightly less than the other results from Uttar Pradesh. These findings uniquely contribute to the literature on decentralized energy system reliability in developing countries and show promising results for decentralized solar energy systems to be able to provide reliable electricity for household lighting.
While promising, these results do not necessarily imply that decentralized systems are better overall choices based solely on their improved reliability. The other indicators in ESMAP's MTF such as quality, capacity, and safety, and affordability are all vital parts of the comparison and are evaluated in more detail elsewhere (Groh et al 2016, Graber et al 2018). This article seeks only to inform the reliability aspect of the larger frameworks.
However, our empirical results do reveal important gaps in the existing frameworks for measuring SDG 7. Based on measured duration and reliability, SHS would supply Tier 5 service on the ESMAP Multi-tier Matrix for Access to Household Electricity Supply but would be categorized as between Tiers 1 and 2 due to capacity (Bhatia and Angelou 2015). Numminen's pico-grid achieves Tier 5 service for reliability, Tier 4 service for duration, but only Tier 1 access for capacity. While many of the local grids would supply Tier 5 capacity, they only provide Tier 4 reliability based on surveys and meter-level measurements. Therefore, the notions of reliability in ESMAP's MTF do not necessarily line up with the reality of deployed systems. While grids in developing regions tend not to meet reliability or affordability constraints, the SHS may meet reliability but not capacity goals. The existing thresholds in the MTF need continuous updating as more reliability data becomes available, and as energy efficiency improvements continue to provide more value from less power.
4.2. Comparisons on proposed metrics
SAIDI and SAIFI values alone fail to reflect three key aspects of outages: the reasons for the outages, the timing of the outages, and the fairness of outage distribution throughout the community. These aspects have been alluded to but are rarely empirically examined in literature. The industry standard metrics are further insufficient because they were designed to measure centralized grids rather than the newer renewable energy-based, stand-alone, or decentralized systems. This article's unique collection of datasets highlights the disparities in these three vital aspects of reliability—all of which are indispensable when comparing the household experience of reliability of across the scale of energy solutions.
4.2.1. Reasons for outages
At present, it is only possible to separate the contribution of different outage reasons for the SHS dataset, particularly to distinguish resource from technical outages in measured reliability, as well as represent the additional toll on households from economic outages. Table 3 shows that while most of the events were resource-based, the total duration was dominated by economic outages. In all three cases, the median was less than the mean with large standard deviations indicating wide distributions that are skewed right. Unlike other SHS studies, battery degradation was not a concern because the systems in question used high-quality lithium-ion batteries and were leased on an energy-as-a-service model.
Table 3. Descriptive statistics of SHS outages separated by the reason for the outage. MEDs and momentary events removed.
| Duration of events, in minutes | ||||
|---|---|---|---|---|
| Outage Reason | Event count | Mean | Median | Standard deviation |
| Resource | 1106 | 737 | 456 | 2,886 |
| Technical | 48 | 14,258 | 4,050 | 27,660 |
| Economic | 478 | 16,347 | 4,550 | 25,061 |
Of the 203 h/yr/household SAIDI (median = 0, standard deviation = 756) (representing only resource and technical outages with MEDs and momentary interruptions removed), 54% is attributed to resource outages. Including economic outages instead of considering them unavailable time increases annual household electricity unreliability four times. Affordability is thereore a major part of household experienced reliability on these pre-paid systems. In other words, while customers perceive technical outages to be the most concerning, they are smallest contribution to experienced unreliably for SHS households. Because outages due to individual customers' economic challenges are not associated with utilities' supplied reliability, the remaining results will not include these outages when comparing the reliability of other energy sources. Unfortunately, other case study datasets do not contain information on the economic status, or payment records, of the individual households or customers, therefore patterns cannot be drawn across economic classes.
A recent UN Report on SDG 7 found that, 'The number of people without access to electricity increased in 2020 after declining over the previous six years, due to population growth and increased costs for basic electricity services, which are now unaffordable for more than 25 million people who had previously gained electricity access. An additional 85 million people, mainly in developing Asia, could lose the ability to pay for an extended bundle of electricity services and may therefore need to scale back to basic electricity access' (SDG 7 Technical Advisory Group 2021). When our concept of economic outages is placed against Gertler et al (2017)'s analysis on the negative economic impacts of outages, a negative feedback cycle becomes apparent. These cycles, also called vicious cycles (Schnitzer et al 2014) are created when poor system reliability leads to depressed economic circumstances, leading to low ability to pay, and therefore more economic outages. Recognizing and quantifying economic outages will only become more important for understanding the depths of energy poverty in the future.
Recent efforts to upgrade components, improve maintenance, and build necessary generation and transmission capacity across grids in SSA promise to decrease the frequency and duration of both resource and technical outages. Improvements in these categories of outages, or efforts to shift peak demand, do not erase the existence of distinct categories of outages, only their proportions and timing. The analyses presented in this article present a snapshot of outage durations, frequencies, reasons, timing, and distributions from our case studies at the time of collection. We fully expect specific values to change over time. In the near term, continued monitoring will be needed across all three categories of outages to improve real-time reliability investments. Moving forward, our analysis framework will be essential for making long-term comparisons and guiding policy to address the most pressing issues.
4.2.2. Timing of outages
Examining the timing of outages—in terms of the hourly outage state probability and hourly outage duration—shows strongly different patterns depending on the dataset and reason for the outage, demonstrating the value of this proposed metric. Figures 3(A), (B) show the hourly probability of being in an outage state described by the range of locations and the customer-weighted mean. The feeders show a bimodal pattern with a higher probability of being in an outage state between 4–6 am and 9–10 pm. The higher probability for those hours is equivalent to one day in three-and-a-half months in an outage state. Both outage periods have a high likelihood of large impacts on residential consumers, especially 9–10 pm which overlaps with peak demand from the feeder load data. If outages on the utility grid are primarily technical outages due to random events, we would expect to see a flatter distribution. However, the bimodal pattern suggests that outages are more dependent upon usage patterns than purely random events, potentially also implying load shedding during times of peak load. The grid-connected household data has a much flatter distribution with slight increases between 10am and 5 pm.

Figure 3. Timing of outages for SHS, KPLC, and ESMI Kenya datasets. Two proposed metrics applied to each dataset show the importance of considering outage timing. 3.A-B on top depict the probability of the Nairobi grid being in an outage state for each hour of the day from two different datasets. 3.C-E on bottom depict the durations of outages starting during each hour of the day. The box-and-whisker plots display the median and range, and the red dots display the customer-weighted mean. Differences between the median and mean indicate significantly skewed distributions.
Download figure:
Standard image High-resolution imageThe depictions of outage duration by starting time in figures 3(C)–(E) are indicative of the architecture of the different systems and the reasons for their outages. The SHS show a clear decreasing trend for resource outages with a maximum median outage duration of 15 h at 5 pm, a minimum median outage duration of 3 h at 1 pm, and a wider range of outage durations between 3–5 pm. This pattern results from the SHS's ability to recharge during the day, but if a resource outage starts at sunset (nominally 6:30 pm year-round in Tanzania), then the outage will last until the system can recharge when the Sun rises approximately 12 h later. The minimum median outage duration represents the amount of time needed for the batteries to recharge enough for users to regain access to electricity, not necessarily to fully recharge the batteries. The feeder and grid-connected household results do not show such clear patterns. The durations of outages on grid-connected households are notably much larger than those on grid feeders or SHS.
There are several important ways that this proposed approach can be used for real reliability improvements. By correlating outage incidences and durations with the time of the day and load, the utility—or other energy system provider—can better direct investments towards fixing those that impact reliability the most. For example, frequent load shedding indicates inadequate generation capacity or transmission constraints, while more random events during those same peak-load hours, may indicate specific overloaded equipment that needs upgrading. This proposed analysis can also inform more practical policies such as real-time, dynamic maintenance schedules that determine how many maintenance workers are needed to respond to outages occurring at different times of the day and night, and how maintenance equipment should be stationed throughout a city. Understanding the causes of outages combined with their timing is useful because it points to different sets of 'technological, economic, or political solutions' for improving reliability (Gertler et al 2017). For SHS, this analysis can be used to identify ideal customers for upgrades in addition to informing solar-to-battery ratios optimized for customer user patterns. Ideal customers to upgrade have few economic outages (indicating sufficient ability to pay) but many resource outages, particularly in the evening (indicating i) insufficient battery sizing for their usage if batteries are fully recharged daily, and/or ii) insufficient solar capacity if batteries are not fully recharged daily). The systems in question were fully recharged daily, indicating battery sizing was the more severe constraint. Customers on systems with more predictable outage patterns at the same SAIDI and SAIFI levels are more likely to be able to access the benefits of electricity.
4.2.3. Fairness of outage distribution
In addition to intra-household access fairness mentioned earlier, there is also a need for increased emphasis on inter-household fairness. Both Aidoo and Briggs (2018) and Dunn et al (2019) explore spatial and temporal disparities in grid outages in different settings and with different methods. Aidoo and Briggs used messages to the Dumsor Report in Accra, Ghana to evaluate the degree to which rolling blackouts disproportionately hurt poorer neighborhoods. They found that daily, the poorest housing quintile received an average of 7.5 h of electricity while the richest received 17.5 h even though 12 h were pledged equally to all neighborhoods. The top residential and commercial tax class received electricity nearly 24/7 (Aidoo and Briggs 2018). Our examination of the ESMI Kenya data found that 'low income' households received over twice the outage duration and frequency as 'high income' households in Nairobi, Kenya. Dunn et al used grid outage data scraped from the websites of utilities in the Western United States and found that grid performance spanned orders of magnitude within service territories, uncovering significant policy implications (Dunn et al 2019).
The Lorenz curves in figure 4 show surprising and important results for both outage counts and durations. Although Aidoo and Briggs noted dramatic differences in outage durations between poor and rich neighborhoods in Ghana, their data (reproduced with permission) had the most equal distribution of the datasets presented. The SPG had the most equal distribution of outage counts, partially attributable to system's architecture where customers are cut off jointly during an outage. The SHS, in both counts and duration, had the least equal distributions of outages, with many systems having no outages over their sample period. While perfect reliability is an ideal, due to the nature of battery-constrained systems, a SHS user only receives a resource outage if they have used all the daily kWh available. Therefore, a household with a fixed system size receives more kWh (therefore, benefit) from their SHS when they have more resource outages. The variation within the ESMI datasets and between the datasets located in Kenya were also noteworthy. Of the ESMI datasets, the distributions of outage durations and counts for India were more unequal than the distributions for Tanzania and Kenya, which we attribute to geographic scope. The 437 sensors in India are located across twenty-three states, while the 59 sensors in Kenya and 25 sensors in Tanzania were all located in Nairobi and Dar es Salaam respectively. While the KPLC voltage data and KPLC incident reports (both for the greater Nairobi area) showed similar outage count distributions, and the KPLC voltage data and ESMI Kenya data showed similar outage duration distributions, the KPLC voltage data and KPLC incident reports had less-equal distributions of outage counts than the ESMI Kenya data. This difference is particularly notable because the KPLC feeder voltage was measured at a higher level of the grid than the household-level ESMI Kenya data, therefore we expected there to be more shared outages and more similar outage durations between feeders.
Figure 4. Comparison of energy system reliability inequality using Lorenz curves. Adapted Lorenz curves show the cumulative share of the population of each system on the X-axis against a Y-axis measuring: A. Cumulative share of outage durations as a proxy for SAIDI. B. Cumulative share of outage frequencies as a proxy for SAIFI. Each available dataset is presented along with a black line with slope =1 representing the ideal, perfect equality of outages. Blue and green lines represent grid datasets, while orange and pink represent decentralized systems. 'Ghana Dumsor' is summarized and printed with permission from Aidoo and Briggs (2018).
Download figure:
Standard image High-resolution image
These proposed metrics show that the current metrics, SAIDI and SAIFI, are not sufficient for describing the reasons for outages, the timing of outages, or the fairness of outage distribution on individual electricity access solutions and therefore across the continuum of options.
5. Policy implications for addressing energy poverty in the Global South
The above empirical analysis provides crucial insights into the reliability of experienced household electricity access in Tanzania, Kenya, and India. Our findings suggest several immediate policy implications and underscore the need for further work to understand the unreliability of household electricity access across the scale of solutions.
Implication 1. Studies that evaluate the impacts of unreliability need high temporal and spatial resolution data directly measured on the communities of interest.
Prevailing methods use nationally aggregated annual SAIDI or SAIFI to evaluate business and economic development. This aggregation fails to adequately represent the magnitude, range, and nuance of reliability, therefore obscuring insights. Without an understanding of the timing of outages and alternatives available to end-users, the prevailing methods are severely lacking.
Implication 2. For household electricity access in particular, the existing reliability metrics (SAIDI, SAIFI, Multi-Tier Framework) are insufficient for informing SDG 7 policy decisions.
Existing metrics measure reliability of supply rather than experienced reliability (when the lights are on for households rather than when the system could supply power, i.e., the combination of resource + technical + economic outages). SAIDI and SAIFI are not designed to measure decentralized solutions which will play a prominent role in energy access efforts alongside grid extension, particularly in the short term and in rural areas. Households will nearly always have poorer electricity reliability than nearby urban and/or industrial customers.
Implication 3. The affordability of energy access solutions is already becoming as important as access to the solutions.
In the only data set available that had visibility into economic outages, they composed up to three quarters of experienced unreliability. The UN reports that the number of individuals who are losing their access to electricity due to affordability issues is increasing. As households are becoming increasingly responsible for procuring their own access in a marketplace, affordability is surpassing availability as the dominant barrier to universal electricity access.
Implication 4. Fairness and equality must be at the forefront of efforts to improve the service quality of electricity solutions in Sub-Saharan Africa.
Fairness and inequality are not typically considered when reliability enhancement decisions are made. Future investments and upgrades can prioritize increasing these aims such that a base level of service is achieved for all. Not considering them harms our chances of achieving SDG 7's mission, particularly reliability for all.
6. Limitations and opportunities for future research
There are a few important directions for additional investigation to build from this article. Namely: the importance of qualitative research; balancing reliability with cost, particularly for SHS and SPG; addressing load-limiting procedures in reliability analysis; and distinguishing the reliability effects of stacked systems.
Quantitative assessments such as our will benefit from more qualitative and human-facing research into subjective experiences of electricity reliability. Emerging literature such as Jacome et al (2019) and Numminen and Lund (2019) are excellent examples of research creating qualitative and subjective indicators of reliability grounded in fieldwork and interviews. Measuring reliability in ways that account for both providers and customers perspectives can be an important way of minimizing biases.
As noted above, the reliability of any stand-alone, solar-plus-storage system is dependent upon usage patterns. For example, SHS customers who use their system more will have more resource-driven outages when their battery runs out for the night. This can mean that reliability data can be more representative of usage data than system performance data (Lee and Callaway 2018). Although the ratio of the solar and storage can always be modified to reduce outages, some customers may find it more beneficial to have a cheaper system that is used to its full capacity. Some of the existing literature on decentralized minigrids addresses this tradeoff between cost and technical reliability, (Lee et al 2014, Lee and Callaway 2018) but further community-facing research is needed to address how this tradeoff plays out in the design, selection, and use of SHS and SPG.
Another limitation is that outage statistics do not reflect load-limiting procedures. The SHS studied here (as well as Numminen's SPG in India and Quetchenbach's micro-hydro minigrid in Bhutan) limit household loads when they are capacity constrained and threatened by resource-driven outages. Although these procedures allow individuals to receive some energy services (generally lighting), they are prevented from using larger appliances. This suppressed demand is generally not considered an outage even though the experience is significantly affected. Future research on the behavioral dynamics between load-limiting procedures and demand-response-type behavior by individuals to reduce the occurrence or effects of load-limits is crucial.
Finally, there is a trend towards energy system stacking for improving overall experienced reliability. In India, it is not uncommon for off-grid-systems, minigrids, and the national grid to operate side by side in unreliable-grid areas, and for some customers to have connections to all three (Lighting Global 2018). While the analysis here omits stacking effects, future work on household experienced reliability should address stacked systems, especially to evaluate the revealed willingness to pay for added reliability. Nigeria, a country with low grid reliability and a large reliance on back-up systems, offers an ideal location. We refer readers to analyses by Barman et al (2017), Pelz et al (2021), and Sharma et al (2020) for examples in India.
7. Conclusion
This article fills key gaps our understanding of the electricity reliability of energy access in developing countries by providing one of the first detailed evaluations of measured SHS reliability in SSA in peer-reviewed literature and highlighting the importance of economic outages. It provides a representative review of the existing empirical literature; compiles a unique collection of datasets in a global survey of energy access; and proposes a common framework to analyze outage causes, timing, and the fairness of outage distribution.
The above case studies show that SHS provide comparable reliability to their local grids, but the distributions of outages were less equitable than for other sources. Grid reliability measurements are highly sensitive to geographic scope, temporal granularity, and the level of the electricity grid, causing orders of magnitude differences between values. Outages can be categorized as resource, economic, or technical, each which have different timing patterns and outage distributions. And finally, economic outages, conspicuous in PAYGo SHS customers' experienced reliability, compose a significant portion of experienced unreliability and are severely underrepresented in reliability metrics and broader reliability literature.
While the SAIDI and SAIFI results from our datasets are compelling, they are insufficient for understanding household electricity reliability in isolation. The magnitude of electricity unreliability in developing countries and the entrance of decentralized technologies highlight the limits of existing metrics. In failing to account for the reasons, timing, or distribution of outages, SAIDI and SAIFI are insufficient for comparing the household experience of reliability of energy solutions and prioritizing solutions. Our outage categorization framework, presentation of outage timing, and use of the Lorenz methodology to examine outage inequality are generalizable for use by future researchers.
Since reliability is defined to measure how well the provider is supplying power, it does not necessarily represent the recipient's experience. For example, our inclusion of economic outages increased experienced unreliability by a factor of four. Since reliable electricity is an enabling factor for nearly all Sustainable Development Goals, if individuals are still not receiving reliable power, these outages should also be quantified and addressed.
This research provides an example of the insights available when reliability data is made public, bolstering calls for all stakeholders to quantify and share data on the reliability of electricity systems and include reliability in energy access policy and regulation.
In these efforts, there will be a tension between the need for increased emphasis on reliability and an overreliance on any individual metric. In an era of increasing quantification, while metrics for easy comparison are seductive, they can lead to oversimplification and homogenization if not grounded in qualitative understandings (Mennicken and Espeland 2019). While we encourage ongoing qualitative scholarship on understanding energy poverty alongside energy literacy efforts for households, we also encourage transparency and standardization (as well as acknowledgement of nuance) in reporting practices throughout the sector. These are necessary, but not sufficient, first steps towards understanding the full landscape of electricity reliability from which future work can find where simplifications are, or are not, appropriate.
Lee et al (2019) details the opportunities and risks for key stakeholders from increased data sharing in the context of expanding electricity access. They note that standardization and transparency into the reliability of electricity products allows individuals to make the most informed decision. This transparency allows for increased competition between providers resulting in better services provided for end users and allows governments, investors, and development institutions to encourage the best performing systems through performance-based regulation and investment (Lee et al 2019). This article study demonstrates the possibilities and insight gained when full detailed data is available, however rare. The appropriate balance between the complexity of data needed to measure reliability accurately, and simply communicating findings to policymakers and households can be found only after we are aware of the full landscape.
In the discourse of energy access policy, modeling, and literature, centralized and decentralized solutions are rarely compared on equal footing, even though in many cases they are already working in concert to achieve improved energy access across communities and within households. As decentralized energy systems actively redefine how millions receive electricity access, they can also redefine how we measure, compare, and regulate access. This study uniquely demonstrates how distributed solar technologies can be compared to utility electricity and can contribute to household electricity reliability in developing communities to truly achieve 'access to affordable, reliable, sustainable and modern energy for all.'
Acknowledgments
We sincerely wish to thank the hardware team, particularly Joshua Pierce and Claudio Vergara, at Off Grid Electric (Zola Electric) and Charles Ndungu and Patrick Mwangi Karimi at KPLC's Institute of Energy Studies and Research for their data and support throughout this project. We would also like to thank the ESMI Kenya Initiative (a joint venture implemented by EED Advisory Ltd, World Resources Institute, and Prayas Energy Group) and the ESMI Tanzania Initiative (a joint venture implemented by The Energy Change Lab, Prayas Energy Group, and the World Resources Institute) for data. Grateful acknowledgment is made for permission to summarize and report data from the following previously published material: Numminen et al 2018 and Aidoo and Briggs 2018. We are thankful for the members of the Energy and Resources Group (ERG) at the University of California Berkeley, especially the EMAC and RAEL research groups for their insights. Individuals who deserve thanks include Kay Burns, Rebekah Shirley, Jay Taneja, Jonathan T. Lee, Annelise Gill-Wiehl, and the 2018 ERG Masters Class. The authors would also like to thank the anonymous reviewers whose insightful comments improved this article.
Data availability statement
The data generated and/or analysed during the current study are not publicly available for legal/ethical reasons but are available from the corresponding author on reasonable request.
Funding
We acknowledge support from the US National Science Foundation (through the CyberSEES program award no. 1539585 and InFEWS training program no. DGE-1633740). Any opinions, findings, and conclusions or recommendations expressed in this material are those of the author(s) and do not necessarily reflect the views of the National Science Foundation.
Ethical statement
The authors declare that they have no known interests that could have appeared to influence the work reported in this article.
Footnotes
- 4
The goal includes access to clean fuels and technologies for cooking; however, this article focuses exclusively on electricity access.
- 5
Most of these countries are low- or low-middle-income economies in the WB classification (which also refers to them as developing countries). Here, the developing country label does not imply that all economies in the group are experiencing similar levels of development or that other economies have reached a preferred or final stage of development. Rather, this term is adopted for simplicity. See also: Power for All's definition of low-energy-access countries (Utilities 2.0, 2019, p. 14).
- 6
Even the definition of grid 'access' changes with location. E.g., the Rural Electrification Agency (REA) of Kenya, considers households within 600 meters of a transformer as having 'access' regardless of the presence of electrical wiring inside the household. 'Connected' is used to designate what the broader literature implies when using the term 'access' [via personal communication with REA staff in 2018]. In India, an entire village is considered electrified if distribution lines are present, and electricity is provided to public buildings - such as schools and health centres - and only 10% of the households ('Definition of Electrified Village,' n.d.; Harish et al., 2014).
- 7
Both the IEEE 1366 Standard and The Doing Business Survey Methodology include all occasions when customers lose power including planned and unplanned outages, as well as load shedding in their measurement and calculation of SAIDI and SAIFI ('Doing Business Survey Methodology,' n.d.).