


Abstract
Rapid human pressure in semi-urban and urban areas along with increasing industrial activities has resulted in release of untreated sewage and other forms of pollutants into major rivers globally including in the Ganga. In this study, nine sites represented by 59 stations along the lower stretch of the River Ganga were monitored seasonally to understand the effect of monsoonal precipitation on environmental variables and Water Quality Index (WQI). Sampling was undertaken in pre-monsoon, monsoon and post-monsoon seasons (2019). In situ surface water temperature, dissolved oxygen, pH, total dissolved solids (TDS) and electrical conductivity (EC) were measured along with dissolved nutrients and Chlorophyll-a. Both pH and DO were strongly influenced by monsoon and affected WQI. TDS was higher in point source (PS) stations during pre-monsoon (113–538 ppm) compared to surface water (SW) stations (113–248 ppm) with strong influence of monsoon (PS-27.4-310.3 ppm; SW-27-68.9 ppm). Dissolved nutrients including nitrate and o-phosphate concentration showed significant seasonal variation and influenced monsoonal precipitation. In PS stations across studied seasons dissolved nitrate concentration varied from 26.33–646 μM while in SW the range was from 21.22–148.06 μM. In the studied sites, higher concentration of dissolved nutrients in PS stations reflected the release of untreated municipal and industrial sewage directly into the river. The effect of precipitation and resulting environmental variables was clearly evident on biological variable (concentration of Chl-a) with observed values in PS stations (0–21 mg l−1) which were lesser compared to SW stations (0–89.3 mg l−1) during monsoon. Non-metric multidimensional scaling revealed three distinct clusters with greater overlap between PS and SW stations in monsoon. The WQI values (14–52) determined for lower stretch of Ganga revealed very poor water quality in majority stations and monsoonal precipitation did not have any influence on the observed trends.
Export citation and abstract BibTeX RIS

Original content from this work may be used under the terms of the Creative Commons Attribution 4.0 licence. Any further distribution of this work must maintain attribution to the author(s) and the title of the work, journal citation and DOI.
Abbreviations
| PS | Point Source |
| SW | Surface water |
| DO | Dissolved Oxygen |
| Stn | Station |
| MLD | Millions of liter per day |
| AT | Air temperature |
| EC | Electrical conductivity |
| WQI | Water quality index |
| TDS | Total dissolved solid |
| SPM | Suspended particulate matter |
| SWT | Surface water temperature |
Introduction
Rivers represent one of the major resources of freshwater for sustenance of human populations globally. River water is one of the principal sources for drinking and other purposes including agriculture, industrial and recreational activities (Chen et al 2006, Anawar and Chowdhury 2020). However, due to increasing human pressure many riverine systems globally are increasingly reeling from pollution. Thus to develop an effective water management, there is a need to understand the scale of pollution, develop and quantify indices to track pollution and also to understand spatio-temporal changes of pollution in rivers. Such approaches have been attempted in major riverine systems globally such as the Mekong River (Fu et al 2012) and Yangtze River (Zhang et al 2014).
The growing influx of population into semi-urban and urban areas of India are putting pressure on the natural resources including on major rivers such as the Ganga (Tare et al 2013). The River Ganga sustains populations residing along the river basin including in the cities of Haridwar, Kanpur, Allahabad, Varanasi, Patna and Kolkata (Joshi et al 2009, CPCB 2013, Agarwal 2015). In the state of West Bengal (India), the flow of River Ganga is regulated by the Farakka Barrage. The river splits downstream of the barrage; lower stretch is known as Bhagirathi-Hooghly which flows down right and on the left the Padma River enters into Bangladesh.
On both the banks of the lower stretch of Ganga, intense semi urban to urban localities and industrial zones have developed over time including growth of towns and cities such as Kalyani, Tribeni, Barrackpore, Kolkata and Diamond Harbour before it meets the coastal Bay of Bengal. On a daily basis, release of untreated municipal sewage, agricultural runoffs, untreated effluents from small industries as well as ongoing social, tourism and religious activities affect the water quality of the River Ganga (Muduli et al 2021). It is already well known that municipal sewage and industrial effluents are major contributors to pollution in the River Ganga (Das 2011, Dwivedi et al 2018, Kanuri et al 2020).
As per CPCB report (2014), 8250 million L/day (MLD) of wastewater is generated from human settlements residing along the banks of River Ganga. Of this, 2550 MLD was reported to be directly discharged into the river without any treatment. It was also reported that 25 Class-I towns (population>100000) in the three states of Uttar Pradesh, Bihar and West Bengal in India contributed to 75% of all point-source (PS) pollution (NRCD 2009). Several steps including establishment of sewage treatment plants (STPs) under Ganga Action Plans I and II (GAP) were implemented. However, even with the existing STPs which were set up in the state of West Bengal, the lower stretch of the Ganga continues to report high faecal coliform counts as these could only treat 1208.80 MLD sewage. Between 2007 and 2011, this stretch of Ganga River (Bhagirathi-Hooghly) flowing between Dakshineswar and Diamond Harbour recorded higher faecal coliform count compared to the rest of the entire upstream of the river. It has been also found that 51 of the 64 STPs were functional with only 60% capacity (CPCB 2013).
In the Gangetic Plains of West Bengal, seasonal precipitation that spans over the months of July to September and often stretching to October, plays a major role in influencing water quality of the Ganga River. Surface waters are most vulnerable as they are continuously exposed to disposal of wastewater (Singh et al 2004). Municipal and industrial wastewater that originate from PS affect the river continuously, whereas surface runoff vary seasonally and influenced by seasonal precipitation. Variation in seasonal precipitation, surface runoff, interflow and groundwater seepage are some of the factors that ultimately influence river discharge (Vega et al 1998) and may also affect the pollutants (Anawar and Chowdhury 2020).
Water Quality Index (WQI) represents an efficient method for assessment of water quality required for different human activities including bathing, irrigation, and industrial usages. WQI approach summarizes the effects of number of water quality parameters in a single unit-less value (Horton 1965) and thus can provide holistic idea for health of aquatic bodies including riverine systems. Moreover, WQI can also help policy makers and managers to come up with comprehensive river basin management plans by incorporating water quality and possible uses of the water based on the inferred conditions (Bordalo et al 2001, Kannel et al 2007). By late 70's, more than 20 WQI were developed (Ott 1978). Some of the most frequently used WQI are US National Sanitation Foundation Water Quality Index (NSFWQI; Brown et al 1970), British Columbia Water Quality Index, BCWQI (Zandbergen and Hall 1998), Oregon Water Quality Index, OWQI (Cude 2001) and the Canadian Water Quality Index [Canadian Council of Ministers of the Environment (CCME 2001)]. In India, pioneering work on WQI by Bhargava (1983a, 1983b, 1983c) established a 'WQI number' (ranging from 0 for highly/extremely polluted to 100 for absolutely unpolluted water) to represent the integrated effects of parameters that result in pollution load. Bhargava's WQI described the 'effect of weight of each variable (pollution parameter) in the sensitivity function values of the various pollution variables relevant to a particular use' (Sharma and Kansal 2011). WQI can be determined on the basis of various physical, chemical and biological parameters. The Central Pollution Control Board (CPCB) of India has used the information inferred from WQI to classify surface water into five classes ranging from A to E (A- drinking water source without conventional treatment but with chlorination, B-organized outdoor bathing, C-drinking water source with conventional treatment, D-propagation of wildlife and fisheries, E-irrigation, industrial cooling and controlled disposal) to conclude the possible use of water for various human activities (CPCB 1978). However, WQI approach has not been evaluated in the lower stretches of River Ganga (Bhagirathi-Hooghly) while taking into account the effect of seasons including monsoonal precipitation. The Bhagirathi-Hooghly has been referred to as lower stretch of River Ganga throughout the remaining part of this study.
In light of the available information, we hypothesize that seasonal precipitation has no influence on improving the water quality index (WQI) of the lower stretch of the River Ganga and local factors solely determine ecosystem level health of the region. To test this hypothesis, the objectives of the present study were to (i) determine environmental parameters of the lower stretch of Ganga with a focus on heavily urbanized and industrialized sites (ii) determine the WQI of the studied sites and (iii) determine the influence of seasonal precipitation on the WQI of sites along the lower stretch of Ganga.
Materials and methods
Study sites
This study was conducted along the lower stretch of River Ganga beginning from Kalyani (22°59'45.3''N 88°25' 13.2''E) up to Kolkata (22°33' 2.2''N, 88°19' 27.6''E). The studied stretch spans across a distance of approximately 50 kms. Nine sites were selected located on both sides of the river bank for sampling namely Kalyani (Kal), Tribeni (Trv), Halisahar (Hal), Naihati (Nai), Chandannagar (Cdn), Palta (Pal), Barrackpore (Brk), Dakshineswar (Dak) and Kolkata (Kol) (figure 1). Each site is characterized by dense population pressure and industrial activities which results in release of both domestic and industrial wastes into River Ganga through outlets. At each site, several stations were selected after careful observation based on number of visible municipal and industrial sewage outlets, canals dumping untreated sewage as well as other factors such as the frequent use of river bank for bathing, religious and social purposes as well as close proximity of agricultural lands to river bank. Each such point was classified as Point Source (PS). These stations could be easily distinguished from the surrounding water of the river based on observable water colour. Owing to high concentration of particles in the PS, a clear zone could be demarcated around these stations. Due to slow water movement, mixing and hence dispersal of particles from PS is slow. The area representing surface water in the river away from PS was classified as Surface Water (SW). The water color of SW was visibly different from the PS.

Figure 1. Map of the study area showing locations of sites in the lower stretch of River Ganga representing Kalyani (22°59'45.3''N 88°25'13.2''E) to Kolkata (22°33'2.2''N, 88°19'27.6''E). The blue pins show location of the studied sites.
Download figure:
Standard image High-resolution imageKalyani (22°59'45.3''N, 88°25'13.2''E) is a township spanning an area of 29.14 km2 with a human density of 3500/km2 (Census 2011). It is a Class II town and located on the eastern bank of Ganga. The township of Kalyani houses a number of industries including tyre manufacturing, industrial gas suppliers, paper mills and brick kilns. Small boats ferry people from one bank of the river to the other side resulting in release of oil in river from time to time. The area is visibly polluted by dumping of solid waste along the river bank including plastic debris. There is dense growth of water hyacinth (Eichhornia crassipes) along the bank of the river. Local village dwellers use water from the river for bathing and both household chores. They also conduct fishing at small scale near the river bank. Kalyani has two STPs with a combined capacity to treat 17 MLD (Kalyani Block B2, B3- 11 MLD, Kalyani Town Area- 6 MLD) (Mukherjee 2016). A STP of 21 MLD capacity has been also sanctioned in Kalyani under Namami Gange Programme. In total, six stations were sampled comprising of 2 PS and 2 SW and these are designated as Kal_Stn1_PS, Kal_Stn1_SW, Kal_Stn2_PS, Kal_Stn2_SW, Kal_Stn3 and Kal_Stn4. The stations of Kalyani have the abbreviation of Kal. The station nomenclature approach has been also followed for rest of the sites.
Tribeni (22°59''N, 88°25''E) is situated on the Ganga River bank opposite to Kalyani. This place is famous for religious congregations and thousands of people dip into the river at Benimadhav Ghat. Apart from its religious significance, Tribeni has a number of jute mills, cotton textiles, a tissue factory, brick kilns and paper factories. Additionally, there is a 'bathing ghat' and a crematorium. In total eight stations were sampled comprising of four PS and four SW. The stations of Tribeni have the abbreviation of Trv.
Naihati (22°53'24''N, 88°25'12''E) located on the bank of Ganga covers an area of 11.55 km2 and has a population density of 19000/km2 (Census 2011). Naihati is a vibrant industrial area which includes production factories of paints, pigments, varnishes and associated products. There are innumerable jute mills located along the river bank. Additionally, this area witnesses an active fish market which is dependent on local production. In order to cater to the transport needs, there is an active ferry service between both banks of the river. Naihati has 5 big drains (Thana Khal, Haran Majumdar Khal-I, Haran Majumdar Khal-II, Keorapara Khal, Muktarpur Khal), among which only Thana Khal is connected to the Naihati STP. Naihati has 265 km of open drainage and 0.66 km of underground drainage which together with the above-mentioned big drains open into the Ganga. In total six stations were sampled at Naihati comprising of three PS and three SW stations. The stations of Naihati have the abbreviation of Nai.
Halisahar (22°56'49''N, 88°25'6.2''E) is situated on the eastern bank of the Ganga. It covers an area of 8.29 km2 and has a population density of 15000/km2 (Census of India 2011). Industrialization along the river bank started in early 20th century and includes jute, paper and pulp mills. Halisahar has surface drains spanning length of 127 km and 76 km of unsurfaced drains that carry municipal wastewater into the river. Sanitation is achieved through usage of septic tanks (Gayen 2015). A STP of 16 MLD capacity has been sanctioned under the Namami Gange Programme. In total six stations were sampled at Halisahar comprising of three PS and three SW stations. The stations of Halisahar have the abbreviation of Hal.
Chandannagar (22°52'12''N, 88°22'48''E) has an area of 19 km2 with a population density of 8800/km2 (Census of India 2011). This township is famous for small scale and cottage industries that were set up even before the French colonized the region. Apart from jute mills, several handloom set-ups, brick kilns, well lining manufacturers line the bank of the river. In total 6 stations were sampled comprising of three PS and three SW. The stations of Chandannagar have the abbreviation of Cdn.
Palta (22°47'4.92''N, 88°21'53.68''E) is a small township located along the eastern side of the River Ganga. The Palta Water Works, now known as the Indira Gandhi Water Treatment Plant supplies potable surface water to Kolkata. It spans over about 19 km2 area and is the first intake point for generation and supply of water from the river. It has a capacity to generate of 260 million gallons of water every day (Chatterjee 2014). Four stations were sampled at Palta consisting of two PS and two SW stations. The stations of Palta have the abbreviation of Pal.
Barrackpore (22°45'36''N, 88°22'12''E) has an area of 10.61 km2 with a population of 14000/km2 (Census of India 2011). It has a number of large industrial setups including jute, engineering works, paper and cotton mills along the river bank. A STP of 24 MLD capacity is being presently set up under the Namami Gange Programme. In some of the sampling stations dense growth of water hyacinth is present. In total six stations consisting of three PS and three SW were sampled. The stations of Barrackpore have the abbreviation of Brk.
Dakshineswar (22°39'19.55''N, 88°21'28.3''E) is one of the most important religious sites for Hindus and visited by people from all over the world. The temple is situated on the river bank as a result of which thousands of individual bath in the surrounding river water on a daily basis. Two large scale industries including a matchstick company and a paper mill is located along the river bank. In Dakshineswar, six stations comprising of three PS and three SW were sampled. The stations of Dakshineswar have the abbreviation of Dak.
Kolkata (22°34'21.36''N, 88°21'50.04''E), a megacity located on the bank of Ganga has an area of 206.08 km2 and population density of 22000/km2 (Census of India 2011). Along with the huge population pressure that is dependent on the Ganga for daily water requirements, this region is also India's oldest and second largest industrial area. Industries such as jute, engineering and cotton textiles, transport and tertiary industry, chemical manufacturing, iron and steel manufacturing, tanneries, and food products have developed on the banks of the river. The bathing Ghats of Kolkata are heavily used for bathing. Along with this, there is intricate ferry movement across both the banks of the river that transport thousands of people each day. The city produces 750 million litres of wastewater and sewage everyday that is treated at the East Kolkata Wetlands, which is the world's only fully functional organic sewage management system. Apart from that, five functional STPs (Garden Reach, Bangur, South Suburban, Baghajatin and Hatisur) and 73 drainage pumping stations (as per the Kolkata Municipal Corporation; https://www.kmcgov.in/KMCPortal/jsp/KMCDrainageHome.jsp) handle the wastewater of the city. A total of eleven stations were sampled consisting of six PS and five SW. The stations of Kolkata have the abbreviation of Kol.
Sampling activities
The sampling activities were designed as per the Guidelines of Water Quality Monitoring, CPCB. The CPCB document specifies a pre-monsoon sampling once a year followed by sampling every three months for perennial rivers. Sampling was conducted monthly during pre-monsoon (March-May, 2019), monsoon (June-September, 2019) and post-monsoon (October –December, 2019) across all the studied sites. Owing to strong influence of the south-western monsoons on freshwater flow in the lower stretch of Ganga during monsoon season, increase in freshwater input along with water flow rate are expected to have a strong influence on concentration and forms of dissolved nutrients and in turn on the water quality. Run off from terrestrial sources would also alter the dynamicity in terms of forms and concentrations of dissolved nutrient forms in the river. In post-monsoon, average water volume would increase but due to decreased flow rate, residence time of dissolved nutrients will be expected to vary. However, both these factors would not be at play during pre-monsoon. Surface water samples were collected from 0.5 m depth using wide mouthed pre-cleaned HDPE amber bottles of 1 l capacity (Tarsons, India) and immediately fixed with 4% buffered formaldehyde (Merck, India) in case of PS and SW stations across all studied sites spanning over the three seasons. Further, 50 ml of surface water samples were collected from 0.5 m depth in triplicates to estimate dissolved nutrients.
Measurement of in situ environmental parameters
In-situ environmental parameters were measured in triplicates at each sampling station by using hand held instruments. Measured environmental parameters included air temperature (AT) and surface water temperature (SWT) (Digi-sense RTD meter 20250-95, single Input thermometer with NIST-Traceable Calibration), dissolved oxygen (DO; Oakton DO 6+, Eutech Instrument Pte Ltd, Singapore), pH (Oakton pH 5+, Eutech Instrument Pte Ltd, Singapore), electrical conductivity and TDS (EC; HM digital EC/TDS/TEMP COM-100 Myron L Company). All instruments were calibrated in the laboratory followed by in the field to obtain accurate results. Total depth of the water was measured using a graduated yardstick and was noted only for stations where the bottom sediment could be attained.
Estimation of dissolved nutrients
Collected surface water samples were analysed immediately for dissolved nutrients. All samples were pre-filtered using a 0.45 μm 25 mm nitrocellulose filter paper (Merck Millipore, Germany). Inorganic nutrients were analyzed as specified by the Guidelines of Water Quality Monitoring, CPCB which states that inorganic nutrients including nitrate, nitrite and phosphate be measured to determine WQI for surface water of perennial rivers. From filtered water samples, dissolved nitrate (Finch et al 1998), dissolved nitrite (Strickland 1972) and dissolved ortho-phosphate (Strickland 1972) concentrations were determined using a UV–vis spectrophotometer (U2900, Hitachi Corporation, Japan). All estimations were performed in triplicates.
Estimation of suspended particulate matter (SPM) and Chlorophyll-a (Chl-a)
Surface water samples were filtered in 0.45 μm 47 mm nitrocellulose filter paper (Merck Millipore, Germany) and sediment collected on the filter paper was dried overnight at 60 °C. The difference between the wet weight and dry weight of the filter paper was considered as the SPM (Harrison et al 1997). For estimation of Chl-a pigment, surface water samples were filtered through a 0.45 μm 47 mm nitrocellulose filter paper. The filter paper was kept overnight in 90% acetone (Merck, India) at 4 °C in dark. After 16 h of incubation, the samples were centrifuged for 10 min at 5000 rpm at 4 °C and the extract was scanned in a UV–vis spectrophotometer at 665 nm, 645 nm, and 630 nm (Strickland 1972).
Estimation of total hardness and total alkalinity
Surface water samples were filtered on 0.45 μm 47 mm nitrocellulose filter paper and total hardness was estimated using a pre-calibrated kit following manufacturer's protocol (Labard Aquasolve, Labard Instruchem Pvt Ltd, India). Total alkalinity was measured by titration method using 0.02 N H2SO4 as titrant and bromocresol green as an indicator. Following reaching end point, the indicator changed colour from blue to yellow.
WQI calculation
Four parameters namely DO, pH, EC and dissolved nitrate were selected for calculation of WQI of the studied stations. These parameters could significantly vary between the PS and SW stations and also can show strong seasonal variation owing to the nature of the stations. Any variation in these parameters would directly influence the functional capacity of the resident biological communities including microbes, thereby strongly altering water quality, ecosystem processes and in turn deteriorate overall ecosystem level health. Additionally, these parameters were chosen as per the general monitoring parameters for perennial rivers outlined in the Guidelines for Water Quality Monitoring document specified by CPCB. WQI was calculated using the River Ganga Index of Ved Prakash et al (1990 as cited in Abbasi and Abbasi 2012) which is based on the formula:

Where Ii denotes subindex for the ith water quality parameter, Wi is the weight associated with ith water quality parameter, and p is the number of water quality parameters. Water quality criteria for categories B (organized outdoor bathing), C (drinking water source with conventional treatment), D (propagation of wildlife and fisheries) and E (irrigation, industrial cooling, and controlled disposal) were considered in this study.
Statistical analyses
Two way Analysis of Variance (ANOVA) was performed to statistically test observed variation in environmental parameters between PS and SW and among the three studied seasons. A non-metric multidimensional scaling (nMDS) ordination plot was generated using Euclidean dissimilarity in vegan version 2.5–5 (Jari Oksanen et al 2018) in R-3.5.3 to check for clustering patterns among the studied stations.
Results
Seasonal and spatial variation of environmental parameters
In-situ parameters
The measured environmental parameters of all studied stations are given in table S1 (available online at stacks.iop.org/ERC/3/075008/mmedia). The AT range in pre-monsoon (25.6 °C–41.3 °C) was higher than monsoon (24.3 °C–36.3 °C) and post-monsoon (19.8 °C–32.8 °C) seasons across all the studied stations representing PS and SW. SWT values showed seasonal trend like AT (pre-monsoon: 22.4 °C–35 °C, monsoon: 22.1 °C–34.6 °C, post-monsoon: 19.2 °C–24.3 °C). Both AT and SWT did not show any significant difference between PS and SW but was significantly different between the sampling seasons (p > 0.001) (figure 2(a)).

Figure 2. (a) Box plot showing seasonal variations in AT, SWT, Chlorophyll-a and nitrate concentrations recorded from the studied stations along the lower stretch of River Ganga. (b) Box plot showing seasonal variations in DO, pH, nitrite and o-phosphate concentrations recorded from the studied stations along the lower stretch of River Ganga. (c) Box plot showing seasonal variations in TDS, EC SPM, Hardness and Total Alkalinity recorded from the studied stations along lower stretch of the River Ganga.
Download figure:
Standard image High-resolution imageFor the PS stations DO ranged from 2.4 to 6.8 mg l−1 in pre-monsoon season. The PS stations of Dakshineswar and Kolkata exhibited lowest recorded values of DO whereas higher values were recorded in Tribeni and Halisahar. Except for Kol_Stn6_PS, all stations of Kolkata recorded DO values >4 mg l−1 (table S1). In monsoon, DO values decreased for the PS stations of Halisahar, Kolkata, Tribeni and Kalyani with DO >7 mg l−1 recorded in Chandannagar. For all PS stations, DO values in post-monsoon increased to >4 mg l−1. This trend was not observed for the SW stations. In pre-monsoon, DO values ranged from 3.9–7.53 mg l−1 which remained similar in monsoon (4.2–7.3 mg l−1) and post-monsoon (5.4–8.9 mg l−1). The recorded DO values were found to be significantly different between PS and SW stations and in studied seasons (p > 0.001) (figure 2(b)).
The recorded pH values during pre-monsoon in the PS stations ranged from 6.4–8.7 with lowest values recorded in Dakshineswar as well as Kolkata and highest values in Naihati. In monsoon, pH ranged from 6.8 to 8 with the lowest values recorded in Kolkata, Naihati and Kalyani and highest in Naihati (table S1). In post-monsoon, pH ranged from 5.3–9.3 with the lowest values recorded in Dakshineswar and highest in Tribeni. The pH values of SW stations showed trends similar to PS stations. In pre-monsoon, pH ranged from 6.83 to 8.75 with Kolkata and Kalyani showing low pH and Naihati and Halisahar showing high pH. In monsoon, the pH ranged from 6.43- 7.4 with lowest in Barrackpore and highest in Kolkata. In post-monsoon, pH ranged from 6.6 to 9.3 with lowest in Naihati and highest in Tribeni. The pH of water was not significantly different between PS and SW but showed significant difference between seasons (p > 0.001) [figure 2(b)]. During monsoon, water pH for most stations of PS and SW ranged between 7 and 8.
The EC of water exhibited wide variability between the stations [figure 2(c) and table S1]. In pre-monsoon, EC ranged from 113–808 μS cm−1 for PS stations which decreased in monsoon (68.7–353 μS cm−1) but subsequently increased in post-monsoon (194–676 μS cm−1). Recorded EC values in SW was similar to PS. Values in pre-monsoon ranged from 172–242 μS cm−1, monsoon ranged from 128–146 μS cm−1 and post-monsoon ranged from 170–306 μS cm−1 (table S1). In pre-monsoon, between the PS stations, EC showed a wide range of values that were significantly different (p > 0.001). EC was also significantly different between the PS and SW stations and also between the studied seasons (p > 0.001) [figure 2(c)].
Total dissolved solids (TDS) ranged from 113–538 ppm in pre-monsoon across the PS stations whereas in monsoon it ranged from 27.4–310.3 ppm and in post-monsoon it was 93.7–321 ppm (table S1). TDS recorded in the SW stations showed similar trend to values recorded in PS. In pre-monsoon, TDS ranged from 113–248 ppm which showed a marked decrease in monsoon (27–68.9 ppm) and post-monsoon seasons (78–133 ppm). The recorded TDS values were significantly different between the PS and SW stations (p > 0.001) and between the studied seasons (p > 0.001) [figure 2(c)].
Total suspended particulate matter (SPM) ranged from 3.2–395 mg l−1 in pre-monsoon for PS stations which increased to 31.1–609.3 mg l−1 in monsoon and 24.3–618.4 mg l−1 in post-monsoon (table S1). For the SW, values ranged from 3.2–357 mg l−1 in pre-monsoon, 43.5–752.8 mg l−1 in monsoon and 12.3–162.9 mg l−1 in post-monsoon. SPM load in the surface water was significantly higher in monsoon compared to the other seasons (p > 0.001) but not between PS and SW stations of the studied sites [figure 2(c)].
The measured total alkalinity in PS stations ranged from 138.2–386.7 mg l−1 CaCO3 in pre-monsoon, 46.7–400 mg l−1 CaCO3 in monsoon and 136–330 mg l−1 CaCO3 in post-monsoon (table S1). In SW, the values ranged from 106.7–293.3 mg l−1 CaCO3 in pre-monsoon, 96.7–160 mg l−1 CaCO3 in monsoon and 160–210 mg l−1 CaCO3 in post-monsoon. The obtained values indicated significant difference between PS and SW (p > 0.001) and between the seasons (p > 0.001) [figure 2(c)].
The values for total hardness ranged from 125–250 ppm CaCO3 in pre-monsoon, 50–250 ppm CaCO3 in monsoon and 125–275 ppm CaCO3 in post-monsoon representing the PS stations. In SW, total hardness values ranged from 100–175 ppm CaCO3 in pre-monsoon, 50–150 ppm CaCO3 in monsoon and 125–200 ppm CaCO3 in post-monsoon. Total hardness showed significant difference between PS and SW and also between the seasons (p > 0.001) [figure 2(c)].
Profiles of Chl-a pigment
The concentration of Chl-a pigment ranged from 1.6–32.8 mg l−1 in pre-monsoon across the PS stations; lowest values recorded in Naihati (Nai_Stn3_PS) and Tribeni (Trv_Stn2_PS) (table S1). The profiles further changed during the monsoon season (0–21 mg l−1). In monsoon, Chl-a pigment could not be detected in three PS stations namely Hal_Stn2_PS, Hal_Stn3_PS, Trv_Stn1_PS, and Nai_Stn3_PS based on the adopted methodology. In the post-monsoon season Chl-a concentration for PS stations ranged between 6.9–2.8 mg l−1. For SW stations, the values ranged from 1.8–53.5 mg l−1 in pre-monsoon, 0–89.3 mg l−1 in monsoon and 18.9–54.3 mg l−1 in post-monsoon. During monsoon season, in four SW stations namely, Hal_Stn2_SW, Trv_Stn2_SW and Trv_Stn3_SW, Chl-a pigments were not detected. The observed concentrations of Chl-a were found to be significantly different between PS and SW stations (p > 0.05) and between the seasons (p > 0.001) [figure 2(a)].
Concentration of dissolved nutrients
In PS stations, dissolved nitrate concentration ranged between 32.32–646 μM in pre-monsoon, 60–335.56 μM in monsoon and 26.33–491.51 μM in post-monsoon (table S1). In pre-monsoon, lowest concentration was found in Naihati site (Nai_Stn2_PS) and highest in Dakshineswar (Dak_Stn3_PS). In monsoon, lowest concentration of nitrate was found in Hal_Stn3_PS and highest concentration in Nai_Stn3_PS. For the post-monsoon, lowest concentration was encountered in Kol_Stn1_PS and highest in Dak_Stn3_PS. In SW stations, dissolved nitrate ranged from 21.22–138.22 μM in pre-monsoon, 66.11–111.94 μM in monsoon and 24–148.06 μM in post-monsoon. In pre-monsoon, lowest concentration of nitrate was encountered in the station Cdn_Stn2_SW while highest was in Dak_Stn2_SW. In monsoon, lowest concentration was found in Trv_Stn4_SW and highest in Kol_Stn1_SW. During post-monsoon lowest concentration was found in Kol_Stn1_SW and highest in Hal_Stn1_SW. The observed variation in dissolved nitrate concentrations were significantly different between the PS and SW stations (p > 0.001) and also between the studied seasons (p > 0.001) [figure 2(a)].
The dissolved nitrite concentrations were generally found to be low in pre-monsoon (0–34.6 μM) in the PS stations (table S1). In pre-monsoon dissolved nitrite was not detected in five PS stations namely Brk_Stn2_PS, Cdn_Stn2_PS, Kol_Stn2_PS, Kol_Stn4_PS, Kol_Stn5_PS, Nai_Stn2_PS, Nai_Stn1_PS, and Nai_Stn3_PS. As part of this study, dissolved nitrite was found to be high in only one station, namely, Kol_Stn6_PS during the pre-monsoon season. In monsoon, dissolved nitrite ranged from 0.1–6.7 μM while in post-monsoon the values ranged between 0.1–3.9 μM. The trend was similar in the SW stations. Estimated dissolved nitrite concentration ranged from 0–3.6 μM in pre-monsoon, 0.15–3.97 μM in monsoon and 0.04–3.32 μM in post-monsoon. Dissolved nitrite concentrations did not show significant difference between the sites or between the stations [figure 2(b)].
The o-phosphate concentration ranged between 0.62–31.52 μM in pre-monsoon, 3.95–276.58 μM in monsoon and 1.07–117.1 μM in post-monsoon for PS stations. In pre-monsoon, o-phosphate was found to be highest in one of the PS stations of Halisahar site (Hal_Stn2_PS) and lowest in the Palta site (Pal_Stn1_PS). In one of the stations in Kolkata (Kol_Stn2_PS), o-phosphate was beyond detection limit. In monsoon, lowest concentration was encountered in a PS station of Chandannagar (Cdn_Stn3_PS) and highest in a station of Naihati (Nai_Stn3_PS). In post-monsoon, o-phosphate concentration was lowest in Kalyani (Kal_Stn1_PS) and highest in the same site (Nai_Stn1_PS). For the SW stations, in pre-monsoon concentrations were in the range of 0.06–11.12 μM, 2.89–22.63 μM in monsoon and 0.67–60.79 μM in post-monsoon. In pre-monsoon, o-phosphate was lowest in Cdn_Stn3_SW and highest in Kol_Stn5_SW. For the monsoon, lowest concentration was found in Cdn_Stn1_SW and highest in Trv_Stn4_SW. In post-monsoon, lowest concentration was found in Brk_Stn1_SW and highest in Cdn_Stn3_SW. The observed concentrations were significantly different between PS and SW stations (p > 0.001) and across studied seasons (p > 0.05) [figure 2(b)].
Water quality index (WQI)
Four environmental parameters namely pH, DO, EC and dissolved nitrate were used to calculate WQI and assign into B, C, D and E categories as per CPCB. In Kolkata, calculated WQI ranged from 24–44 in pre-monsoon, 27–36 in monsoon and 24–44 in post-monsoon (figure 3). This showed that the water quality of Kolkata PS and SW stations shifted from bad in pre-monsoon to very bad during monsoon with marginal changes in post-monsoon. No major change in WQI values were encountered in Kol_Stn4_SW between pre-monsoon and post-monsoon seasons. However, the WQI value of this station did decrease in monsoon (figure 3). In case of Kol_Stn5_SW of Kolkata there was no observable change in WQI values irrespective of the season of sampling. In Dakshineswar, WQI ranged from 24–41 in pre-monsoon, 30–33 in monsoon and 47–51 in post-monsoon. The WQI values indicated very bad water quality in pre-monsoon and monsoon for two stations namely, Dak_Stn3_PS and Dak_Stn3_SW in Dakshineswar. Both these stations exhibited WQI values indicative of bad condition in pre-monsoon which changed to very bad in monsoon. However, the WQI values of remaining stations of Dakshineswar ranged between medium to good condition during post-monsoon. In Barrackpore, WQI values in pre-monsoon ranged from 34–40 while in monsoon it ranged from 35–38 and subsequently changed to 33–42 in post-monsoon. In Barrackpore, Brk_Stn2_PS exhibited bad water quality across all the three seasons (WQI 33–35). For Palta site, WQI values in pre-monsoon were 14 while in monsoon it was 34–40 and in post-monsoon ranged from 36–52. In Palta, water quality of studied stations remained very poor throughout pre-monsoon and marginally improved in monsoon with the exception of one station (Pal_Stn2_SW). In post-monsoon, the water quality further improved through remained in the bad category except for Pal_Stn1_SW where the water was of medium to good condition based on WQI value. For the Chandannagar stations, WQI values ranged between 32–42 in pre-monsoon, 32–34 in monsoon and 34–44 in post-monsoon. All the PS stations of this site exhibited bad quality in both pre-monsoon and monsoon seasons (figure 3).
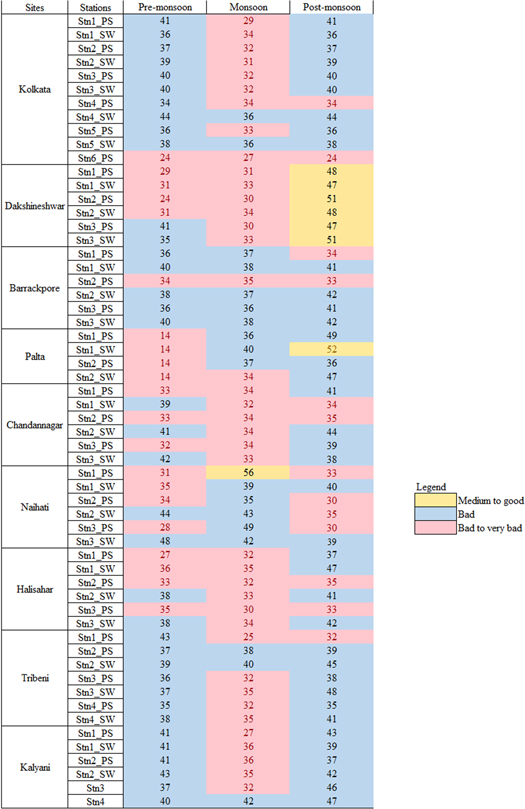
Figure 3. Seasonal variations in WQI of studied stations of lower stretch of the River Ganga. Corresponding colour indicate the water quality.
Download figure:
Standard image High-resolution imageFor Naihati, WQI values were found to range between 28–48 in pre-monsoon, 35–56 in monsoon and 30–40 in post-monsoon. In two stations of Naihati, Nai_Stn2_SW and Nai_Stn3_SW the water quality was relatively better compared to rest of the stations. The WQI values for Halisahar stations exhibited bad to very bad water quality irrespective of the season of sampling (pre-monsoon: 27–38; monsoon: 30–35; post-monsoon: 33–47) (figure 3). This type of WQI trends were also observed in Tribeni and Kalyani PS and SW stations across the studied seasons (figure 3).
Statistical analysis
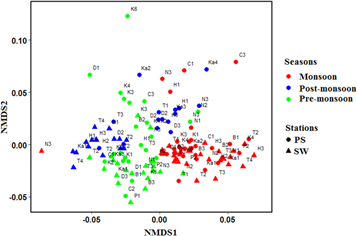
The nMDS ordination plot showed three distinct clusters (figure 4). The stations could be distinguished on the basis of pre-monsoon, monsoon and post-monsoon. There was greater overlap between the PS and SW stations in monsoon season. Both in pre-monsoon and post-monsoon, the clusters formed by PS and SW stations could be distinguished. As also seen by two-way ANOVA, the influence of monsoon on the environmental parameters was greater than the type of station.
Figure 4. Non-metric multidimensional scaling (nMDS) ordination plot showing three distinct clusters based on measured environmental parameters recorded in PS and SW stations of lower stretch of the River Ganga.
Download figure:
Standard image High-resolution image
Discussion
The lower stretch of the River Ganga that flows through West Bengal and is commonly referred to as Bhagirathi-Hooghly has 'very poor' water quality. Unchecked metal contamination originating from industrial effluents including tanneries along with rapid increase of coliform count has rendered the river water unfit for usage (Aktar et al 2010, Bhardwaj and Singh 2011, Sengupta et al 2014, Biswas et al 2015, Pandey and Singh 2017). Therefore, the main objective of this study was to understand the effect of seasonal influences including precipitation on environmental variables and resulting consequences on WQI. To address these questions, nine sites along 50 km stretch of the River Ganga were selected. Such baseline information on environmental variables and WQI had been clearly lacking for this stretch of the River Ganga which could be immensely important for river basin management and beyond such as the Ganga-Brahmaputra-Meghna delta system. Large variation in environmental parameters was expected in lower stretch of the Ganga due to huge amount of freshwater input during the monsoon season from the southwest monsoon (Ghosh and Bhadury 2018). In 2019 the year of sampling, collectively lower stretch of the Ganga received approximately 3600 mm of rainfall from southwest monsoon (Indian Meteorological Department). For example, the average precipitation in monsoon was much higher (1148.2 mm) compared to the other seasons of 2019 (pre-monsoon: 226.8 mm; post-monsoon: 215.5 mm) (data not shown). The studied PS and SW stations across selected sites distinctly showed the influence of seasonal precipitation on air temperature with significantly lower temperatures being recorded in monsoon (24.3 °C–36.3 °C) compared to pre-monsoon (25.6 °C–41.3 °C). Subsequent influence of air temperature on SWT profiles, in particular during monsoon season was clearly evident as part of the study. The observed influences of monsoonal precipitation compared to other seasons were visible in many of the measured environmental variables. For example, DO values decreased in a number of stations representing a number of sites including Halisahar, Kolkata, Tribeni and Kalyani during monsoon and improved during the post-monsoon (table S1). Seasonal variation in DO appeared to be strongly influenced by monsoonal precipitation (as seen by two-way ANOVA) and negatively correlated with SWT. This could result from possible change in water depth and mixing during monsoon that can influence the atmosphere-water interchange of oxygen as reported in other studies (De la Paz et al 2007).
The current study was focused in developing seasonal baseline information for environmental variables in order to reliably calculate WQI and thus understand the seasonal trends of pollution across 50 km stretch of the lower part of River Ganga. The lower stretch of the river flows through four districts of West Bengal, namely, Nadia, North 24 Parganas, Hooghly and Kolkata. Such baseline information on environmental data and WQI with respect to seasonal scales have been clearly lacking for the lower stretch of this river. Nine sites were selected to study the major environmental variables at a seasonal scale. Due to heavy local precipitation and increased flow of freshwater from upstream of the river, residence time of dissolved nutrient concentrations would be strongly influenced as reported in other freshwater systems (Maya et al 2007, Wu et al 2016).
The studied PS and SW stations across selected sites distinctly showed the influence of seasonal precipitation on air temperature with significantly lower temperatures being recorded in monsoon compared to other studied seasons. Subsequent influence of air temperature on surface water temperature was clearly evident as part of the study. The observed variation in SWT would in turn influence other environmental parameters including dissolved nutrients and resulting consequences for biological communities such as photosynthetic organisms (expressed in terms of Chl-a concentrations). Additionally, heavy precipitation during monsoon could act in cohort resulting in complex dynamicity within the lower stretch of Ganga.
Pearson's correlation coefficient distinctly showed negative influence of SWT on concentration of dissolved nutrients including nitrate, nitrite and o-phosphate as well as other environmental parameters including DO. Such variation can alter the water quality by influencing individual WQI parameters. In this study it was also found that PS stations exhibited lower DO concentrations compared to SW stations. The low DO values highlight that the PS stations are more anthropogenically influenced (e.g. pollutants) compared to SW stations. Increased pollutants might inhibit physical dissolution of oxygen from the atmosphere into the water by inhibiting surface interactions. Additionally, it might be a deterrent to light penetration to the water which in turn would impact the resident phytoplankton communities that play a major role in generation of oxygen (De la Paz et al 2007). Concentration of DO in surface water hence acts as an appropriate proxy for determining water quality. CPCB mandates that DO levels should be >5 mg l−1 for category B and >4 mg l−1 for category D. Though for most studied PS stations, DO levels were >4 mg l−1, some stations showed DO as low as 2 mg l−1 (e.g. Dakshineswar, Naihati and Kalyani). It would therefore be critical to set-up long term monitoring of these stations in order to understand the underlying causes of observed low DO concentrations. Such links between DO and high pollution levels have been also observed in other rivers in India (Chatterjee et al 2010). Incidentally, data from 1987 collected from sites including Tribeni, Halisahar, Naihati, Palta, Barrackpore and Dakshineswar report DO levels in close range to values found in 2019 (Mukherjee et al 1993). This indicates that the studied sites might be receiving high levels of pollutants from the industrial units and therefore more coordinated efforts are required to improve the quality of water in these sectors.
The average pH observed in the lower stretch of Ganga is lesser than the pH observed upstream of the river in Uttar Pradesh (Tiwari et al 2016) but exhibit trends similar to previous reports (Kar et al 2008). Unlike DO, pH was not found to vary significantly between PS and SW stations. Moreover, seasonal precipitation did not have a strong influence on pH as confirmed by Pearson's correlation coefficient. Overall in studied sites, the PS stations exhibited marginally lower pH values compared to SW stations. This could result from decomposition of organic matter present in untreated water which is directly getting discharged from municipal drains (Girija et al 2007). The recorded pH values remained within permissible limits except for Dak_Stn2_PS during all the studied seasons. In Dak_Stn2_PS, pH values ranged from 6.8–7.7 during the study period. This station (Dak_Stn2_PS) is located near the mouth of a big sewage drain that opens into the river directly and regular discharge of foul smelling black tainted water has been observed throughout the study period. Specific substances drained into the river could result in low pH (5.3) in Dak_Stn2_PS which could have also influenced other measured environmental parameters including EC. Other than this station, surface water of all studied stations has pH within the range of 6.5–8.5 and adhered to the pH criterion of WQI for Categories B, C, D and E.
Owing to the vast stretch of the Indo-Gangetic plain and extensive use of the plains as fertile agricultural lands, irrigation is largely dependent on the water supply from the river. The CPCB has a mandate to show that water for irrigation purposes should have EC values lower than 2250 mhos/cm. Water with high EC negatively impacts crop productivity by causing physiological drought-like conditions (Joshi et al 2009). The water with EC values less than 250 μmhos/cm is considered suitable for the purpose of irrigation but can become unsafe if the EC value reaches exceeds >750 μmhos/cm. As part of this study, the EC values recorded in the lower stretch of the Ganga were found to be lower than values reported from upstream of the river (Tiwari et al 2016). Studies focused on the sectors of Ganga representing Kanpur, Allahabad and Varanasi have recorded EC >500 μmho/cm. Studies in Kanpur, Allahabad and Varanasi have recorded EC to be >500 μmho/cm which could possibly result from the high pollution levels in these areas. Thus EC could act as a suitable proxy to gauge water pollution along Ganga. In the studied sites, EC values were lower in the SW stations than the PS stations. But the EC in the PS stations decreased substantially during monsoon season which might be a result of dilution effect due to huge freshwater input. This was also observed in WQI studies in other sectors of Bhagirathi-Hooghly (Kar et al 2008) and also in the Brahmaputra (Girija et al 2007). Furthermore, mixing of water also appears to decrease EC values as the SW stations which lie in close proximity to PS stations show lower EC values than the PS stations. This indicates that mixing of water due to horizontal flow velocity could disperse the ions and help improve water quality. The relatively higher EC values in the downstream stations including Kolkata may be due to salt water intrusion from the Bay of Bengal. High EC values also coincided with high TDS in the studied stations as also shown by Pearson's correlation efficient.
The TDS values in the PS stations in lower stretch of Ganga were substantially lesser than values recorded upstream (Tiwari et al 2016). Water with TDS >450 mg l−1 is considered good whereas with values <2000 mg l−1 is unsuitable for irrigation. TDS remained higher in the PS stations than SW but the recorded values were lower in monsoon than pre-monsoon and post-monsoon. The effect of monsoon precipitation on the observed TDS values across the sites was clearly evident in this study. Reduced water flow during the dry months of pre-monsoon can result in accelerated sedimentation and thereby increase TDS (Rahman et al 2000). Additionally, higher TDS in PS stations possibly indicates presence of small sized particles (>2 μm) that is being released into the river water from multiple sources including municipal sewage and industrial effluents. In addition to urban anthropogenic impacts, intense local agricultural activities which give rise to variability in surface run-off also strongly influences TDS values (Tafangenyasha and Dube 2008, Kalavathy et al 2011). Both factors in cohort could result in consistently higher TDS values observed across PS seasons during pre-monsoon and post-monsoon. Presence of TDS in water essentially helps to maintain cell density and thereby high TDS concentrations could shrink the cells in size and influence survivability (Southard 2006). Polluted stretches along Narmada River in India and Potrero de los Funes River in Argentina also report similar TDS values indicating the possible link between pollution and TDS (Jindal and Sharma 2010, Gupta et al 2017). Similar to TDS, load of SPM in the studied stations was also impacted by monsoonal precipitation. Faster river flow and increased freshwater input results in greater mixing of water with the underlying sediment resulting in high SPM load in the water column. Seasonal precipitation in the upstream of the River Ganga washes down more sediment to the lower stretches and also contributes to the SPM during monsoon. High SPM load affects light attenuation and thereby affects the density and distribution of phytoplankton cells (e.g. He et al 2017). This could affect the DO concentrations in the water (Verma et al 1984) and in particular have a cascading effect on higher trophic levels in the Ganga. Hence, rapid changes of SPM in the surface water could also adversely impact WQI including at seasonal scales across the studied stations of Ganga.
Seasonal and site specific changes in total alkalinity and its subsequent affects have been studied in many rivers in India including Brahmaputra (Girija et al 2007), Narmada (Gupta et al 2017), Damodar (Chatterjee et al 2010) and Gomti (Singh et al 2004). In the current study, total alkalinity was lower in monsoon compared to both pre-monsoon and post-monsoon seasons. Precipitation often adds acidic compounds to the surface water in the form of acid rain or by causing greater dissolution of atmospheric carbon dioxide and airborne pollutants such as sulphur and nitrogen oxides (Farley 2004). Measured values indicated high alkalinity at PS compared to SW stations. Alkalinity is contributed by presence of carbonates, bicarbonates and hydroxides in the water and is often contributed by untreated industrial effluents and residential waste coming from construction sites. Total alkalinity is also strongly influenced by presence of aquatic plants. Low alkaline water could be corrosive in nature (Ohlrogge 2004), indicating poor water quality and making it unfit for usage. Dissolved divalent ions including calcium, magnesium, strontium, iron and manganese released from industries also impact total hardness along with alkalinity. Consequently, PS stations showed higher total hardness compared to SW in the lower stretch of the Ganga. Total hardness observed in the studied stations was similar to values and trends recorded in the upstream of the River Ganga including in Kanpur, Allahabad and Varanasi (Tiwari et al 2016) and River Gomti (Singh et al 2004) but is higher than rivers such as Damodar (Chatterjee et al 2010). The recorded values indicated lower trend in monsoon compared to other seasons both in the upstream of Ganga (Trivedi et al 2010, Tiwari et al 2016).
Due to heavy local precipitation and increased flow of freshwater from upstream of the river, residence time of dissolved nutrient concentrations would be strongly influenced as reported in other freshwater systems (Maya et al 2007, Wu et al 2016). Seasonal precipitations also alter the concentrations of dissolved macronutrients including nitrate and o-phosphate and micronutrients such as nitrite. International standards allow a phosphate concentration limit of 0.1 mg l−1 (US EPA 1986). Surface run-off from agricultural fields adds nitrogen and phosphorus to the surface water due to rampant usage of NPK fertilizers in the fields. Subsequently, the concentration of o-phosphate was higher in monsoon compared to pre-monsoon and post-monsoon. Phosphates are also enhanced due to degradation of dissolved organic matter and from leaching of the bed rock. Human and animal waste along with untreated industrial effluents also releases a large amount of phosphate into the surface water which is indicated by the significantly higher concentrations of o-phosphate recorded in the PS stations compared to SW. High o-phosphate concentrations could explain the higher density of plants noted in most PS stations as plant growth is enhanced in presence of o-phosphate (Donnelly et al 1998). High o-phosphate concentrations also result in eutrophication from growth of algae and macrophytes resulting in poor DO and bad water quality (Rutherford et al 1991, Davie 2003, Bellos and Sawidis 2005). High o-phosphate concentration resulting in poor water quality has been observed in both rivers of India including in Brahmaputra (Girija et al 2007), other stretches of Ganga (Tiwari et al 2016), Gomti (Singh et al 2004), Mahanadi (Panda et al 2006) and Narmada (Gupta et al 2017). Nitrogen (nitrite and nitrate) is also added to surface water from agricultural activities (Nas and Berktay 2006). The effects of increased concentration of nitrogen in the water are similar to that of o-phosphate resulting in decreased dissolved oxygen levels and eutrophication. BIS and WHO specify a limit of 45 mg l−1 nitrogen in the water. All studied stations of the lower stretch of Ganga had dissolved nitrogen concentrations much lower than the specified safe limits. In the PS stations, highest nitrogen concentrations were observed in post-monsoon (average 10 mg l−1) compared to monsoon (6 mg l−1) and pre-monsoon (5 mg l−1) whereas in SW stations, monsoon had highest nitrogen concentrations (5 mg l−1) compared to pre-monsoon (3 mg l−1) and post-monsoon (4 mg l−1). The PS stations also had marginally higher nitrogen concentrations than SW stations. This is possibly due to addition of nitrogenous compounds from municipal and industrial effluents. At the same time, concentration of nitrogen in the surface water during monsoon would be controlled by critical balance between increased terrestrial run-off and dilution in higher water volume (Causse et al 2015). Concentrations of dissolved nutrients in turn control the abundance of biological communities in the surface water. Chl-a was used as a proxy to understand the abundance of phytoplankton in the surface water of studied stations of Ganga. It was found that the concentration of Chl-a in PS stations was significantly lower than that of pre-monsoon and post-monsoon. This could be due to higher SPM during monsoon that affects light attenuation and subsequently makes the environment unfavourable for higher phytoplankton density (Northcote et al 2005, Hu et al 2007). However, in the SW stations, monsoon season recorded higher Chl-a concentrations which could result from higher nutrient concentrations at these stations, lower SPM and TDS that could allow greater light penetration at the SW stations compared to PS. Additionally, the lower concentration of Chl-a in PS stations could indicate lower phytoplankton density and hint toward possible unfavourable conditions owing to very bad water quality at these stations. Indeed, phytoplankton diversity was found to be lower in PS stations compared to SW stations (data not shown). Therefore, Chl-a as well as other biological indices can be used as a proxy to study water quality and understand the relationship with other key environmental variables including effect of monsoonal precipitation.
The use of environmental parameters and biological community information can provide deep insights into the quality of the water and in turn can help towards understanding health of the river ecosystem. Four environmental parameters including DO, pH, EC and dissolved nitrate were used to calculate WQI of the lower stretch of the Ganga. The WQI values indicated bad water quality at most of the studied stations. PS stations showed significant worse water quality than the SW stations. Furthermore, WQI values indicated the deteriorating quality of water with monsoon at most stations such as in Kolkata, Dakshineswar, Chandannagar, Halisahar, Tribeni and Kalyani. This could be due to flushing of water which influenced many of the environmental parameters as well as concentration of macronutrients. During post-monsoon, water quality was seen to improve in Dakshineswar site based on WQI values. However, collectively, the lower stretch of Ganga appears to represent bad water quality that is unfit for usage under Category B, C, D and E of CPCB. The calculated WQI values are at par with previous datasets published from the lower stretch of this river. Kar et al (2017) reported WQI within the range of 56–78 from bathing ghats of Howrah and North 24 Parganas. The authors also reported very poor water quality, especially from Dakshineswar, a site popularly used for bathing purposes, indicating the direct influence of anthropogenic activities on WQI. Similar results were obtained using artificial neural network analysis where the authors reported poor water quality alone the lower stretch of Bhagirathi-Hooghly due to pollutants from both domestic and industrial sources (Sinha and Saha Das 2014). The obtained WQI also falls within the same range as reported from the upper stretches of River Ganga including in Haridwar, where an eleven year study indicated poor water quality with WQI ranging between 51–74 (Bhutiani et al 2014). Assessment in Rishikesh has also indicated poor water quality (Upadhyay and Chandrakala 2017). The authors attributed the poor water quality to discharge of sewage, solid and liquid waste contaminants and other organic waste materials. Poor water quality in the River Ganga, including in upstream sites in Uttar Pradesh and Uttarakhand has resulted in the spread of exotic invasive fish species such as Cyprinus carpio (European carp), Oreochromis niloticus (Nile tilapia) and other catfishes. This led to hindrance for growth and survival of populations of other native fishes (Bhutiani et al 2014, Tiwari et al 2016). Rapid changes in water quality therefore appear to have cascading effects on the health of the ecosystem and also on human lives that are directly dependent on the river for survival. The WQI values deduced in this study could be monitored in depth across larger spatial and temporal scales with integration of biological entities and subsequently modelled using deep learning approaches including artificial intelligence to control water pollution (Aldhyani et al 2020, Venkata Vara Prasad et al 2020).
Conclusions
Overall, this study for the first time provides much needed seasonal data of environmental parameters representing more than 50 km of the lower stretch of Ganga (point source and surface water stations) which can be used as benchmark for future long-term studies. The study clearly shows that monsoonal precipitation has a distinct influence on key environmental parameters such as DO, TDS and biological variables such as Chl-a. Moreover, in this study for the first time WQI was evaluated and highlight that the lower stretch of this river represents deteriorating water quality, albeit with some exceptions for some sites (e.g. Dakshineswar). However, the effect of monsoonal precipitation on improving WQI values were not evident highlighting local factors shape the observed trends. The study also justifies the need to adopt robust scientific approaches to clean the Ganga river basin and develop long-term ecological monitoring programs to assess the lower stretch of this river. Most importantly, the WQI developed for the Ganga River can prove to be useful for monitoring and improving basins and deltaic systems comprising major rivers of South Asia.
Acknowledgments
This work is supported by Department of Science & Technology (Govt. of India) grant [DST/TM/WTI/2K16/124] awarded to Punyasloke Bhadury. The authors thank the River Traffic Police of Kolkata Police for assistance during conducting sampling in Kolkata sector of the River Ganga. The authors would like to thank Manish Sutradhar for help with some of the sampling.
Data availability statement
All data that support the findings of this study are included within the article (and any supplementary files).