


Abstract
Rapid intensification (RI; ≥30 knots within 24 h) is an essential characteristic of a CAT 4–5 hurricane (≥115 knots). Between 1980 and 2018, interannual variability in CAT 4–5 hurricanes was strongly correlated with RI, both globally and in individual basins. The annual number of tropical cyclone RI events is a useful measure of global intense CAT 4–5 hurricanes. Here, singular value decomposition analysis was applied to sea surface temperature and the number of RI events throughout the world as calculated from best track data. The first two modes explained ~70% of the total covariance. The mode that dominated variability in global RI occurrence was primarily modulated by the El Niño southern oscillation and the Pacific decadal oscillation. The first mode indicated decreased RI activity in the North Atlantic and increased RI activity in the North Pacific except between 10°–30° N and 125°–135° E, and the corresponding sea surface temperature pattern matched the positive El Niño southern oscillation and Pacific decadal oscillation phases. For the second mode, RI occurrence increased in most parts of the active RI region though with some exceptions, and this was linked with global warming. These results suggest that interannul variability in TC RI events and the associated CAT 4–5 hurricanes are modulated by climate variability in the global scale.
Export citation and abstract BibTeX RIS

Original content from this work may be used under the terms of the Creative Commons Attribution 4.0 licence. Any further distribution of this work must maintain attribution to the author(s) and the title of the work, journal citation and DOI.
1. Introduction
Tropical cyclones (TCs) cause devastating loss of life and property and have severe long-term social and economic effects (Peduzzi et al 2012, Mendelsohn et al 2012). An increasing frequency of high intensity storms increases the risk of mortality (Peduzzi et al 2012). Rapidly intensified strong storms, such as Typhoon Hayian (2013) and Hurricane Patricia (2015), are particularly devastating examples of TCs. Rapid intensification (RI) is an essential characteristic of CAT 4–5 hurricanes (≥115 knots, 1 knot = 0.51 m s−1). CAT 4–5 hurricanes over the western North Pacific (WNP) are called super typhoons. The term RI was first defined by Kaplan and DeMaria (2003) to be when the maximum sustained surface wind speed increases by 30 knots or more in 24 h. Every CAT 4–5 hurricane in the Atlantic basin has at least one RI in its lifecycle (Kaplan and DeMaria 2003), and 79% of major hurricanes (≥96 knots) around the world have at least one RI event (Lee et al 2016) when RI is defined as intensification by more than 35 knots in 24 h.
Given favorable environmental conditions, TC internal dynamics is recognized as an important factor in RI processes (Hendricks et al 2010). Some studies suggest that intense convective bursts or hot towers are crucial to RI (e.g., Molinari and Vollaro 2010, Chen and Zhang 2013, Rogers et al 2015, Hazelton et al 2017, Chen et al 2018), while other studies argue that symmetric convective heating is more conducive to RI (e.g., Nolan and Grasso 2003, Nolan et al 2007, Jiang 2012). On the other hand, TC intensity change is also sensitive to environmental conditions. Environmental conditions are different between RI and weakening/neutral TCs (Hendricks et al 2010). Environmental conditions that favor RI over the North Atlantic are weak vertical wind shear, favorable upper-level forcing from troughs or a cold low, high sea surface temperature (SST), and high relative humidity in the lower troposphere (Kaplan and DeMaria 2003). In the western North Pacific, RI occurs when there is low-level monsoon confluence, and the onset of RI is marked by a split of upper-level flows into mid-latitude westerlies to the north and a sub-equatorial trough to the south of the TC (Ventham and Wang 2007).
Environmental flows play critical roles in controlling RI on the synoptic timescale, but climate variability affects RI variability at the interannual to interdecadal timescales. At the interannual timescale, RI occurs in the WNP more frequently in El Niño years than in La Niña years(Wang and Zhou 2008), mainly because tropical storm forms further east and south in El Niño years than in La Niña years (Wang and Zhou 2008, Fudeyasu et al 2018). Wang and Liu (2016) found that Pacific decadal oscillation (PDO) could modulate the effect of the El Niño southern oscillation (ENSO) on TC RI in the WNP. The annual number of RI events that occurs in the WNP is more closely correlated with the ENSO in the warm PDO phase than in the cold PDO phase. At the interdecadal timescale, RI variability over the WNP is negatively correlated with the PDO (Wang et al 2015). Zhao et al (2018) found that 25% more TCs in the WNP experienced RI between 1979 and 1997 than between 1998 and 2015 because of a mega-La Niña-like pattern between 1998 and 2015. However, Kang and Elsner (2019) found that global warming will markedly increase the proportion of TCs in the WNP that experience RI but that the ENSO will have relatively little effect on the proportion of TCs in the WNP that experience RI. For the North Atlantic (NA), Klotzbach (2012) found that RI is much more frequent in La Niña years than El Niño years and that the different phases of Madden–Jullian oscillation markedly affect the occurrence of RI. Wang et al (2017) analysed interannual and multidecadal variations in RI in the NA between 1950 and 2014 and found that the ENSO, Atlantic warm pool, and North Atlantic oscillation were well correlated with RI.
Previous studies of climate modulation of RI variability have mostly been focused on WNP and NA. The numbers of RI events that occur in both the WNP and Atlantic are affected by the ENSO, which suggests coherent variations of TC RI on global scale. In this study, we examine spatial and temporal variations in TC RI numbers at the global scale. A better understanding of the effects of climate variability on TC RI could improve our understanding of the mechanisms involved in the effects of climate change on intense storms.
2. Data and methods
A TC best-track dataset for the period 1980–2018 was obtained from the International Best Track Archive for Climate Stewardship. The best-track data included TC center locations and intensities recorded at 6 h intervals. Best-track data for the WNP, Southern Hemisphere (SH), and North Indian Ocean were provided by the Joint Typhoon Warning Center, and data for the eastern North Pacific (ENP) and NA were provided by the US National Hurricane Center. As suggested by Kaplan and DeMaria (2003), an RI event is defined as a change in intensity of 30 knots or more in 24 h. Since RI events were calculated from the 6-hourly best track intensity, one RI event in 24-h interval may overlap with another RI event (Kaplan and DeMaria 2003). Spatial–temporal variations in TC RI were investigated by converting the positions at which RI events occurred as recorded every 6 h from the best-track data into area-averaged RI event frequencies using a horizontal resolution of 2.5° × 2.5°. Extended reconstructed sea surface temperatures (SSTs) (Huang et al 2017) were obtained from the US National Oceanic and Atmospheric Administration National Centers for Environmental Information. Three climate indices were used. These were the global annual mean surface air temperature change index from the US National Aeronautics and Space Administration Goddard Institute for Space Studies, the Niño3.4 SST anomaly index, and the PDO index from the US National Oceanic and Atmospheric Administration National Centers for Environmental Information.
Singular value decomposition (SVD) analysis is an effective method for separating different coupled variability modes for two fields (Bretherton et al 1992). SVD analysis was performed on the TC RI and SST fields following a procedure described by Wang et al (2010) to study the effects of the climate on the global TC days. The period 1 December to 31 May was defined as the SH TC season, and the period 1 June to 30 November was defined as the Northern Hemisphere (NH) TC season, to reflect seasonality in TC activity. The calculated number of RI events for each grid was smoothed using a nine-point weighted smoother to decrease spatial discontinuity. Three sets of SVD analyses (of NH TC season-averaged, SH TC season-averaged and year-averaged RI and SST data) were performed to investigate year-to-year variations of global TC RI.
3. Results
3.1. Spatial–temporal TC RI distributions
The mean annual TC RI frequencies between 1980 and 2018 are shown in figure 1. A total of 630 CAT 4–5 hurricanes occurred between 1980 and 2018. At least one RI occurred in 96% of the CAT 4–5 hurricanes around the world. On average, a CAT 4–5 hurricane experienced 5.5 RI events. The WNP and ENP are the most likely basins in the world in which storms undergo RI and are the most active regions for TCs. The main region in which RI occurs in the WNP is east of the Philippines (10°–20° N, 125°–140° E). RI occurs most frequently in the ENP west of Mexico (12.5°–20° N, 95°–110° W). RI occurs infrequently in the NA compared with the WNP and ENP. The main regions in which RI occurs in the NA are 10°–20° N, 85°–15° W and the Gulf of Mexico. In the SH, RI occurs most often at latitudes between 5° and 20° S. In the North Indian Ocean, the TC RI frequency is higher for the Bay of Bengal than the Arabian Sea.
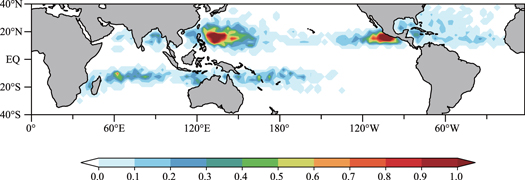
Figure 1. Mean annual tropical cyclone rapid intensification frequencies for a 2.5° × 2.5° grid between 1980 and 2018.
Download figure:
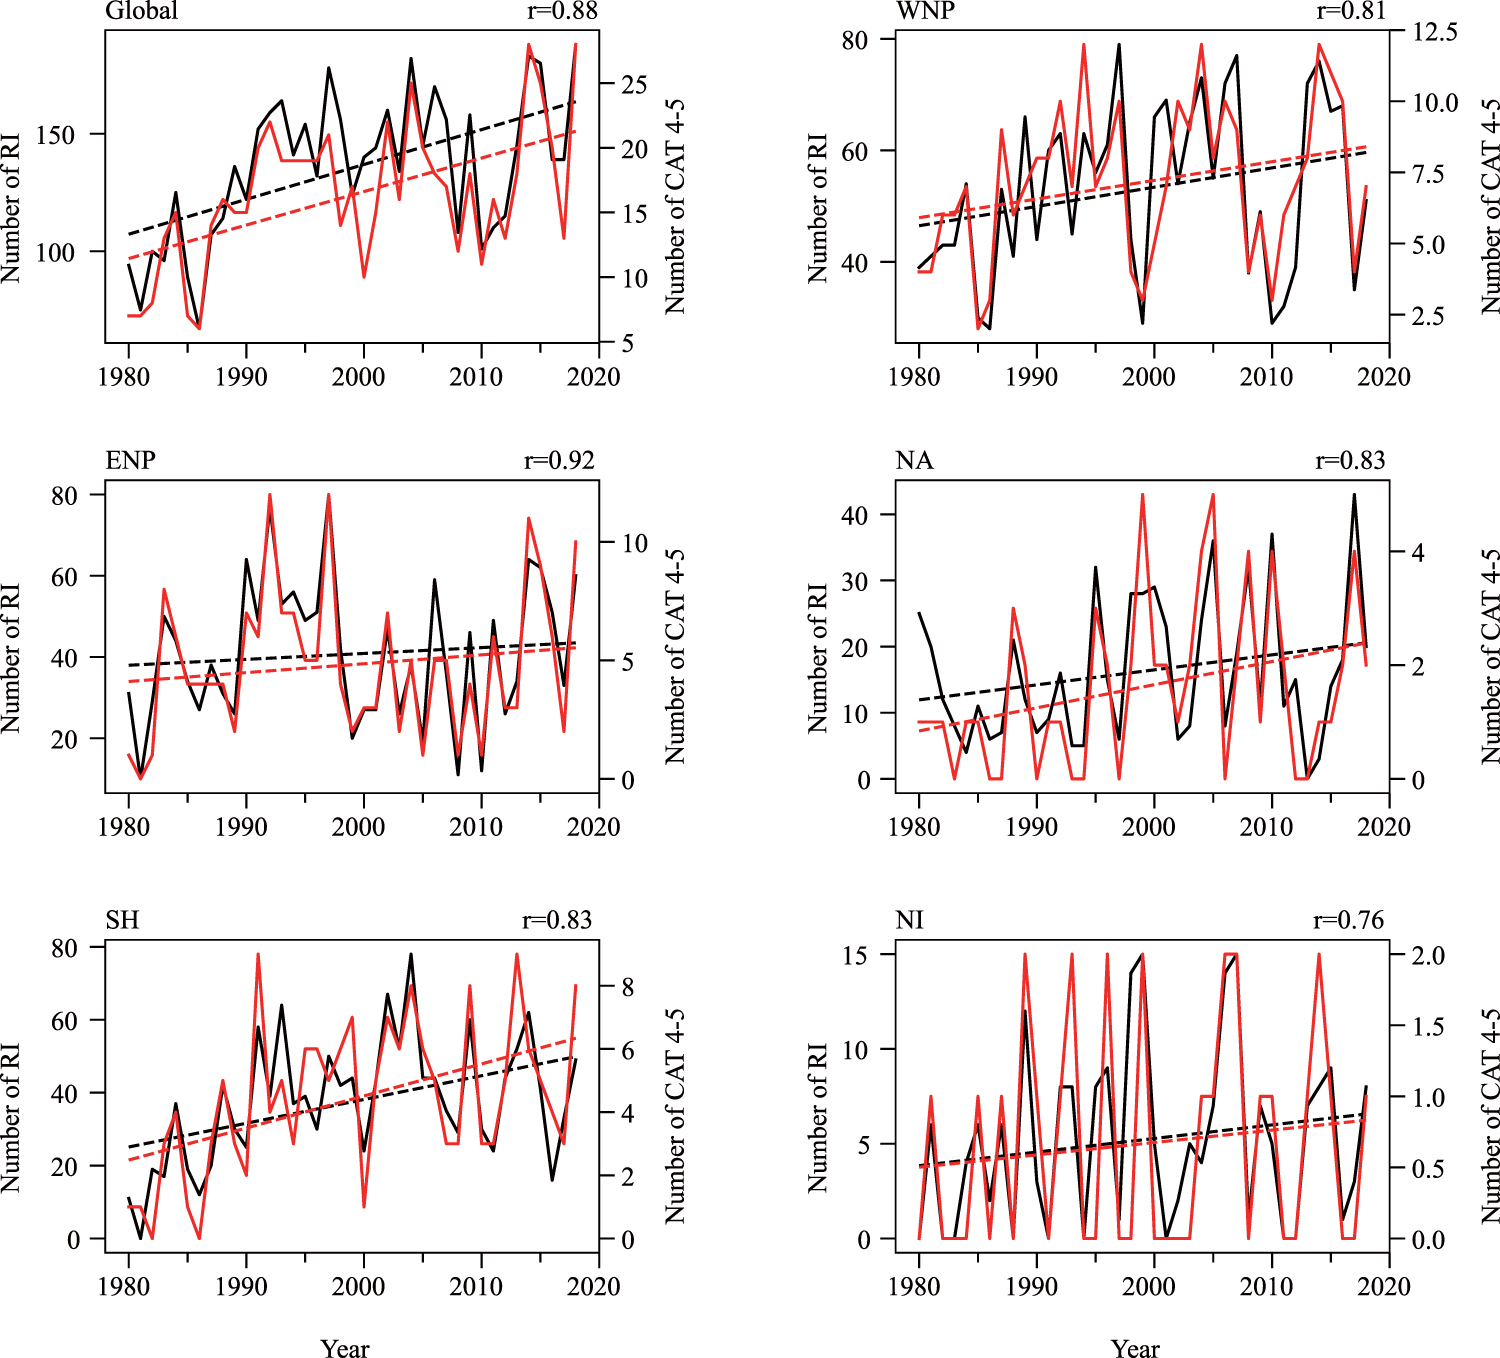
Standard image High-resolution imageThe numbers of RI events and of CAT 4–5 hurricanes throughout the world and in the individual oceans each year between 1980 and 2018 are shown in figure 2. During this period, both of the number of RI events and the number of CAT 4-5 hurricanes for the global ocean showed interannual fluctuations and increasing trends. There was a strong correlation between the number of RI events and the number of CAT 4–5 hurricanes (correlation coefficient 0.88). The increasing trend of the number of RI events is 14.8 per decade at the 95% confidence level, and the increasing trend of CAT 4-5 hurricanes over the globe is 2.6 per decade at the 95% confidence level. The RI frequency and number of CAT 4–5 hurricanes were strongly correlated for each basin, and the correlation coefficients for the ENP, NA, North Indian Ocean, SH, and WNP were 0.92, 0.83, 0.76, 0.83, and 0.81, respectively. This indicates the importance of RI in causing an individual storm to reach a high intensity and that frequent RI events are required for an entire basin to have more intense storms in the TC season. Although there were statistically significant increasing trends for the RI frequency and CAT 4–5 hurricane number for the global ocean, no significant trend was detected for RI frequency in all individual basins, except in the SH. The number of RI events in SH increased by 6.5 per decade, and the number of CAT 4–5 hurricanes in the NA and SH increased by 0.4 and 1.0 per decade, respectively, at the 95% confidence level. The South Indian Ocean was poorly sampled before the launch of the MeteoSat-7 satellite in 1998 due to a gap in the satellite viewing area (Kossin et al 2007), which may make the trend of RI and CAT4-5 hurricanes in the SH more significant. The number of CAT 4–5 hurricanes in the WNP increased by 0.7 per decade at the 90% confidence level.
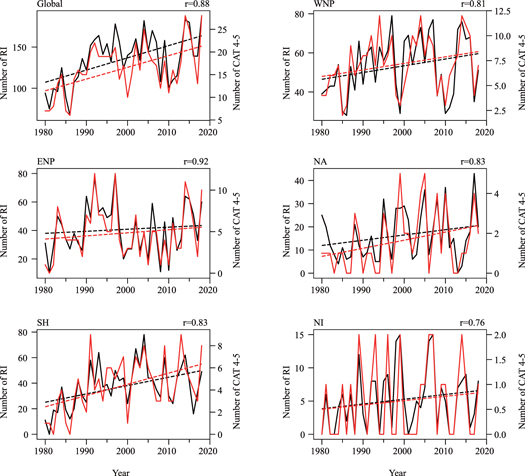
Figure 2. Temporal variation in the total number of tropical cyclone rapid intensification (RI) events (black solid lines) and CAT 4–5 hurricanes (red solid lines) throughout the world (global) and in the western North Pacific (WNP), eastern North Pacific (ENP), North Atlantic (NA), Southern Hemisphere (SH), and North Indian Ocean (NI). The black and red dashed lines are the trends in the numbers of RI events and CAT 4–5 hurricanes, respectively. The correlation coefficient (r) for the relationship between the number of RI events and CAT 4–5 hurricanes is shown for each subfigure.
Download figure:
Standard image High-resolution image3.2. Co-variability of RI and SST
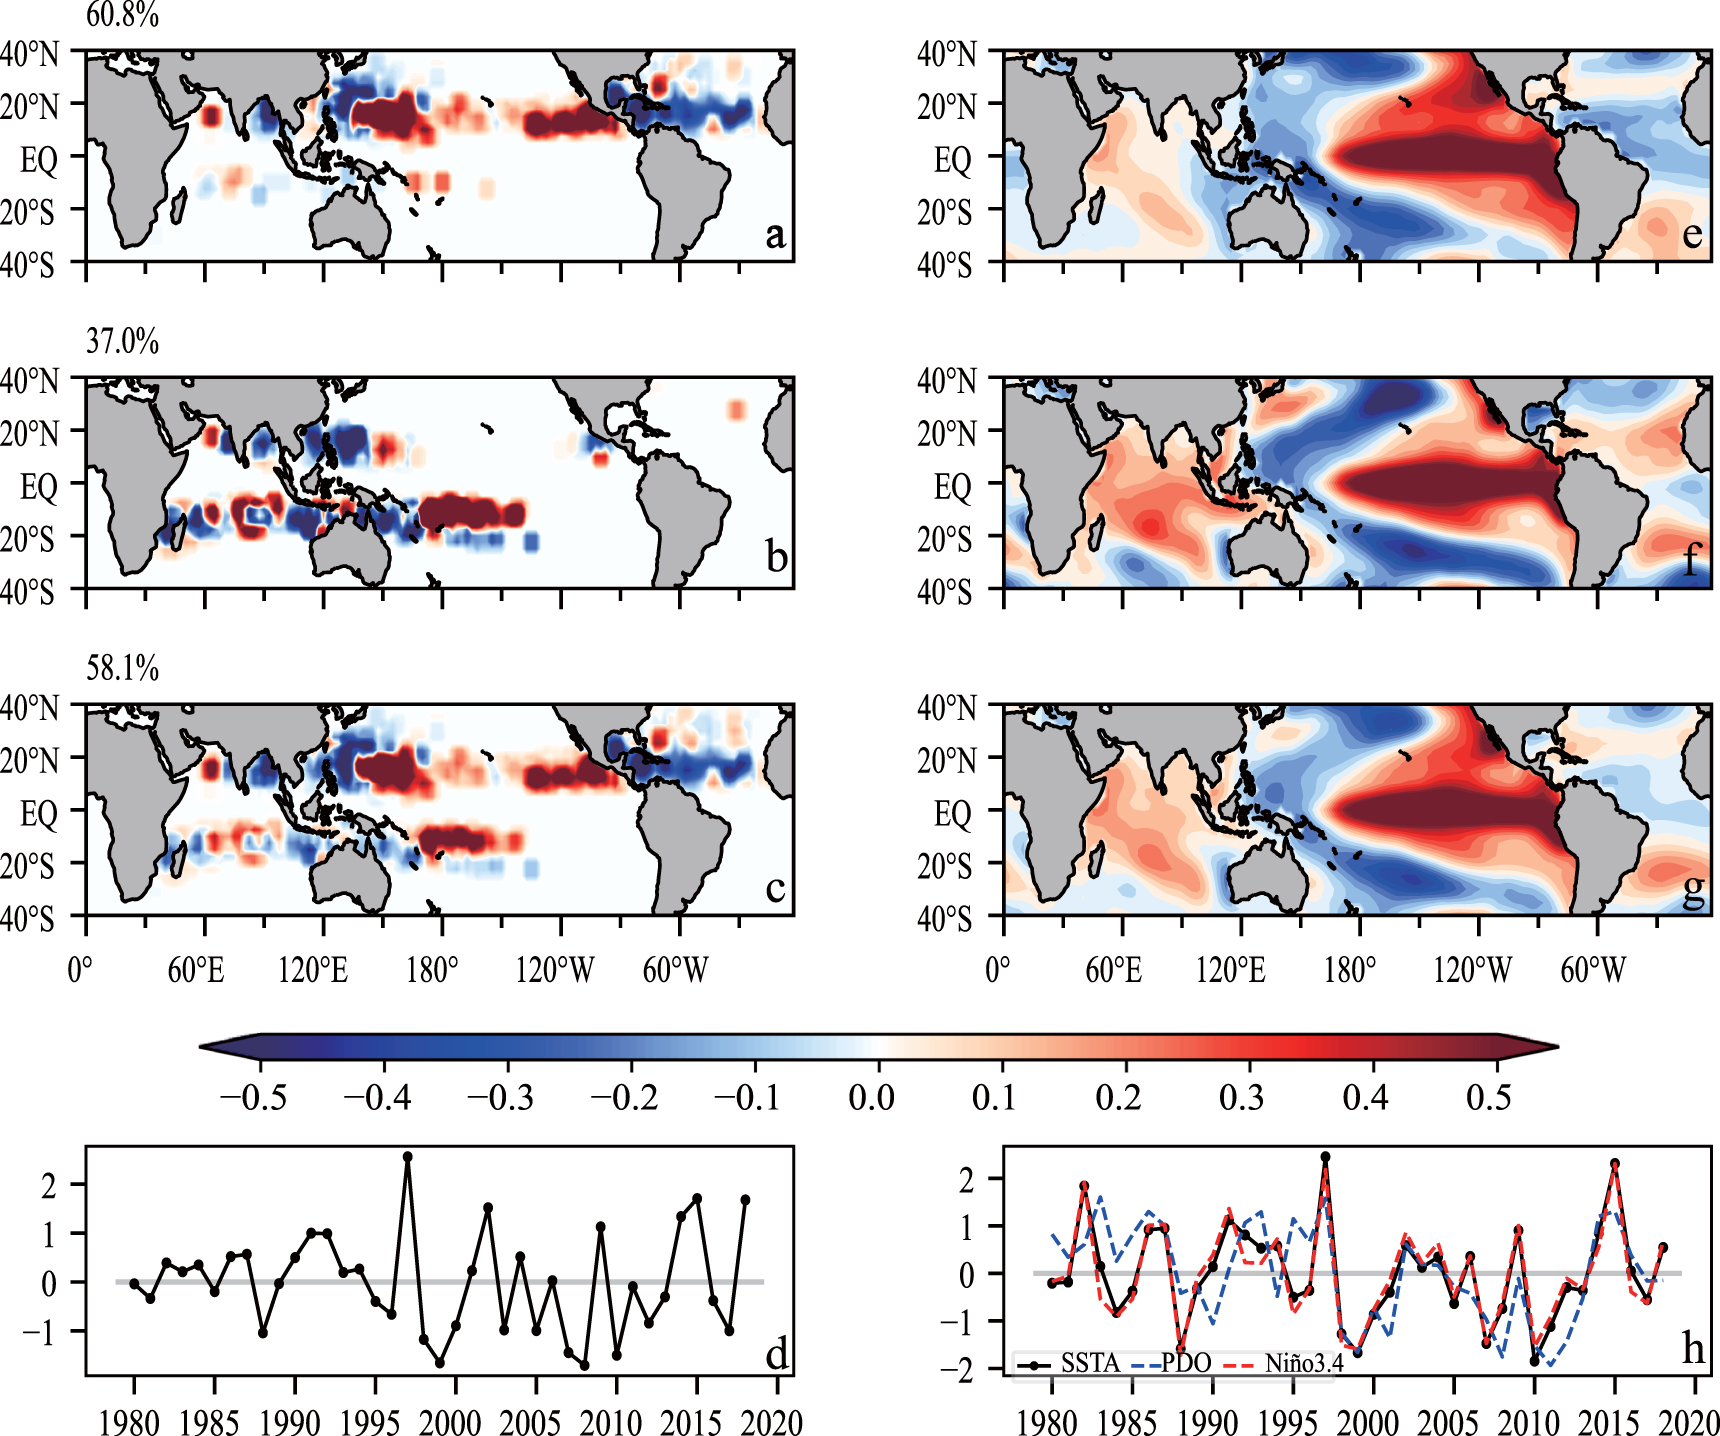
The distribution of the first SVD mode for the number of RI events and SST are shown in figure 3. SVD-1 accounted for 60.8%, 37.0%, and 58.1% of the total covariance in the NH TC season, SH TC season, and entire year, respectively. During the NH TC season (figure 3(a)), the number of RI events decreased in the NA and increased in the North Pacific except between 10°–30° N and 125°–135° E, where the number of RI events decreased. This area includes a large part of the most active region for RI (10°–20° N, 125°–140° E) in the WNP, as shown in figure 1, therefore the RI frequency in the WNP is sensitive to variability in RI events between the region to the east of the Philippines and the rest of the WNP. For the SH TC season (figure 3(b)), the number of RI events in the ocean north of Australia (5°–20° S, 100°–165° E) decreased. For the Central Pacific, the number of RI events increased between 5° and 15° S but decreased between 15° and 20° S. The number of RI events in the Bay of Bengal, South China Sea, and the ocean east of the Philippines in the SH TC season decreased. The first SVD pattern for the SST anomalies (figures 3(e)–(g)) was a combination of the ENSO and PDO patterns. The normalized Niño3.4 index and PDO index are shown in figure 3(h) to allow comparison of these indices with the time series for the first SST mode. The time series for the first SST mode highly resembles the Niño3.4 index time series. The time series of the first RI mode (figure 3(d)) is strongly correlated with the Niño3.4 index (correlation coefficient 0.82). The temporal evolution of the first SVD mode of the RI is statistically significantly correlated with the PDO index (correlation coefficient 0.60). This indicates that the first SVD mode is modulated primarily by the ENSO and secondarily by the PDO.
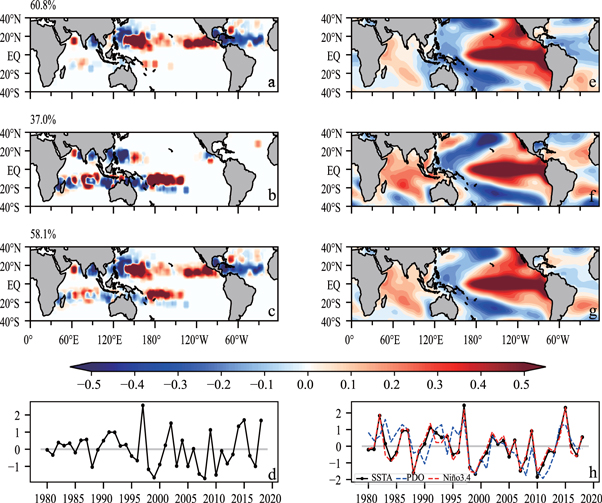
Figure 3. First singular value decomposition mode for tropical cyclone (TC) rapid intensification (RI) and sea surface temperature anomalies (SSTA). Spatial distribution of RI for (a) the Northern Hemisphere TC season, (b) the Southern Hemisphere TC season, and (c) the whole year. (d) Time series of TC RI. (e)–(h) are the same as (a)–(d) but for SSTA. The Niño 3.4 index (red dashed line) and Pacific decadal oscillation (PDO) index (blue dashed line) are plotted in (h).
Download figure:
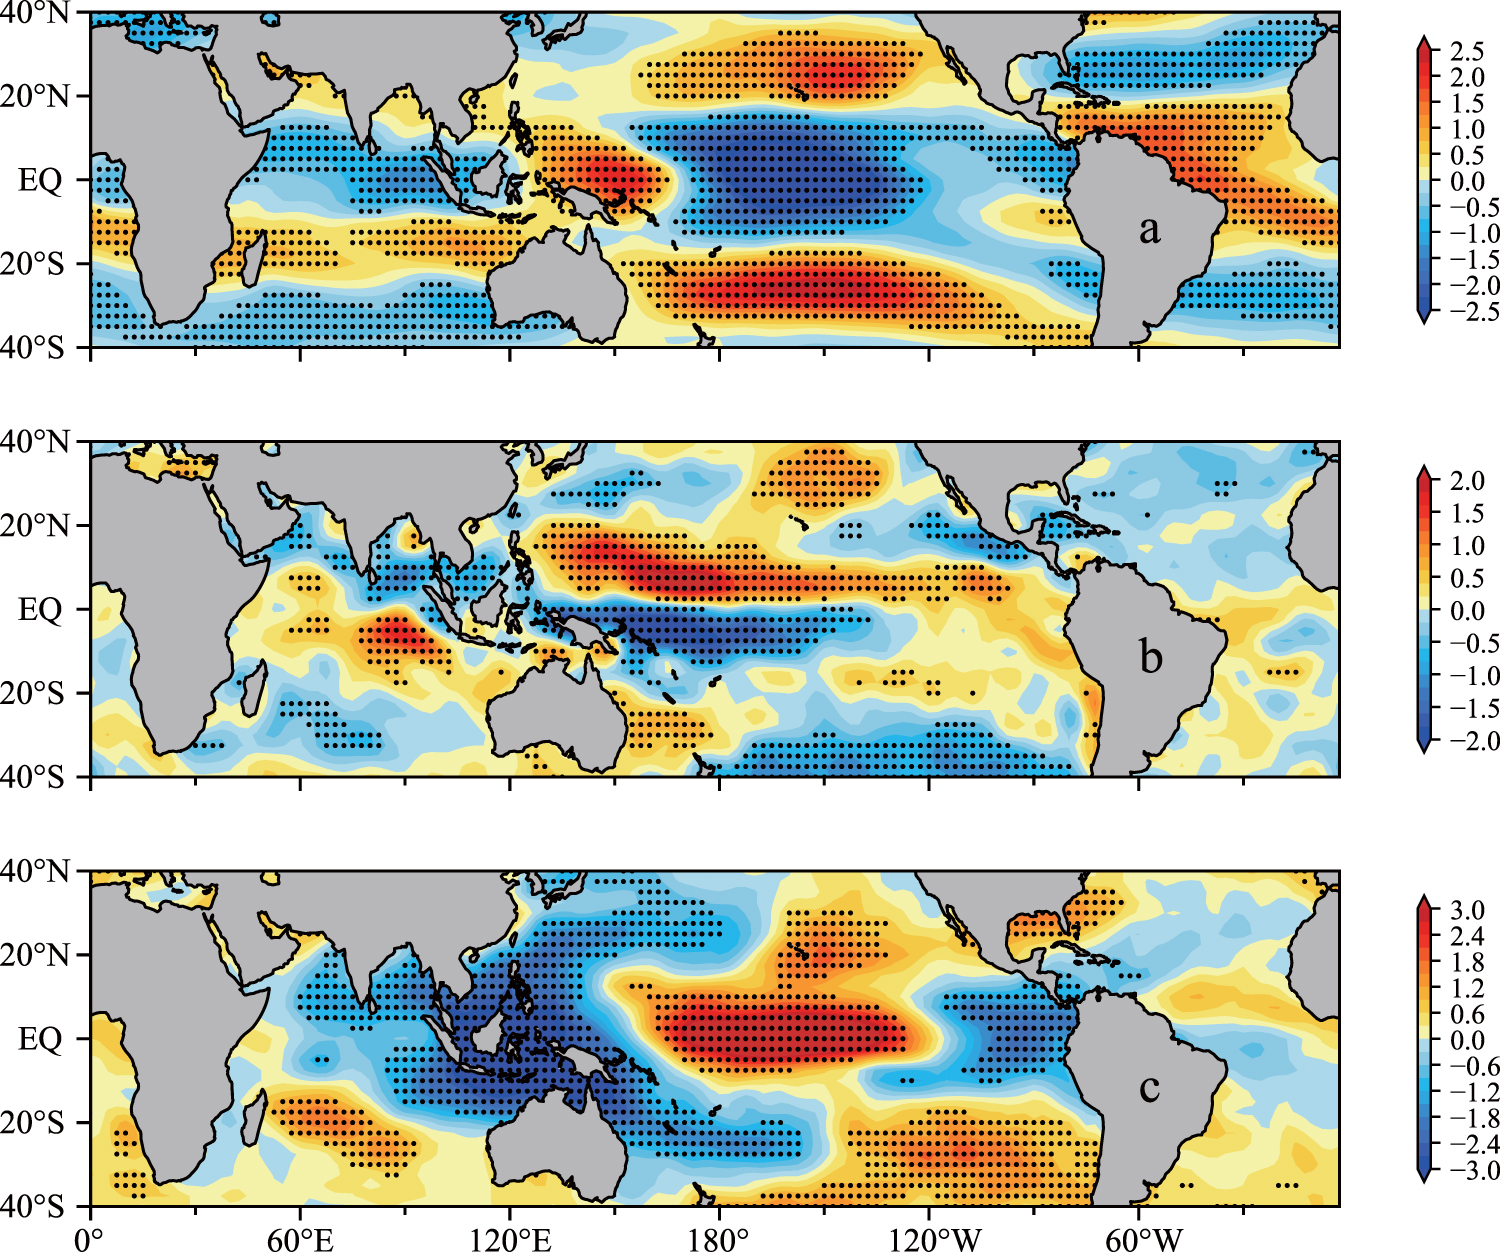
Standard image High-resolution imageTo examine how the SST anomalies associated with ENSO and PDO modulate the RI variability through environmental conditions, the regressions of annual mean vertical wind shear between 200 and 850 hPa, 850 hPa relative vorticity, and 600 hPa relative humidity with SST anomalies in the first mode are shown in figure 4. As SST increased, the vertical wind shear in the hurricane main development regions (10°–20° N, 85°–15° W) in the NA increased, therefore RI activity in the NA in El Niño years decreased (Klotzbach 2012). The vertical wind shears in the TC active region in the ENP and the east part of the WNP decreased, and vertical wind shears in the west part of the WNP, North Indian, and TC active region in the SH increased. For 850 hPa relative vorticity, increased SST decreased relative vorticity activity in the NA and North Indian Ocean, and enhanced relative vorticity activity in most TC active region in the WNP. The increased RI activity in the WNP in El Niño years may be subject to the increased relative vorticity and the decreased vertical wind shear (Wang and Zhou 2008). Enhanced SST increased 600 hPa relative humidity in the central Pacific, and decreased in the WNP and the North Indian Ocean.

Figure 4. Regressions maps of (a) vertical wind shear between 200 and 850 hPa (m s-1 K-1), (b) 850 hPa relative vorticity (10-6 s-1 K-1), (c) 600 hPa relative humidity (% K-1). Black dots indicate the regions where the regression exceeds the 95% significance level.
Download figure:
Standard image High-resolution imageThe enhancement of RI in the WNP by the ENSO probably occurs mainly due to a combination of the southward shift of the seasonal mean location at which the TCs form, an increase in low-level westerly meridional shear vorticity, and a decrease in northerly vertical shear (Wang and Zhou 2008). The cold phase of the PDO increases the number of RI events in the WNP each year and moves the mean location at which RI events occur northwestwards (Wang et al 2015). The active RI region in the WNP (10°–20° N, 125°–140° E) may be subject to interdecadal changes. More RI events occurred in the active RI region during the cold phase of the PDO between 1998 and 2015 (figures 3(a)–(d)), coinciding with increased proportions of CAT 4–5 storms (Mei and Xie 2016).
The second SVD mode explains 9.5%, 15.9%, and 12.8% of the total covariance between RI and the SST for the NH TC season, SH TC season, and entire year, respectively. The variance of second mode is statistically significant at 95% level for entire year, but not significant at 95% level for the NH TC season or SH TC season. During the NH TC season (figure 5(a)), the number of RI events increased in most of the RI active region in the NH, with some exceptions. The number of RI events decreased in the ocean west of Mexico (10°–20° N, 90°–105° W), which includes a large part of the most active region (12.5°–20° N, 95°–110° W) for RI in the ENP. For NA, the number of RI events decreased in the ocean southeast of Florida. During the SH TC season (figure 5(b)), the number of RI events increased over most of the RI active region in the South Indian Ocean. For the South Pacific, the number of RI events increased in the central Pacific between 180° and 150° W. Over the entire year (figure 5(c)), variability in the number of RI events that occurred was similar for the NH and SH TC seasons. The global SST anomalies indicate that there was a uniform warming pattern except that weak cooling occurred in the upwelling region in the eastern South Pacific (figures 5(e)–(g)). The number of RI events that occurred throughout the world clearly increased between 1980 and 2018 (figure 5(d)), consistent with increases in global SST anomalies (figure 5(h)). The global annual mean surface air temperature and global SST anomalies are both shown against time in figure 5(h) to allow comparisons to be made. Temporal evolution of the number of RI events that occurred each year for the second SVD mode was strongly correlated with the global mean surface air temperature (correlation coefficient 0.79). There is a general tendency for global warming to reduce the overall frequency of TCs and increase the incidence of the most intense storms (Emanuel 2008). Future increase of strong storms was suggested link to more frequent extreme TC intensification (Lee et al 2016). Numerical study with the global coupled climate models to simulate and predict CAT 4-5 TCs also found that the TC acceleration would rise in response to warming climate, which provided TCs with more opportunities to reach higher wind speeds (Bhatia et al 2018). It is therefore likely to have more RI events with increasing global temperature.

Figure 5. As figure 3 but for the second singular value decomposition mode for tropical cyclone rapid intensification and sea surface temperature anomalies (SSTA). Global annual mean surface air temperature (SAT) data are shown in (h) for comparison.
Download figure:
Standard image High-resolution image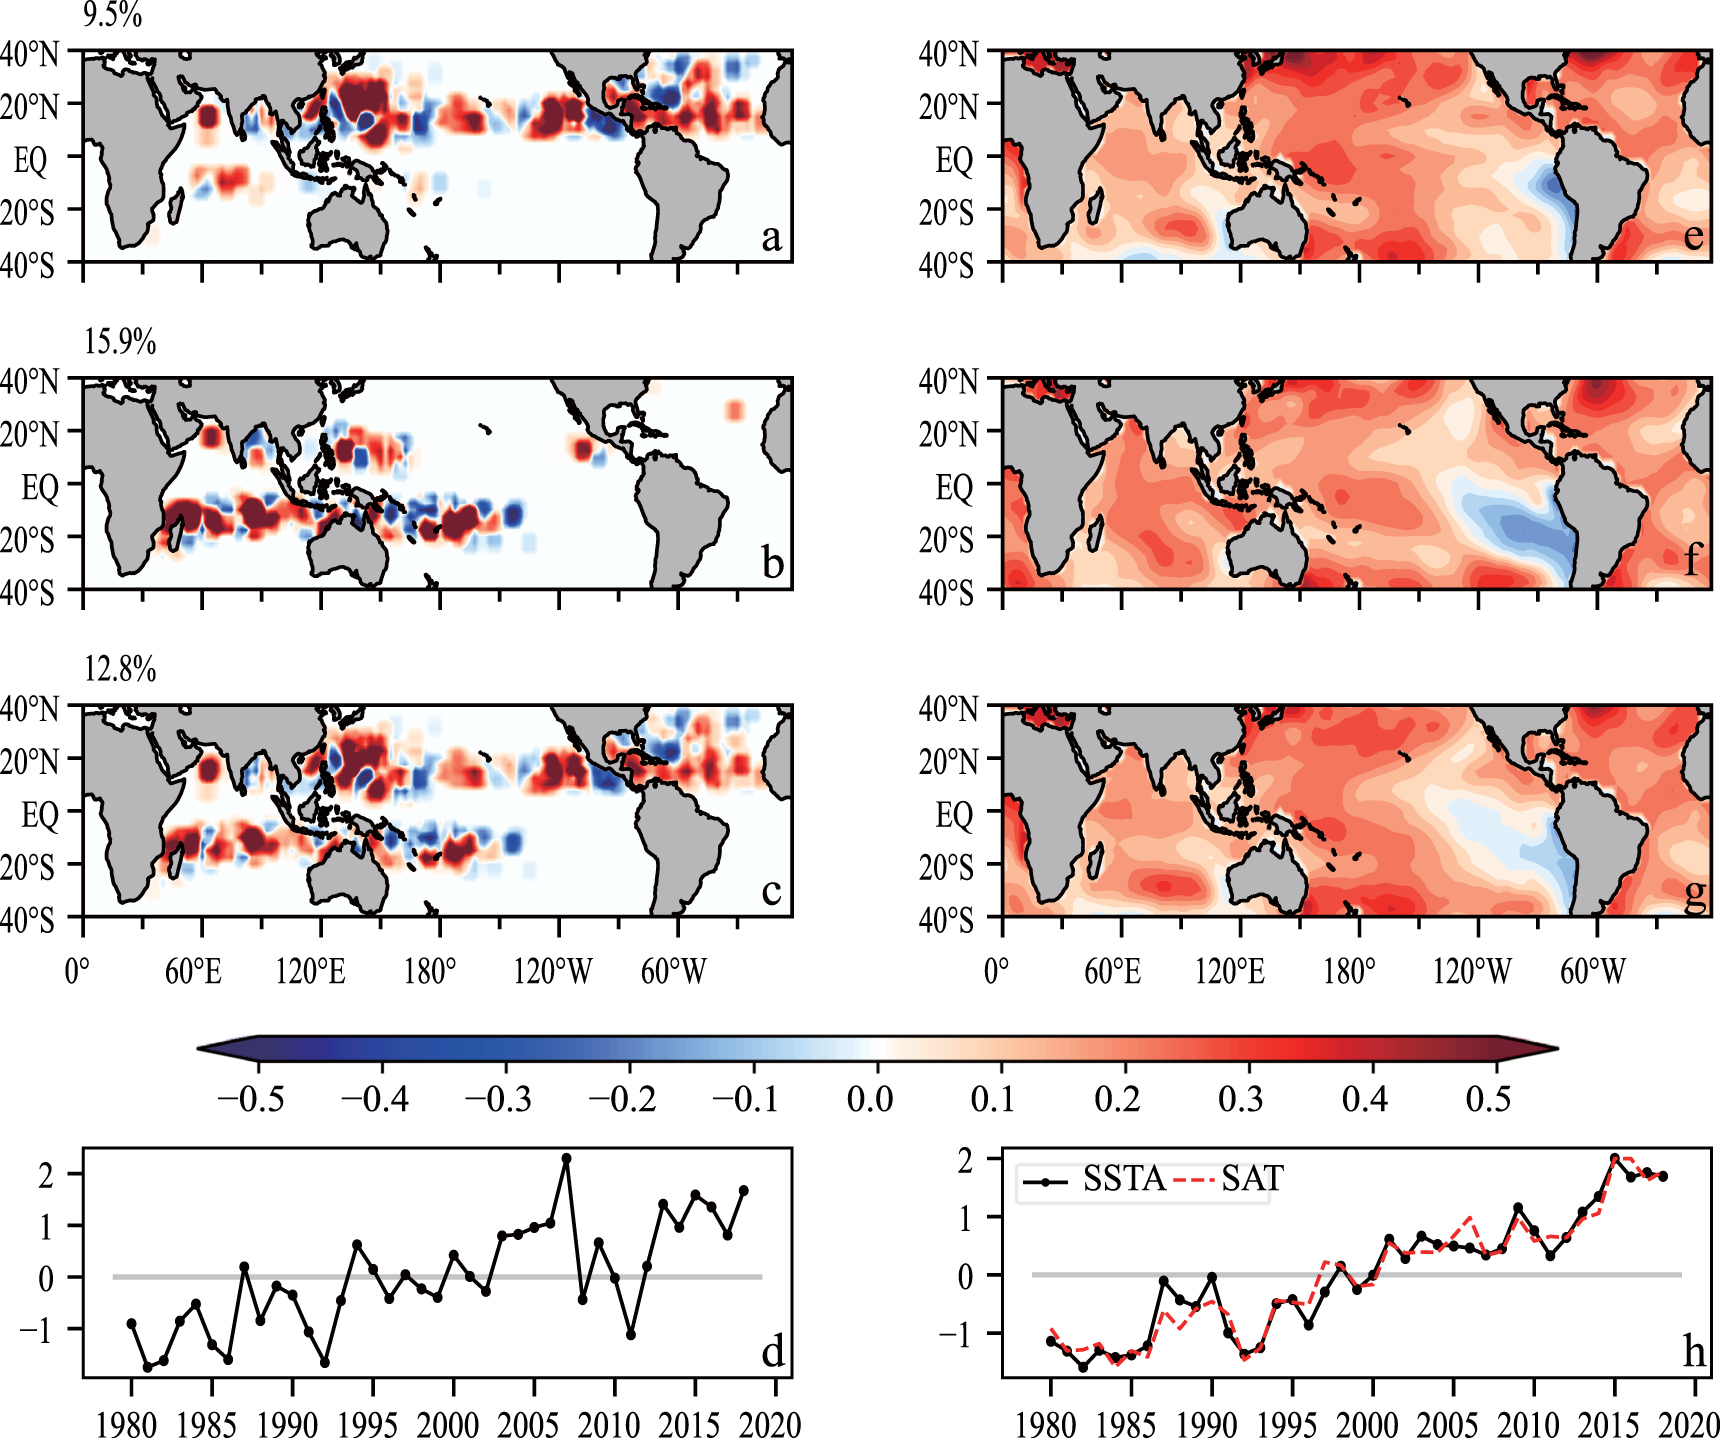
The second SVD mode in figures 5(a)–(c) presented the global pattern of TC RI occurrence trend, which would have been affected by global warming. The global warming mode explains larger variance for the SH TC season than for the NH TC season, and the first SVD mode explains much smaller variance for the SH TC season than for the NH TC season. This could be another reason why the number of RI events that occurred in the SH followed a statistically significant trend, as shown in figure 2. No statistically significant trend was detected in the NH basins because the number of RI events are predominantly affected by interannual and interdecadal variability. Although the SST warming is almost uniform in figures 5(e)–(g), the increase of RI is not homogeneous over the globe. For instance, the number of RI events decreased in the ocean southeast of Florida, while RI events increased in the rest of the NA. The reason for the difference could be that local oceanic and atmospheric conditions changes in the ocean southeast of Florida play a more important role in TC RI than the large-scale oceanic and atmospheric variables changes associated with global warming as demonstrated in previous study (Wang et al 2017).
4. Summary and discussion
Between 1980 and 2018, 96% of the CAT 4–5 hurricanes that occurred throughout the world underwent RI at least once. The RI events occurred in the tropical oceans around the world but were particularly frequent in the WNP and ENP. The total number of RI events of the global ocean varies annually but has followed an increasing trend for the last 39 years, and the total number of CAT 4–5 hurricanes each year is closely correlated with the number of RI events throughout the world and in individual basins. RI is important in causing an individual storm to reach a high intensity, but frequent RI events are also critical in causing more intense storms to occur during the TC season over a whole basin. The number of RI events in a year is a useful measure of the number of CAT 4–5 hurricanes that occur in that year.
The RI and SST fields were subject to SVD analysis to improve our understanding of the effects of climate variability on RI variability. The mode that dominated the variability of the number of RI events that occurred was primarily modulated by the ENSO and PDO. The positive ENSO and PDO phases favor the occurrence of RI in the North Pacific except in the region between 10°–30° N and 125°–135° E but suppress RI in the NA. The region between 10°–30° N and 125°–135° E includes a large part of the most active region for RI in the WNP. La Niña and the negative phase of the PDO strongly increase the number of RI events that occur in this region. In the SH, the positive ENSO and PDO phases decrease RI events in the ocean between 5°–20° S and 100°–165° E and increase at latitudes between 5° and 15° S in the central Pacific. The second SVD mode represents the global pattern in the trend in the number of RI events that occurred, which was affected by global warming. The number of RI events increased in most of the active RI region in the NH except in the ocean west of Mexico (10°–20° N, 90°–105° W), which includes a large part of the most active region in which RI events occurred in the ENP, indicating that global warming will decrease RI activity in this region.
TC intensification rate was considered to be tied to local SST warming (e.g., Mei and Xie 2016). Our study suggests RI favored environments are under the control of global climate variability. The leading mode associated with the El Niño and a positive phase of the PDO displays a contrast between enhanced RI number in the North Pacific and reduced RI number in the North Atlantic, which suggests contrast climate effects on intense storms in the North Pacific and in the North Atlantic, and the contrast variability of RI number between the most active region for RI (10°–20° N, 125°–140° E) and the rest part of the WNP complicates the variability of intense storms in the WNP.
Acknowledgments
This research was supported by grants provided by the National Natural Science Foundation of China (grant nos. 41722601, 41690121, and 41690120), and the Strategic Priority Research Program of the Chinese Academy of Sciences (grant no. XDA20060501). The TC track data were obtained from the NOAA National Climate Data Center (http://www.ncdc.noaa.gov/ibtracs/index.php? name=ibtracs-data-access). The SST data was obtained from The NOAA National Centers for Environmental Information (https://www.ncdc.noaa.gov/data-access/marineocean-data). Monthly mean wind and RHUM are obtained from the NCEP-NCAR reanalysis field (https://www.psl.noaa.gov/data/gridded/data.ncep.reanalysis.pressure.html). The Global Annual Mean Surface Air Temperature Change index was obtained from the NASA Goddard Institute for Space Studies (https://data.giss.nasa.gov/gistemp/graphs_v4), the Niño3.4 SST anomaly and the PDO index were obtained from the NOAA National Centers for Environmental Information (https://www.ncdc.noaa.gov/teleconnections). Comments and suggestions provided by three anonymous reviewers are greatly appreciated.
Data availability statement
All data that support the findings of this study are included within the article (and any supplementary files).