

Abstract
The cold chain (refrigerated supply chain) is an important application of refrigeration technologies. The capacity of the cold chain industry is growing rapidly in emerging economies such as China, leading to significant environmental impacts, especially greenhouse gas (GHG) emissions. By conducting the literature review, this study begins with presenting a comprehensive overview of the cold chain industry in China. We observed that China has a large total cold warehouse capacity but low capacity per capita. Then, we directly link the example of the cold chain in China to the methods of evaluating the GHG emissions from the cold chain industry. It is observed that existing studies either primarily focus on the lifecycle of food with less consideration on the cold chain facilities or primarily focus on the lifetime of a certain stage of the cold chain (e.g., refrigerated transportation) with less consideration on food. Neither frameworks capture the entire cold chain system. Moreover, we argue that existing studies lack investigations of the cold chain GHG emissions on the national scale. To evaluate the overall GHG emissions, we recommended that one can use the bottom-up approach. First, use the lifecycle assessment (LCA) to estimate the single-unit level (e.g., one kg food, one particular refrigerated warehouse) cold chain emissions. Second, aggregate up to the national scale by the distribution patterns of the cold chain networks. Finally, we identify the crucial future issues regarding collecting cold chain lifecycle inventory data, investigating the cold chain network and the overall environmental impacts in China, regulation and technology needs for expanding the clean refrigeration technologies, and the implications of the cold chain development to water, land, and society.
Export citation and abstract BibTeX RIS
1. Introduction
The refrigerated supply chain, or the 'cold chain', is essential to maintain the quality of perishable products (e.g., fresh food, pharmaceuticals, vaccine) by preventing the spoilage of products and preserving their value (Global Cold Chain Alliance, no date; Heard and Miller 2016). This paper will focus on the food cold chain, which accounts for nearly 75% of the cold chain market share in 2018 (Grand View Research 2019). In the food system, the cold chain is defined as the portion of the supply chain between the point of slaughtering or harvesting and the point of purchasing by consumers (Global Cold Chain Alliance, no date; Wang and Yip 2018). According to James and James (James and James 2010), over 200 million tons of perishable food products are lost in developing countries due to insufficient cold chain facilities; hence, it is critical to develop the cold chain industry. In developed countries, the cold chain carries more than 90% of fruits and vegetables and almost 100% of meat and poultry products (Yuan et al 2015). In developing countries, although the cold chain coverage is still relatively low, it is experiencing rapid expansion, especially in India and China (Salin 2018). The purpose of this paper is to provide insights into the development drivers and current status of the cold chain in China and directly links the big picture of the cold chain in China and its environmental impacts.
The cold chain is a prosperous industry and the global growth rate of the cold chain market value is expected to be over 15% from 2019 to 2025 (Grand View Research 2019). Particularly, the cold chain is growing rapidly in China, exceeding $23 billion in 2015, and being expected to reach $56 billion in 2020 (Teng and Chen 2017). The significant development of the cold chain could potentially reduce the food losses in China. It is reported that China lost about 12 million tons of fruits, 130 million tons of vegetables, and 6.9 million tons of meat products owing to improper storage and refrigeration in 2015 (Hu et al 2019). It is also reported that 8% and 25% of grains are lost at the storage and transportation stage every year in 2014 due to poor storage and transportation conditions (Jiang and Jiang 2015). Consider that China consumes 60% of vegetables, 30% of fruit and meat, and 40% of eggs and aquatic products of the total world production (Wang and Yip 2018), even a small reduction in the percentage of food losses achieved by the cold chain can be significant in the absolute food quantity saving.
As a consequence of food losses, the annual losses in the food industry is approximately $750 billion due to improper facilities and handling (US Department of Commerce 2016). Moreover, the lost food leads to the waste of invested natural resources to produce the food, which is corresponding to 4.4 gton CO2 equivalent (CO2-eq) greenhouse gas (GHG) emissions according to an article in 2017 (Rezaei and Liu 2017). Hence, a fully integrated cold chain has the potential to reduce food losses and its associated carbon emissions and economic losses (US Department of Commerce 2016, Rezaei and Liu 2017). However, it is worth noting that increasing cold chain facilities could lead to significant GHG emissions through refrigerant leakage and energy consumption. In a paper published in 2010 (James and James 2010), it is reported that the cold chain accounts for 1% of global CO2 emissions, and refrigeration used 15% of world electricity. In a report published in 2007 (Garnett 2007), Garnett estimated that food refrigeration contributed to 3%–3.5% of GHG emissions in the UK. During 2010 and 2018, the global refrigerated warehouse capacity increased from 458 million m3 to 616 million m3, which consequently requires more energy and generates more refrigerant leakage emissions (Salin 2010, 2018). According to the data from Green Cooling Initiative, the proportion of refrigeration emissions in global GHG emissions remains the same at 3.5% in 2010 and 2018 (Green Cooling Initiative 2020, International Energy Agency 2020); however, one should aware that the absolute emissions of the refrigeration industry and worldwide have increased. To achieve the 1.5 °C or 2 °C pathway proposed by the Paris agreement ('The Paris Agreement' 2015), the global emissions as well as the refrigeration emissions should see a peak and a decreasing trend afterward, and the emissions quantity increasing is not desirable (Climate Action Tracker 2020). Therefore, when considering the benefits of cold chain technologies, it is also crucial to understand tradeoff between reduced food losses and increased emissions from the cold chain industry (Hu et al 2019, Wu et al 2019).
To support the fast-growing cold chain industry, researchers have studied the value chain of the cold chain logistics (Wang and Yip 2018), operation management policies (Zhang et al 2018b, Abouee-Mehrizi et al 2019, Estrada-Moreno et al 2019), refrigeration technologies (Sawalha, Karampour and Rogstam 2015, Acha et al 2016, Sawalha et al 2017), and its lifecycle GHG emissions (Heard et al 2019, Hu et al 2019, Wu et al 2019). Review studies (James and James 2010, Zhao et al 2018) of the cold chain have also been conducted to present a big picture of the industry to support decision making(James and James 2010, Zhao et al 2018). However, those review studies mainly showed collected historical data but not proposed new methods to evaluate the environmental impacts. In this paper, we first present a tangible example of the cold chain industry in China to analyze the development drivers and current status, and direct link it to the methods of evaluating the environmental impacts. This paper also points out that it is unclear what the total environmental impacts will be as the cold chain expands to full global capacity. To address this, we proposed two perspectives (based on the lifecycle assessment) according to different lifecycle boundary definition to evaluate the overall GHG emissions at the national level. It should notice that this paper primarily discussed the environmental impacts regarding the GHG emissions that are responsible for global warming.
To conduct the review study, we selected academic journal publications as well as government and industry reports in both Chinese and English languages. The selected articles include peer-review journals and government and industry reports in both Chinese and English languages. Peer-review journals are collected from the Web of Science core collection with (i) 'cold chain', 'China', and 'food', (ii) 'cold chain' and 'footprint', and (iii) 'perishable', and 'supply chain management' as three times searching keywords in the time range 2000 to 2019. Government and industry reports are mainly from the National Bureau of Statistics of China (National Bureau of Statistics of China 2020), Food and Agriculture Organization (Jiang and Jiang 2015, Rezaei and Liu 2017), Food Climate Research Network (Garnett and Wilkes 2014), US Department of Agriculture (Gale and Huang 2007), and UN Environment (United Nations Environment Programme 2018a, 2018b, 2018c). Then, those articles are filtered by two criteria: whether the cold chain is related to the food system, or whether the cold chain research includes the discussion of environmental impacts. Accordingly, irrelevant articles are removed and selected articles are grouped into three categories: economics, technology, and environment. Specifically, the economics category provides facts about development drivers and the current status of cold chain in China, the technology category includes information on cold chain logistics management and refrigeration technologies, and the environment category consists of materials about environmental impacts study. Finally, 94 articles are reviewed and documented as references. Additionally, the macroeconomic data of China (e.g., GDP, population, food production) is collected from the National Bureau of Statistics of China (National Bureau of Statistics of China 2020). The information on cold warehouse capacity and the number of refrigerated vehicles are mainly gathered from the Global Cold Chain Alliance (Salin 2018) and industry reports from wareincloud.com (50yc.com 2019).
Overall, the structure of the paper is organized as follows. Section 2 briefly introduces the mechanism of cold chain logistics and refrigeration technologies. Then, section 3 overviews the development drivers and current status of the cold chain in China. Furthermore, the review of existing studies to evaluate the environmental impacts and the arguments of insufficiencies of current studies are in section 4. Finally, section 5 discusses the critical future issues for cold chain development in the future.
2. Cold chain logistics and refrigeration technologies
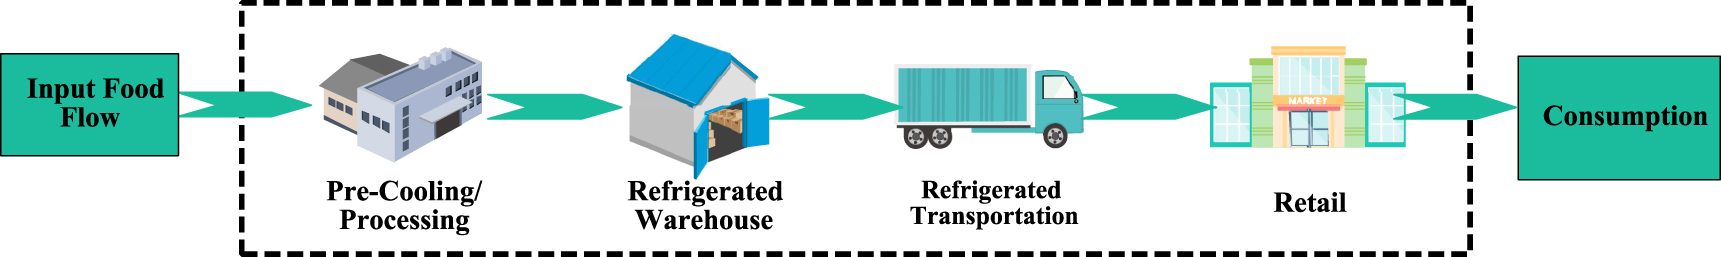
The cold chain represents a unique type of supply chain, due to the operation of temperature-controlled equipment and limited shelf life of perishable products. The perishable nature of food requires different logistics processes and results in greater overall environmental impacts than for typical non-perishable goods. Hence, it is meaningful to understand the mechanism of cold chain logistics and refrigeration technologies before evaluating the cold chain industry in China and its influences on the environment. The complete cold chain service cycle is from food production to consumption and primary activities are shown in figure 1. It mainly consists of pre-cooling/processing (e.g., freezing, packing), refrigerated warehouse storage, refrigerated transportation and distribution, and refrigerated retail (Kuo and Chen 2010, Li 2016, Zhao et al 2018).

Figure 1. Primary activities of cold chain logistics.
Download figure:
Standard image High-resolution imagePre-cooling is the first step of the cold chain (Kayalvizhi et al 2017, Elik et al 2019) and the purpose of pre-cooling is to bring postharvest or processed food products to optimal storage temperatures (Lyu et al 2015, Mercier et al 2017). In general, perishable food experiences the highest temperature at the postharvest stage. Hence, pre-cooling can effectively reduce the field heat and prolong the storage life of perishable food. It is found that precooling fruits to 0 to 2 °C would maintain the quality in later cold chain stages (Do Nascimento Nunes et al 2014, Mercier et al 2017). Pre-cooling technologies include the traditional warehouse pre-cooling method and advanced technologies such as hydro cooling, forced air cooling, and vacuum cooling (Zhao et al 2018). Particularly, forced air pre-cooling is efficient, simple to apply, and has a low cost; hence being promising compared with large-scale precooling devices and infrastructures (Mercier et al 2017, Zhao et al 2018).
Refrigerated storage (warehouse and retail) and refrigerated transportation rely on refrigeration technologies which are based on the thermodynamics refrigeration cycle including refrigerant evaporation, compression, condensation, and expansion. The compressor of refrigerated storage is normally driven by electricity and the compressor of refrigerated vehicles is driven by the vehicle engine, electric motor, or auxiliary engines (Tassou et al 2009, Wu et al 2013). Refrigerant is the working fluid in the refrigeration systems. Currently, hydrochlorofluorocarbon (HCFCs), hydrofluorocarbons (HFCs), R744 (CO2), and R717 (NH3) are widely used in refrigerated storage facilities (Beshr et al 2015, Sawalha, Karampour and Rogstam 2015, Gullo et al 2016) and refrigerated vehicles primarily use HFCs as the refrigerant (Li 2017). The refrigeration systems are designed to be closed, but GHG emissions still occur due to refrigerant leakage and end-of-life disposal. Widely used HCFCs (e.g., R22) have ozone depletion effects and traditional HFCs have high global warming potentials (GWP). The refrigerant leakage directly leads to serious climate change. The Montreal Protocol proposed the phase-out of ozone depletion refrigerants (HCFCs) and the Kigali Amendment to the Montreal Protocol additionally proposed the phase-down of high GWP refrigerants (HFCs) (United Nations Treaty Collection 1987, 2016). Hence, the greater penetration of clean refrigerants can be expected in the future (Tassou et al 2011, Beshr et al 2015, Acha et al 2016). Moreover, the GHG emissions of refrigeration facilities also come from energy consumption which constitutes approximately 70%–80% of total GHG emissions of the cold chain facility (International Institute of Refrigeration 2015, Green Cooling Initiative 2020). The total GHG emissions from each cold chain stage vary according to food products, temperature conditions, and storage duration (Hoang et al 2016, Heard et al 2019). One example of the emission contributions of the cold chain primary activities can refer to (Hoang et al 2016). Hoang (Hoang et al 2016) found that around 40% of salmon cold chain emissions are from the production and refrigerated warehouse and a similar 35% emissions are from the long-distance refrigerated transportation. The remaining part is from short-distance refrigerated transportation and retail display cases.
Other than the primary activities, refrigerants and refrigerators manufacturing and cold chain operation management activities are also indispensable. The manufacturing sector provides essential refrigeration equipment and refrigerants and operation management improves the efficiency of using cold chain resources. Advanced operation management platforms are developed to increase the connections between upstream and downstream cold chain parties. Xie (Xie and Zhao 2017) and Chaudhuri (Chaudhuri et al 2016) developed a 'big data' framework to improve the operation of cold chain logistics, which can potentially integrate different stages of a cold chain and improve its operational efficiency (Sari 2010).
3. Cold chain development: drivers and current status
Overall in China, the current status of the cold chain industry shares similar patterns to the Chinese economy, where the total capacity is large but the per capita share is still relatively low. Moreover, existing cold chain resources are not evenly distributed to serve the Chinese population equitably. The development of cold chain in western and northern China is behind that in the southern and eastern parts of the country. Such status is resulted from the economic growth, food demand changes, and the cold chain regulations in China, which are discussed in the following sections. Additionally, we also discussed how the population distribution and food distribution in China are related to the distributions of cold chain resources.
3.1. Economic growth and demand changes
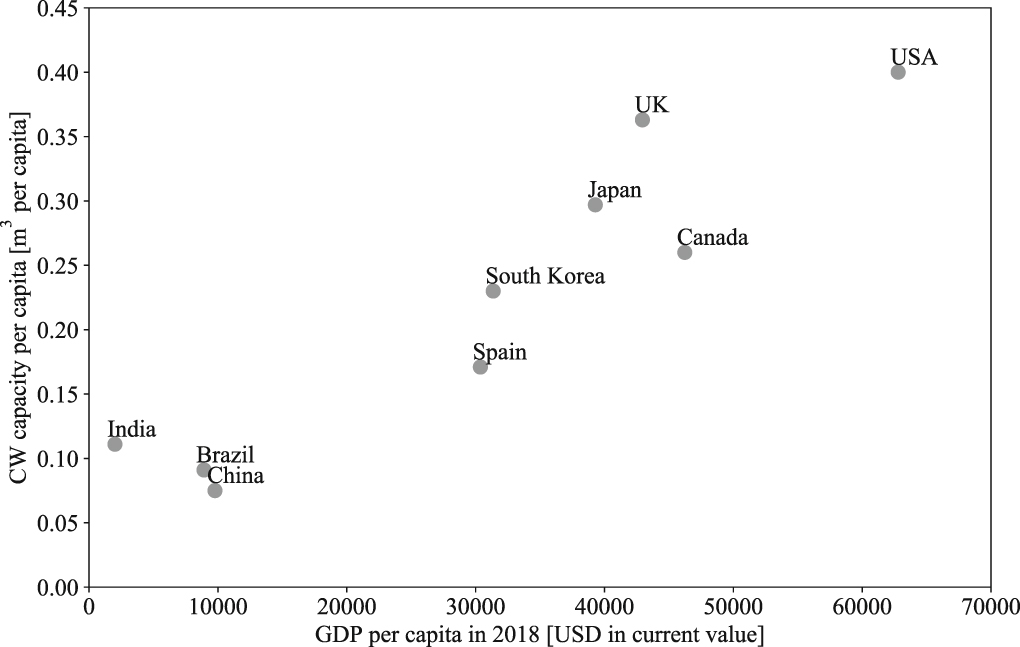
Abundant cold chain resources is a sign of a high standard of living (Yuan et al 2015). Figure 2 illustrates the GDP per capita and cold warehouse capacity per person of nine countries in 2018. The trend shows that a country tends to have more cold warehouse resources if its GDP per capita is higher. The average cold warehouse capacity in developed countries is significantly higher than that in developing countries, which indicates that the level of economic development has a strong correlation with the standard of cold chain development. The rapid economic growth in China in the past decades has brought about increased urbanization and rising incomes that drive cold chain development. As a result, the cold warehouse capacity in China increased from 54 million m3 in 2010 to 105 million m3 in 2018 (Salin 2010, 2018).

Figure 2. GDP per capita and cold warehouse per urban residents of nine countries in 2018 [4]. CW denotes the cold warehouse.
Download figure:
Standard image High-resolution imageThe cold chain development is coupled with the changes of food production and consumption, supply chain, and food quality demand (McLoughlin et al 2012, Garnett and Wilkes 2014). In China, consumption of grains has declined and the structure of food production leans toward high-value agricultural products including fruits, vegetables, livestock products, and aquatic products (Garnett and Wilkes 2014). The high-value products account for 64.1% of total agricultural production in 2018, which is 6.3% greater than that in 2000. The increase of high-value products and the expansion of cold chain are developing reciprocally. It is found that the food supply chains in China are lengthen (Garnett and Wilkes 2014). The cold chain extends the supply chain of fresh fruits, vegetables, meats, and aquatic products, which have a relatively short shelf life. In return, horticultural crops, aquatic products, and meats contribute to 44.8%, 29.9%, and 12.6% of the total market value of the cold chain industry in China (Li 2016). Moreover, the demand for high-standard food safety and quality is another crucial driver for cold chain development. Due to the strict control of the supply chain environment, the cold chain has the natural advantage of improving food safety and quality to some degree. In summary, economic development and people's demand for safe and high-quality food products drive the cold chain market growth in China.
3.2. Cold chain regulations and standards
Regulations and industry standards are issued for the cold chain industry in China, and the purpose is to maintain the quality and safety of food products. Food safety is the primary concern of the food industry. In 2008, the melamine contaminated milk power scandals caused profound public concern about food safety (Yu and Huatuco 2016, Kang 2019). In 2015, China started to implement the amended Food Safety Law to the 2009 version, which strengthened the inspection of the food market and specified the rules from production to consumption (National People's Congress (NPC) of the People's Republic of China 2015, Zhao et al 2018). The current Food Safety Law is the amendment version in 2018 (National People's Congress (NPC) of the People's Republic of China 2018). Regarding cold chain regulations and standards, Zhao et al (Zhao et al 2018) found that there are over 200 standards about production, handling, storage, and transportation of agriculture products. However, most of those standards merely cover a certain stage of the food logistics and there are less than 20 national standards specifically for the cold chain (Yuan et al 2015, Zhao et al 2018). Moreover, most of those standards are recommended and are regarded as difficult to implement; hence they have limited effects on the cold chain industry (Zhao et al 2018). The first mandatory national standard (GB31605-2020) is passed in 2020 and will be implemented in the cold chain market in March 2021 (National Health Commission of the People's Republic of China 2020). This mandatory national standard regulates the whole cold chain process including management and records rules, temperature level, and policies of storage, distribution, and transfer between cold chain stages. With more complete regulations and standards, the growth of the cold chain industry is expected to stay in a managed fashion.
Additionally, to respond the Montreal Protocol and the Kigali Amendment to the Montreal Protocol, China took measures to reduce the production and consumption of R22 (the most popular HCFC refrigerant). In 2015, Chine reduced 10% of R22 production and consumption from the 2010 level, which is a success of the first stage R22 phase out plan (Zhang et al 2019a). In the second and third R22 phase out stage, China targets at 35% and 67.5% of reduction from the 2010 level, respectively. By 2030, China merely plans to have 2.5% of R22 production and consumption from the 2010 level for maintenance (Zhang et al 2019b). Regarding the energy efficiency of cold chain equipment, China aims to improve 20% market share of green and high-efficiency refrigeration systems by 2022, and improve 40% of that by 2030 according to (National Development and Reform Commission of People's Republic of China 2019). Particularly, the energy efficiency of refrigerators and display cases are required to improve 20% to enter the market by 2022, and additionally 15% energy efficiency enhancement is required by 2030 (National Development and Reform Commission of People's Republic of China 2019). In 2030, 20%–30% low efficient equipment will be phase out (National Development and Reform Commission of People's Republic of China 2019).
3.3. Population, food production, and consumption
Discussing the variation of population, food production, and consumption in different provinces are helpful to understand the geographical distribution of cold chain resources in China. In China, more than 90% of the Chinese population lives in ∼45% of the country's total area, mainly in provinces surrounding Beijing, as well as central China and the southeast (National Bureau of Statistics of China 2020). The population in Western provinces such as Xinjiang, Tibet, Gansu, and Qinghai are sparsely distributed.
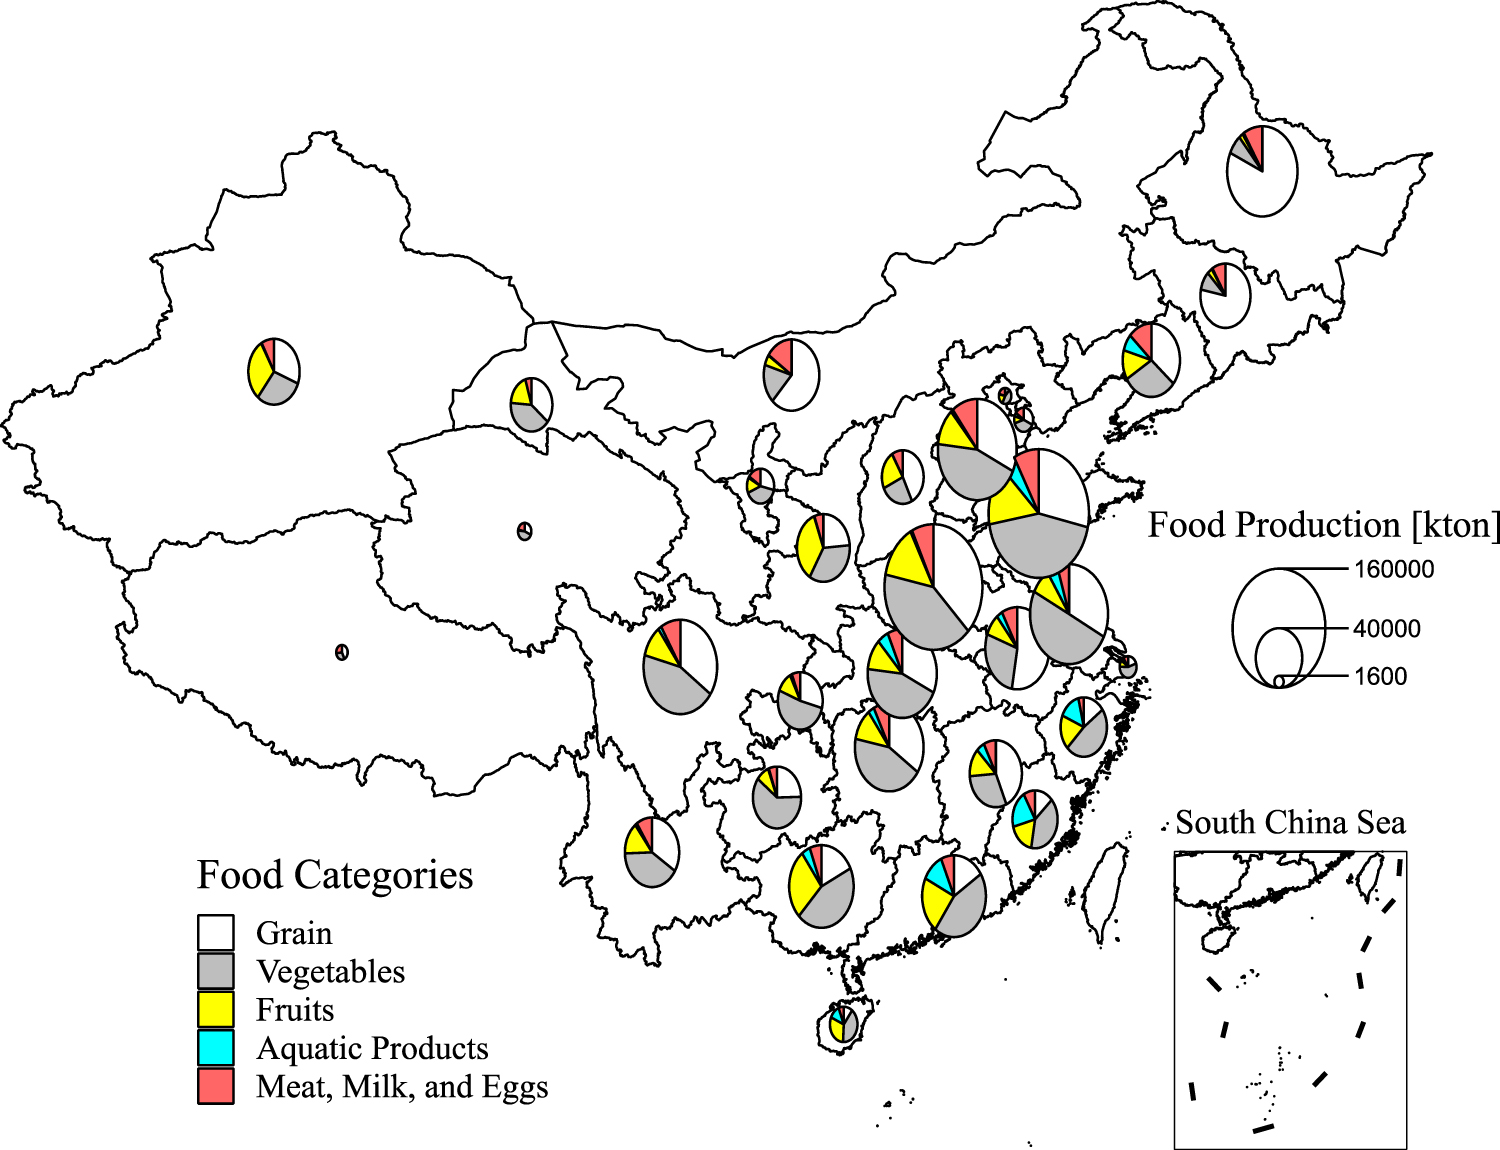
Regarding food production, it is worth mentioning that high-value perishable products demand more refrigeration conditions than grain, which has influences on the cold warehouse distribution in China. Figure 3 shows the food production of each province and the size of the pie indicates the production quantity. The regional differences are clearly shown in figure 3. Generally, if a province has a larger population, it tends to have a higher quantity of total food production.

Figure 3. The food production of grain, vegetables, fruits, aquatic products, and meat products of each province in China in 2018. The data of Taiwan, Hong Kong, and Macao is not consistent with mainland China, so they are excluded from the discussion. Moreover, the South China Sea Islands are also excluded due to a lack of data.
Download figure:
Standard image High-resolution imageThe Northern and Central provinces produce the majority of the grain of the whole country. Heilongjiang and Henan contribute to approximately 20% of total grain production in 2018. By contrast, aquatic products are mainly from coastal provinces. Shandong, Guangdong, Fujian, Zhejiang, and Jiangsu produce more than 50% of aquatic products' yield. Additionally, the production of meats and horticultural crops spreads all over the country. Tibet and Qinghai province rarely produce grains, vegetables, and fruits due to their altitude and climate. Fresh vegetables and fruits have relatively short shelf time and a daily 'farm to local market' business model is established (Gong and Liang 2006). Although agricultural products have variations in different provinces, Chinese consumers are served with sufficient and diverse food categories in the whole country. With the development of the cold chain, cross region and global fruits and vegetable supply chain are also established in China (Gong and Liang 2006). A long-distance food supply chain requires refrigeration systems to preserve the value of products; the cold chain logistics is expected to play a more important role in the food distribution networks.
On the consumption side, the purchasing habits of customers are changing gradually. Although the traditional wet market still accounts for a considerable portion in the food retail sector, larger retailers and branded supermarkets are gaining market shares gradually (United States Department of Agriculture 2018). E-commerce is also reshaping the food retail industry through food delivery services. E-commerce increases the convenience of accessing food, which is an important factor for Chinese consumers (Gale and Huang 2007, United States Department of Agriculture 2018). The growth of branded supermarkets and e-commerce also favors cold chain penetration. Compared with the traditional wet market, branded supermarkets and e-commerce normally have integrated upstream-downstream cold chain services and strict quality control making the cold chain easier to implement and necessary for perishable products distribution. Overall, the food production characteristics and the changes in the retail market creates promising conditions for the cold chain industry to grow in China.
3.4. Cold chain facilities and services
As we discussed before, although the cold chain industry is still at the initial stage, the number of cold chain facilities are increasing dramatically with the growth of economy and high-quality food demand. As shown in table 1, the refrigerated warehouse capacity increased from 76 million m3 in 2014 to more than 100 million m3 in 2018, and the number of refrigerated vehicles reached about 180 000 in 2018 (Salin 2018, Zhao et al 2018). In 2018, the refrigerated warehouse capacity in China is only behind the US and India (Salin 2018).
Table 1. The increase of refrigerated warehouse capacity and number of refrigerated vehicles from 2014 to 2018 in China.
| 2014 | 2015 | 2016 | 2017 | 2018 | |
|---|---|---|---|---|---|
| Refrigerated Warehouse Capacity [million m3] | 76.1 | — | 107 | — | 105 |
| Number of Refrigerated Vehicles [Thousand] | 75.9 | 93.4 | 115 | 140 | 180 |
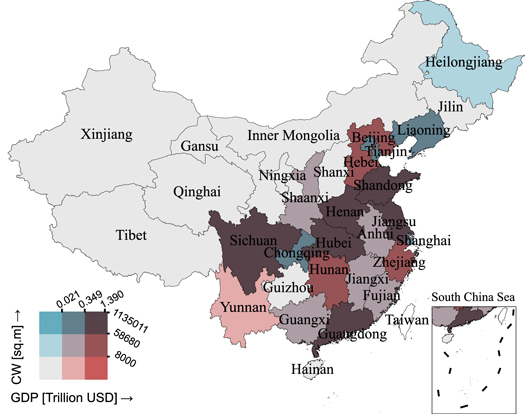
Despite its rapid growth, the development of cold chain is facing several challenges. First, cold chain resources per capita are still relatively low. In 2018, the cold warehouse per person in China was 0.075 m3, while that data for India was 0.111 m3 and for the US was 0.40 m3 (Salin 2018). Those data suggest that the capacity of cold chain facilities in China still have a large room to expand. Moreover, cold chain facilities are unbalanced in different regions in China (Shou and Bao 2017). As shown in figure 4, more developed regions tend to have higher cold warehouse capacity. Central China (e.g. Henan) owns 15% of total cooling capacity, presumably because it has the most fruit and vegetable production. Coastal provinces also own more cold warehouses due to higher population and demand. Moreover, fifteen provinces in northern, eastern, and central China own 87% of refrigeration vehicles (Gao 2019). Hence, it suggests more developed regions where has dense population tend to have more cold chain resources. However, it should be noted that Shou (Shou and Bao 2017) argued that the cold chain demand in the northwest is not satisfied. Northwestern provinces have high-quality and quantity meat production, but the cold chain facilities are not sufficient in those regions. The unbalanced resources result in a cold warehouse vacancy in some regions. The vacant rate in 2019 increased from 8.2% in January to 10.6% in June. Particularly, the vacant rate in Nanjing, the provincial capital of Jiangsu, is 37% (50yc.com 2019).
Figure 4. GDP and the distribution of cold warehouse resources of each province in China in 2018. CW denotes cold warehouse area. The data of Taiwan, Hong Kong, and Macao is not consistent with mainland China, so they are exclude. Moreover, the South China Sea Islands are also excluded from the paper's discussion.
Download figure:
Standard image High-resolution image
Regarding the business aspect of the cold chain in China, the cold chain market is fragmented, and the largest one hundred companies contribute to less than 10% of total market revenue (Teng and Chen 2017). As a result, the segmented market and unbalanced cold chain facilities distribution lead to cold chain scission between cold chain stages. In other words, the food delivery is not guaranteed to be covered by refrigeration facilities through the food logistics. Traditional cold chain services include renting cold warehouses, offering refrigerated ground transportation, and urban distribution. An integrated solution connecting the cold chain upstream to downstream is also developed, and third-party logistics (3PL) offers refrigeration services during the whole supply chain service. Additionally, the significant expansion of information technology fosters the advanced fresh food e-commerce service and the internet of things (IoT) model for cold chain services, which integrates the regional cold chain hierarchy and increase the operation efficiency (Yuan et al 2015, Li 2016, Wang and Yip 2018).
4. Cold chain development: assessing the environmental impacts
The growth of the cold chain industry is inevitable in China and it is critical to investigate the potential GHG emissions of the cold chain. As the purpose of the cold chain is to use refrigeration technologies to prevent food spoilage, one should understand the environmental impacts of the cold chain from the following two aspects. On the one hand, refrigeration technologies are characterized by intensive energy consumption and refrigerant leakage problems which contribute to GHG emissions. On the other hand, the cold chain can reduce embodied carbon losses by preventing food spoilage. In the following sections, we first review previous studies regarding the environmental impacts of the cold chain. Afterward, we argue the inadequacy and challenges of evaluating the environmental impacts of the cold chain and propose two views to assess the overall environmental impacts of the cold chain.
4.1. Methods of evaluating environmental impacts
The environmental impacts of the cold chain can be evaluated by various frameworks and metrics. They are intrinsically similar but are distinct in the research scopes and boundaries (Li 2017, Mota-Babiloni et al 2020). The total equivalent warming impact (TEWI), lifecycle climate performance (LCCP), and lifecycle assessment (LCA) will be briefly compared, and then we will focus on the LCA framework to extend our discussion.
The TEWI framework considers direct emissions of refrigerant leakage and indirect emissions from energy consumption through the lifetime of the refrigeration equipment (Wu et al 2013, Mota-Babiloni et al 2020). It measures the GHG emissions in kg CO2-eq. The TEWI has the narrowest research boundary among those three frameworks and it is recommended to use to compare a specific application (e.g., air conditioners, refrigerators, heat pumps) (Mota-Babiloni et al 2020). The LCCP framework extends the boundary of the TEWI and additionally includes embodied energy consumption and emissions of manufacturing refrigeration equipment and refrigerants (Wu et al 2013, International Institute of Refrigeration 2016). The LCA estimates the lifetime environmental impacts of an object from production to consumption and disposal, as well as other support manufacturing activities (Pennington et al 2004, Rebitzer et al 2004). It shares the same system boundary as the LCCP and Li (Li 2017) concluded that if only estimate the GHG emissions the LCCP and LCA should return the same results. The advantage of LCA is that it can estimate the particulate matters, abiotic depletion, photochemical oxidation, acidification, and eutrophication besides GHG emissions. Additionally, LCA is guided by the ISO 14044 standard that outlines the main processes including the definition of goals and scopes, lifecycle inventory (LCI) analysis, lifecycle impact assessment (LCIA), and the results interpretation (International Organization for Standardization 2006, Hoang et al 2016, Li 2017). In the following discussion, we will focus on the LCA framework, as it provides a broader scope.
In the LCA study, it is critical to specify the functional unit and the research scopes. The functional unit defines the services that need to be accomplished by the product or service associated with research questions (Frijia et al 2012). For instance, Heard selected 'one prepared meal' (Heard et al 2019), Wu used 'one kg of orange at the retailer' (Wu et al 2019), and Hoang measured 'one kg of consumed salmon' (Hoang et al 2016) to assess the corresponding cold chain's environmental impacts. Selecting an appropriate functional unit makes it possible to compare the environmental impacts of different products or services. Owing to specific research goals, the system boundary and functional unit of existing LCA studies vary significantly even within the cold chain context. Table 2 summarizes the research scope and functional unit of six reviewed publications and they can be divided into two categories: (i) evaluate the GHG emissions based on the lifetime of refrigeration technology (Bovea et al (Bovea et al 2007), Li (Li 2017), Wu et al (Wu et al 2013)), and (ii) evaluate the GHG emissions based on the lifetime of food products delivered by cold chain (Hoang et al (Hoang et al 2016), Wu et al (Wu et al 2019), Heard et al (Heard et al 2019)).
Table 2. Summary of research scope and functional unit of previous cold chain LCA studies. Research scope refers to certain stages of cold chain logistics or the whole cold chain service cycle.
| Reference | Research scope | Functional unit |
|---|---|---|
| Bovea et al (Bovea et al 2007) | The lifetime of supermarket refrigeration systems | kg CO2-eq emissions during the systems' life span of the given system |
| Li (Li 2017) | The life time of refrigerated transportation | kg CO2-eq emissions of the given refrigeration systems' life time |
| Wu et al (Wu et al 2013) | The life time of refrigerated transportation | ton CO2-eq emissions of the given refrigeration systems' life time |
| Hoang et al (Hoang et al 2016) | The salmon lifecycle | kg CO2-eq emissions of one kg of consumed salmon |
| Wu et al (Wu et al 2019) | The orange lifecycle | g CO2-eq emissions of one kg of orange at the retailer |
| Heard et al (Heard et al 2019) | The meal lifecycle | kg CO2-eq of one prepared meal |
In the first category, researchers evaluate the lifetime emissions of refrigeration technology at a certain stage of the cold chain. Bovea et al (Bovea et al 2007) compared lifetime emissions of using HFC refrigerants and natural refrigerants (R744 and R717) in the commercial refrigeration systems. They concluded that it is environmentally feasible to substitute conventional high-GWP HFC refrigerants in the long-term. Li (Li 2017) studied the LCCP of the refrigerated transportation stage and defined the lifecycle from the installation to retirement of the refrigeration systems. Li (Li 2017) considered emissions from refrigerant leakages, energy consumption, and refrigerant manufacturing. Wu et al (Wu et al 2013) also investigated the GHG emissions of the refrigerated transportation stage and additionally included the emissions from refrigerators manufacturing. By comparing the performance between refrigerants, they found that the GHG emissions of refrigeration systems using low GWP refrigerants (e.g. CO2) tends to be lower. However, when the ambient temperature increase, the coefficient of the performance of CO2 systems need to be increased to achieve lower emissions (Wu et al 2013). In the second category, researchers focus on the lifecycle of food products from its production to disposal and track each cold chain stage. Hoang et al (Hoang et al 2016) conducted the LCA study for the salmon cold chain from Norway to other European countries and compared the differences between chilling and superchilling technologies. In this study, they not only presented the results of GHG emissions but also included the emissions of other chemical substances. In a similar fashion, Wu et al (Wu et al 2019) coupled the LCA study with the thermal information to investigate the orange cold chain from South African to Switzerland. They also studied the tradeoff between using cold chain technologies and preventing food spoilage. Heard et al (Heard et al 2019) conducted a comparative LCA study for meal kits and grocery store meals delivered by the cold chain. They found embodied emissions from food production contribute to a significant proportion.
4.2. Challenges of lifecycle assessment for the cold chain
There are several challenges to apply the LCA framework on evaluating the environmental impacts of the cold chain system. Firstly, it is difficult to define an appropriate functional unit and research scope to characterize the entire cold chain. Particularly, it is challenging to define the research boundary of the 'cold chain system'. It is worth reminding that the cold chain involves primary activities (refrigerated storage and transportation) and support activities (e.g., equipment manufacturing, logistics management), which carries the food product from production to consumers (figure 1). Hence, the cold chain involves multiple coupled components including food products, refrigeration facilities, and logistics services.
However, considering the two categories of LCA study analyzed in section 4.1, neither of them captured the entire lifecycle of all cold chain components. Specifically, in the first category of LCA study, although researchers investigated the lifetime of refrigerated vehicles and commercial refrigeration systems, the emissions embodied in the food products are not considered and the whole cold chain logistics is not covered (Bovea et al 2007, Wu et al 2013, Li 2017). In this category, the functional unit is normally 'kg CO2-eq emissions of the lifetime of the given facility'. In the second category of LCA study, although researchers considered the emissions generated at each stage along the food lifetime, merely the operation emissions of the cold chain facilities are considered instead of the lifecycle of refrigerated warehouse and vehicles (Hoang et al 2016, Heard et al 2019, Wu et al 2019). 'One kg product consumed' is a common functional unit in this category. Each of those studies investigated specific circumstances and particular questions; however, it demonstrates that when targeting all aspects of the cold chain, it is challenging to find an appropriate functional unit to unify each fragment of the cold chain.
Secondly, it is challenging to evaluate the interactions between the cold chain, food, energy, and water, which is related to the system boundary definition. Many researchers consider the environmental impacts of the cold chain beyond its functional boundary (figure 1) and argue a nexus concept should be used (Heard and Miller 2016, Heard et al 2017, Zhang et al 2019b). This argument is reasonable because food products carried by the cold chain embody considerable invested energy and water from the agriculture sector. It is estimated that China losses 14.5% to 30% of the total produced food which is corresponding to 10 to 20% of total water consumption (70 to 135 billion m3) and 5 to 6% of total GHG emissions due to energy consumption in agricultural activities (Liu et al 2013, Ma et al 2015, Sun et al 2018). Regarding the tradeoff between preventing food losses and increased refrigeration emissions during the cold chain logistics are investigated. In the study of Wu et al (Wu et al 2019), they found using renewable energy to power the cold chain facilities, the cold chain emission can be reduced by 8.5%. So far, most of the discussed studies are based on the single-unit level (e.g., one kg product, one particular refrigerated warehouse). The study of Hu et al (Hu et al 2019) investigated the tradeoff between the expansion of the cold chain for meat, milk, and aquatic products and the reduced emissions from food losses at the industry level in China. However, Hu did not include the emissions associated with refrigerant leakage and transportation emissions. Hence, it is questionable to conclude that increasing the cold chain capacity would result in the total emission reduction in the cold chain. The attempt of evaluating the total GHG emission in China lead to the third challenge of the cold chain LCA study.
Existing studies did not reflect the big picture of the cold chain environmental impacts at the industry level and it is challenging to answer the question such as 'What are the overall GHG emissions from cold chain expansion in China?' It is critical to investigate such questions and have broad understandings of the environmental impacts of the cold chain, which is required when making high-level decisions of the cold chain industry. For instance, China produced more than 240 million tons of fruits and Japan produced 3 million tons of fruits in 2018, so the cold chain capacity required for China and Japan would be different (Jiang and Jiang 2015). The same GHG emissions based on single-unit leads in China would lead to more severe overall emissions than that in Japan.
Hence, the question is how to aggregate the single-unit based estimation (e.g., one kg product, one particular refrigerated warehouse) to a large geographical boundary (e.g., in China). In this paper, we propose two perspectives to potentially estimate the overall GHG emissions of cold chain in China: (i) cold chain facilities oriented perspective and (ii) food products oriented perspective. Both perspectives are extended from the two categories of existing LCA study discussed in section 4.1.
The first perspective is to conduct LCA on refrigerated warehouse and refrigerated vehicles, and aggregate up based on each type of those facilities to match the total capacity in China. According to the UN Environment, the size of refrigeration facilities have different refrigerant charge, leakage rate, and energy efficiency. Hence, the aggregation is not linear but the weight of each size category of refrigeration warehouse should be considered (United Nations Environment Programme 2018a). In contrast, the estimation of the simple top-down approach based on the total capacity of cold chain facilities in China could only return a much coarser result. The function unit of this perspective could be kg CO2-eq/warehouse and kg CO2-eq/vehicle. This approach considers emissions from the manufacturing and operation of refrigeration facilities at each cold chain stage. By estimating the GHG emissions of each cold chain stage, this approach could directly reveal how to reduce the GHG emissions of a particular stage. For instance, if refrigerant leakage constitutes a significant portion of total emissions, the lower GWP refrigerant will be preferred.
Eventually, this approach is a static accumulation and does not consider the nature of the supply chain process. It is worth noting that food production is not included in this perspective. It is justifiable to exclude the agriculture sector from the cold chain system because fundamental cold chain facilities are refrigerated warehouse and refrigerated vehicles. However, the downside of this perspective is that drawing the boundary in this way will not capture the environmental impacts of any reductions in food loss for which the refrigeration technology is responsible. At the same time, the focus of the analysis is on the technology itself and does not need to take into the additional complexity of agricultural systems and food loss throughout the supply chain.
The second perspective is to conduct LCA on the food products and aggregate up based on the food quantity been delivered by the cold chain in China. The functional unit of this perspective could be 'delivering singe-unit (e.g., one kg) of food product'. In the second perspective, food products play a central role and link a series of activities from the agriculture sector, cold chain logistics, to consumers. Agriculture activities consume a large quantity of water and the environmental impacts of water resources should be included in this approach (Guan et al 2019). Hence, one can study a variety of elements including agriculture, food system, refrigeration technologies, and consumers in a large ecosystem under this perspective. The tradeoff between increasing the cold chain facilities and preventing the food losses can also be studied from this aspect.
The key challenge in this approach is how to capture the food distribution network in China? GHG emissions corresponding to one kg of food products at the refrigerated warehouse and retail stage can be aggregated up to match the total food quantity. However, in the food distribution stage, GHG emissions are normally measured in kg CO2-eq per kg food per km traveled (Rai and Tassou 2017, Heard et al 2019), and it is difficult the capture the dynamic movement characters of food products in the distribution stage. Explicitly, the distance of food products traveled is normally unknown and researchers generally assume a static travel distance. For instance, Heard assumes the travel distance from the processing factory to the distribution center to be 976 km by the common average in the study of comparing the GHG emissions of meal kits and grocery store meals (Heard et al 2019). When it comes to estimating the cold chain network in China, it is challenging to find such a common average value to represent such a complex network.
Overall, whatever perspective is selected, estimating the total GHG emissions of the cold chain in China could be divided into two connected problems. Estimating the single-unit level GHG emissions (i.e. kg CO2-eq/warehouse or kg CO2-eq/kg food), and aggregating up to the national level by different rules. However, the accuracy of those approaches is uncertified and future investigations are needed.
5. Discussion of future issues
The paper analyzes the current status of cold chain development in China and discusses the methods to study the environmental impacts. Those discussions provide the big picture of the cold chain industry in China and the guidance of studying the environmental impacts of cold chain system. However, there are still crucial actions needed from government, cold chain industry, and academic communities to improve the cold chain logistics and strengthen the perceptions of cold chain environmental impacts. We are going to discuss four key points to be done in China, and those measures can also potentially benefit the cold chain industry in other countries.
- (i)The lifecycle inventory data of the emerging cold chain industry should be collected and managed. Lack of lifecycle inventory data is a well-known challenge for process-based LCA. Conducting comparative LCA studies on the cold chain in China is even more difficult because the development of the emerging industry is uncertain (Miller and Keoleian 2015). Regarding the cold chain, a wide range of food categories, refrigerants, and refrigeration systems' operation information are required to conduct the quantitative study. Although certain organizations provide LCA database services (e.g., ecoinvent, USLCI), data is generally limited to developed countries and mature industries. For instance, the ecoinvent database has data collection mostly from the US and Europe but lacks information about China. However, the energy sources for agriculture activities and refrigeration systems in China are significantly different from those in the US and Europe. Additionally, when it comes to food losses and food wastes data, the problem is amplified. Xue et al (Xue et al 2017) reviewed the food losses and food wastes data from 202 publications and found that most of the data is from the US and UK and secondary data are used in more than half of the publications. Therefore, it is necessary to obtain reliable lifecycle inventory data in the future to accurately estimate the environmental impacts of the cold chain.
- (ii)The cold chain network in China should be modeled in the future to support estimating the overall GHG emissions of the industry. The cold chain network particularly refers to the transportation stage of the cold chain. Although it is impossible to model the cold chain network, robust quantitative estimation of the pattern of perishable food products' distribution can be beneficial to understand the overall cold chain environmental impacts. One potential solution is to use the gravity model to estimate the cold chain network. Derived from physics, the gravity model contains a 'mass' indicator (e.g., population) and distances between regions to model elements flow (Zhang et al 2018a, Li et al 2019). Over the years, the gravity model has been widely applied to simulate the trade patterns, carbon footprint, LNG trade flows in the field of economics, energy, urbanization, and environment (Zhang et al 2018c, Zhang et al 2018a, Li et al 2019). Hence, the food trade and distribution patterns between Chinese provinces can also be potentially modeled by the macroeconomic data of each province through the gravity model. Besides, an industry-scale supply chain network is formed by each particular type of supply chain with a relatively static pattern, which can be used to approximate the travel distance of certain products in certain regions. For instance, as introduced in section 3.3, more than 50% of aquatic products are produced at five coastal provinces in China, which suggests the domestic trunk transportation of aquatic products is mainly from the regional centers of coastal provinces to other regional center cities (Gong and Liang 2006, Li 2016, National Bureau of Statistics of China 2020). Furthermore, understanding the cold chain structure is not only beneficial to study the environmental impacts but also help to understand the trading patterns of the food industry in China.
- (iii)Mechanisms of reducing GHG emissions require further development from aspects of regulation implementation, technology development, and industry planning. With HCFCs and high-GWP HFCs will be phased out, the use of R744 and R717 refrigerant is expected to grow in supermarkets and refrigerated warehouses, and hydrocarbons (e.g., R600) is promising in domestic appliances (United Nations Environment Programme 2019). Besides, the phase-out management plan also reduces HCFC blowing agents (e.g., R141b) for foams used as insulation materials (United Nations Environment Programme 2018d). However, enforced regulations and advanced mechanisms are still needed to support the transaction and reduce emissions in China. In September 2020, President Xi Jinping announced that China aims to be carbon-neutral by 2060 (Mallapaty 2020, Normile 2020). Most attention to achieving carbon-neutral is on the power generation section and carbon capture technologies (Normile 2020), whereas few researchers discussed the role of refrigeration in the carbon-neutral pathway. Considering the significant GWP of widely used refrigerants, it is also urgent to enforce clean refrigeration applications to help achieve the carbon-neutral goal. Currently, China is still the largest R22 producer in the world in 2016, though certain R22 phase-out goals have been achieved (Zhang et al 2019a, Booten et al 2020). Meanwhile, the use of HFCs has increased significantly since 2005 in China, and no enforced regulations regarding HFCs have been made (Fang et al 2016, Yao et al 2019). Additionally, appropriate refrigerant end-of-life management could potentially be an approach to reduce the emissions of the refrigeration sector. Although more than 90% of refrigerant is recovered, considering the large charge quantity of cold chain systems, the unrecovered refrigerant leads to significant emissions (United Nations Environment Programme 2018a). In the case of the air conditioner, it is discovered that if increasing the recycling rate of refrigerant to 50%, direct GHG emissions can be reduced by a maximum of 20% (Zhao et al 2015). Hence, it implies that increase the recycling rate of refrigerants in cold chain systems could potentially reduce GHG emissions.
- (iv)The environmental and social impacts beyond the GHG emissions of developing the cold chain industry in China should be investigated in the future. The environmental impacts of the cold chain is a general concept. It includes GHG emissions and also the emissions of other chemical substances (e.g., black carbon, abiotic depletion, photochemical oxidation, acidification), as well as the influences on water and land (Liu et al 2013, Hoang et al 2016, Heard et al 2017). However, the emissions of other chemical substances are rarely studies. Besides, the food losses and its effects on water and land in China are investigated by (Liu et al 2013), but it is merely for grain and not focusing on the cold chain. Since the cold chain could potentially reduce the food losses, it is crucial to exam how this reduce implies water and land. Moreover, Garnett (Garnett and Wilkes 2014) summarized that the supply chain and diet structure are gradually changing in China; Hence, it will be meaningful to continue to track the change with the development of the cold chain in the future.
In conclusion, the economic growth and increasing demand for high-quality food drive the rapid cold chain development in China. However, it should be aware that although China has the third-largest cold warehouse capacity in the world, the cold warehouse per capita is low (figure 2). Moreover, the more developed eastern and southern provinces have more cold chain resources. Additionally, when assessing the GHG emissions of the cold chain at the single-unit level (one kg food, one particular refrigerated warehouse), existing studies have two approaches to define the 'cold chain lifecycle'. In one approach, the food lifecycle from production to consumption is tracked but not the lifetime of cold chain facilities; in another approach, the lifetime of cold chain facilities is studied (e.g., refrigerated vehicle) but the food products are not considered. Both approaches did cover the entire picture of the cold chain. The overall cold chain emissions at the national scale (e.g., China) are not well known. Those two perspectives of estimating the single-unit level GHG emissions can be potentially extended to the national scale by aggregating up based on the cold chain facilities and networks pattern in China.
Acknowledgments
This work was supported by the National Science Foundation Environmental Sustainability program under Grant No. CBET 1804287. Any opinions, findings, and conclusions or recommendations expressed in this material are those of the author(s) and do not necessarily reflect the views of the National Science Foundation.
Data availability statement
All data that support the findings of this study are included within the article (and any supplementary files).