

Abstract
Vegetation fires across the tropics emit fine particulate matter (PM2.5) to the atmosphere, degrading regional air quality and impacting human health. Extensive vegetation fires occur regularly across the Amazon basin, but there have been no detailed assessments of the impacts on air quality or human health. We used updated exposure-response relationships and a regional climate-chemistry model, evaluated against a comprehensive set of observational data, to provide the first in-depth assessment of the potential public health benefits due to fire prevention across the Amazon Basin. We focused on 2012, a year with emissions similar to the 11-year average (2008 to 2018). Vegetation fires contributed >80% of simulated dry season mean surface PM2.5 in the western Amazon region particularly in Bolivia and Brazilian states of Rondônia, Acre, and Mato Grosso. We estimate that the prevention of vegetation fires would have averted 16 800 (95UI: 16 300–17 400) premature deaths and 641 000 (95UI: 551 900–741 300) disability adjusted life years (DALYs) across South America, with 26% of the avoided health burden located within the Amazon Basin. The health benefits of fire prevention in the Amazon are comparable to those found in Equatorial Asia.
Export citation and abstract BibTeX RIS

Original content from this work may be used under the terms of the Creative Commons Attribution 4.0 licence. Any further distribution of this work must maintain attribution to the author(s) and the title of the work, journal citation and DOI.
1. Introduction
Vegetation and peat fires are an important source of particular matter (PM) and trace gases to the atmosphere, which can degrade regional air quality and adversely impact human health. Ambient PM2.5 (PM with an aerodynamic median diameter less than 2.5 μm) is a leading risk factor contributing to mortality, morbidity and reduced life expectancy (Cohen et al 2017, Apte et al 2018). Exposure to PM2.5 from vegetation and peat fires is estimated to cause 179 000–339 000 premature deaths each year, equivalent to 5% of the present-day global burden of disease due to ambient PM2.5 exposure (Johnston et al 2012, Lelieveld et al 2015). Fires in tropical and sub-tropical regions are responsible for 90% of global PM2.5 fire emissions (Wiedinmyer et al 2011, Van Der Werf et al 2017), and fires are the dominant source of PM pollution across much of the tropics (Johnston et al 2012, Lelieveld et al 2015).
Fires in the tropics are influenced by both climate and land-use change (Heald and Spracklen 2015). Drought increases the incidence of fire in the Amazon (Arãgao et al 2008, da Silva et al 2018, Aragão et al 2018). Fire is used across the tropics to clear forest and other vegetation and prepare land for agriculture. In the Amazon, fire emissions are greater in years with higher deforestation rates (Arãgao et al 2008, Reddington et al 2015). Deforestation and forest degradation (Morgan et al 2019b) result in a fragmented forest landscape that is increasingly prone to fire (Cano-Crespo et al 2015, Alencar et al 2015). Deforestation also alters regional climate, increasing local temperatures (Baker and Spracklen 2019) and reducing regional rainfall (Spracklen et al 2012, Spracklen and Garcia-Carreras 2015, Zemp et al 2017). Smoke from fires further reduces rainfall through interactions with clouds and radiation (Kolusu et al 2015, Archer-Nicholls et al 2016, Liu et al 2020). Positive feedbacks between deforestation, drought, fire and smoke exacerbate the potential for tipping points in the Amazon climate (Nepstad et al 2008, Lovejoy and Nobre 2018).
Vegetation fires are the dominant source of PM over the Amazon (Martin et al 2010, Mishra et al 2015). The Amazon exhibits a strong seasonal cycle in vegetation fires and consequently PM concentrations (Martin et al 2010). During the wet season when there is little fire activity, PM2.5 concentrations across central Amazonia can be as low as 1.5 μg m−3 (Artaxo et al 2013). In contrast, during the dry season (August–October) when there are a large number of vegetation fires, regional dry season mean PM2.5 concentrations can exceed 30 μg m−3 (Artaxo et al 2013, Reddington et al 2016, Reddington et al 2019b) with daily mean peak concentrations exceeding 100 μg m−3 (Brito et al 2014). Global modelling studies confirm that fires are a dominant source of regional PM2.5 concentrations across the Amazon during the dry season (Johnston et al 2012, Lelieveld et al 2015, Reddington et al 2015, Reddington et al 2016, Reddington et al 2019b).
There is strong evidence of acute adverse health outcomes due to exposure to PM from Amazon fires. Positive associations between PM from vegetation fires and increased hospital admissions for respiratory health in children and the elderly have been demonstrated in the southern Amazon (Ignotti et al 2010, Do Carmo et al 2013, Machado-Silva et al 2020). PM from fires has also been found to exacerbate respiratory health in children and the elderly to a greater extent during drought years (Smith et al 2014, Machado-Silva et al 2020). The relationship between respiratory health and PM from fires has also been highlighted by positive associations between reduced peak expiratory flow in schoolchildren and increased PM during the dry season (Jacobson et al 2012, Jacobson et al 2014). Toxicology analysis has demonstrated PM from Amazon fires results in DNA damage in human lung cells (de Oliveira Alves et al 2017), shedding light on the mechanisms by which exposure to PM from vegetation fires adversely impact human health.
Despite studies demonstrating the impact of PM from fires on human health there have been no regional assessments quantifying the potential health burden using high resolution models. Previous studies of PM from vegetation fires have focused on the impacts on Amazonian weather and climate through aerosol-radiation and aerosol-cloud interactions (Zhang et al 2008, Zhang et al 2009, Wu et al 2011, Kolusu et al 2015, Archer-Nicholls et al 2016, Thornhill et al 2018, Liu et al 2020). Health burden assessment of the degraded air quality caused by Amazon fires have been restricted to coarse resolution global models (>100 km horizontal resolution) (Johnston et al 2012, Lelieveld et al 2015, Reddington et al 2015, Nawaz and Henze 2020) with limited in-depth analysis at a regional scales at finer resolutions. In comparison, Equatorial Asia, where vegetation and peat fires also result in poor regional air quality, has been studied in detail (Huang et al 2013, Reddington et al 2014, Kim et al 2015, Marlier et al 2015, Kiely et al 2019) and there are numerous assessments of the health burden. Reddington et al (2019a) found that the elimination of vegetation fires would avert 8 000 premature deaths annually across Southeast Asia (Myanmar, Thailand, Laos, Cambodia, and Vietnam). Marlier et al (2019) found the elimination of fires across Equatorial Asia (Indonesia, Malaysia, and Singapore) had the potential to avert 24 000 premature deaths per year. Similarly, Kiely et al (2020) estimated that the prevention of fires across Indonesia would avert an average of 15 000 premature deaths annually in 2004, 2006, and 2009. A number of studies focused on 2015, when drought conditions caused extensive fires and a major haze event, resulting in an estimated 44 000–100 300 premature mortalities across Equatorial Asia (Crippa et al 2016, Koplitz et al 2016, Kiely et al 2020). Here we quantify the impact of vegetation fires in South America on regional air quality and human burden of disease, with a focus on the Amazon. We used a high spatial resolution regional climate-chemistry model, evaluated against a comprehensive set of observational data to improve understanding of the magnitude and spatial distribution of simulated air pollutants from vegetation fires. We then used exposure-response relationships to provide an in-depth assessment of the burden of disease associated with exposure to PM2.5 from vegetation fires. Our findings provide advancement on previous air quality and health assessments within this region by combining a state-of-the-art high resolution climate-chemistry model with newly established exposure-response relationships.
2. Methods
2.1. Model description
We used the Weather Research and Forecasting online-coupled Chemistry model (WRF–Chem) version 3.7.1 (Grell et al 2005). The model domain covers most of South America (figure 1) with a horizontal resolution of 30 km, extending vertically from the surface to 10 hPa. Details of model setup are shown in supplementary table 1 is available online at stacks.iop.org/ERC/2/095001/mmedia.

Figure 1. The WRF-Chem model domain used in the study and associated land cover classification depicted by the MODIS Land Cover Type Data Product (MCD12Q1) International Geosphere-Biosphere Programme (IGBP). Flight tracks during the SAMBBA campaign are shown (Phase 1: 13–23 September; blue line, and Phase 2: 23 September–3 October 2012; red line). The eastern (4.5–15 °S, 43–50 °W) and western (6–12 °S, 54–68.5 °W) domains used for flight track evaluation are shown with black boxes. The location of the Porto Velho ground station is represented by a solid black triangle. Locations of AERONET stations are shown by the black crosses: Porto Velho UNIR (8.84 °S, 63.94 °W), Alta Floresta (9.87 °S, 56.10 °W), Rio Branco (9.96 °S, 67.87 °W), Cuiabá-Miranda (15.73 °S, 56.02 °W) and Santa Cruz UTEPSA (17.77 °S, 63.20 °W). White circles show the locations of annual PM2.5 measurements from the WHO database.
Download figure:
Standard image High-resolution imageGas-phase chemistry is calculated using the extended Model for Ozone and Related Chemical Tracers, version 4 (MOZART-4) (Emmons et al 2010, Knote et al 2014). Aerosol chemistry and microphysics is simulated using an updated Model for Simulating Aerosol Interaction and Chemistry (MOSAIC) with aqueous chemistry and four sectional discrete aerosol size bins: 0.039–0.156 μm, 0.156–0.625 μm, 0.625–2.5 μm, 2.5–10 μm (Zaveri et al 2008, Hodzic and Knote 2014). An updated volatility basis set mechanism was also included for secondary organic aerosol (SOA) formation (Knote et al 2015).
Microphysics is simulated using the Morrison 2-moment scheme (Morrison et al 2009) and the Grell 3D parameterisation is used for simulating convection (Grell and Dévényi 2002). Initial and boundary chemistry and aerosol conditions were taken from 6-hourly simulation data from the MOZART-4/Goddard Earth Observing System Model version 5 (GEOS5) (NCAR 2019). Initial and boundary meteorological conditions were taken from the European Centre for Medium–Range Weather Forecasts (ECMWF) global reanalysis (Dee et al 2011)
During model simulations, we nudged the meteorological components, horizontal and vertical wind, potential temperature and water vapour mixing ratio, to ECMWF re-analysis in all model levels above the planetary boundary layer over 6 h.
2.2. Model simulations
WRF-Chem simulations were conducted for the year 2012 at horizontal resolution of 30 km. We focused on the dry season (defined here as August 1st to October 31st) when vegetation fires are most active. We performed simulations from April to December, discarding the first month as model spin-up. We performed two types of simulations: one simulation excluding fire emissions ('fire_off') and one simulation including vegetation fire emissions ('fire_on'). The contribution of fires to PM2.5 was calculated as the difference in concentrations between these two simulations.
2.2.1. Non-fire emissions
Anthropogenic emissions were taken from the Emission Database for Global Atmospheric Research with Task Force on Hemispheric Transport of Air Pollution (EDGAR-HTAP) version 2.2 for the year 2010 at 0.1° × 0.1° horizontal resolution (Janssens-Maenhout et al 2015). A diurnal cycle was applied to anthropogenic emissions based on Olivier et al (2003). Biogenic volatile organic compound (VOC) and dust emissions were both calculated online by the Model of Emissions of Gases and Aerosol from Nature (MEGAN) (Guenther et al 2006) and through Goddard Global Ozone Chemistry Aerosol Radiation and Transport (GOCART) with Air Force Weather Agency (AFWA) modification (Chin et al 2000), respectively.
2.2.2. Fire emissions
We used fire emissions from the Fire Inventory from NCAR (FINN) version 1.5 (Wiedinmyer et al 2011) (see list of emissions species in supplementary table 2). Daily emissions are estimated on a 1 km2 grid based on the location and timing of active fires taken from the Moderate Resolution Imaging Spectroradiometer (MODIS) Fire and Thermal Anomalies Product (Giglio et al 2003). Each fire count is assigned a burned area (0.75 km2 for grassland and savannah and 1 km2 for other land covers). To account for missing fire retrievals due to cloud cover, FINN averages fire emissions over two days, assuming that the detected burned area will be half the original size the following day (Wiedinmyer et al 2011, Pereira et al 2016). Trace gas and aerosol emissions are calculated using emission factors (Akagi et al 2011, 2013, Yokelson et al 2013) in conjunction with MODIS Land Cover Type and Vegetation Continuous Fields. Fire emissions are emitted with a diurnal cycle that peaks in the early afternoon (local-time) based on Giglio (2007).
Buoyancy due to fire plumes can cause rapid injection of fire emissions above the ground surface (e.g., Fromm et al 2000). WRF-Chem can simulate this plume-rise from fires (e.g., Freitas et al 2007). However, previous modelling studies of Amazon fires during the dry season of 2012 shows this method overestimates the height of fire plumes (Archer-Nicholls et al 2015, Archer-Nicholls et al 2016). Observational work also found very little evidence of extensive elevated layers during the same simulation period, suggesting little evidence of pyroconvection (Darbyshire et al 2019). We therefore inject vegetation fire emissions evenly throughout the boundary layer (BL) (e.g., Dentener et al 2006), as supported by analysis of plume heights over the Amazon (Marenco et al 2016, Gonzalez-Alonso et al 2019).
Table 1 shows annual and dry season organic carbon (OC) and black carbon (BC) emissions from FINN v1.5 summed over our modelling domain. Emissions are dominated by OC, which contributes 90% of OC + BC emissions. In 2012, domain wide annual OC + BC emissions were 4 Tg a−1, approximately 17% greater than the 11-y (2008 to 2018) average (3.4 Tg a−1). The domain contributes 17% of global fire BC + OC emissions during 2008 to 2018 (figure 2(d)), highlighting the importance of fires in this region. Emissions are dominated by dry season fires, which account for 65% of annual OC emissions over the 11-y average. Fire emissions are greatest in southern areas of the Amazon (figures 2(a), (b)) which are undergoing land-use change. During 2008 to 2018, the Amazon accounted for 66% (72%) of annual (dry season) domain total OC emissions (table 1). Compared to the 11-y average, fire emissions in 2012 were enhanced across the Brazilian and Peruvian Amazon, but were lower across the Bolivian Amazon (figure 2(c)). Emissions were also higher in the eastern Cerrado region of Brazil in 2012 compared to the 11-y average, as supported by observed enhancement in Cerrado active fires in this region (supplementary figure 1). Previous work comparing FINN (v1.5) to the Global Fire Assimilation System (GFAS) (Kaiser et al 2012) and Global Fire Emissions Dataset (GFED) (v4s) (Van Der Werf et al 2017) in 2012, showed that emissions datasets had broadly similar spatial patterns of BC and OC emissions over the Amazon region. Emissions in FINN were greater compared to GFED and GFAS over western regions and lower compared to other datasets over eastern regions (Reddington et al 2019b). Comparison against measured aerosol concentrations suggested that GFED and GFAS emissions may be underestimated in the western Amazon and all emission datasets may underestimate in the eastern Amazon (Reddington et al 2019b).
Table 1. Domain wide and Amazon Basin annual and dry season (August–October) total organic carbon (OC) and black carbon (BC) emissions from FINN (v1.5). Emissions in 2012 are compared against the 11-y (2008 to 2018) average in parentheses.
| Emission species | Annual domain (Tg a−1) | Dry season domain (Tg a−1) | Amazon Basin annual | Amazon Basin dry season |
|---|---|---|---|---|
| OC | 3.6 (3.1) | 2.6 (2.0) | 2.4 (2.1) | 1.8 (1.5) |
| BC | 0.4 (0.3) | 0.3 (0.2) | 0.3 (0.2) | 0.2 (0.2) |
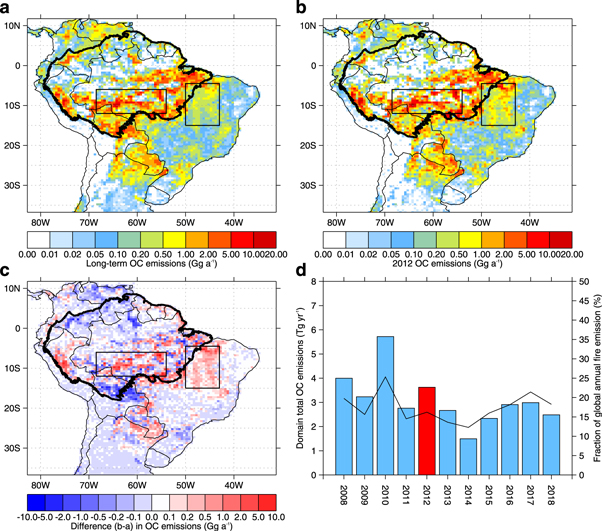
Figure 2. Annual organic carbon (OC) fire emissions from FINNv1.5 for (a) 2008 to 2018 average, (b) 2012, (c) 2012 minus 2008–2018 average. The black polygon in a-c marks the Amazon Basin. Black boxes in a-c are the western and eastern regions used in this analysis. (d) Domain wide annual OC emissions (bars) and the fraction of global fire emissions (OC + BC) contributed by the domain (black line). FINN emissions have been gridded to 0.5° × 0.5° resolution.
Download figure:
Standard image High-resolution image2.3. Measurements
We evaluate our WRF-Chem simulations against a comprehensive set of observational datasets from surface and aircraft collected as part of the South American Biomass Burning Analysis (SAMBBA) field campaign, which took place over the southern Amazon in September and October 2012 (Johnson et al 2016, Reddington et al 2019b). We compliment SAMBBA observations with additional surface and satellite measurements.
2.3.1. Statistical methods
In order to compare WRF-Chem to measurements, we linearly interpolated model output to the time and location of measured data. Comparison to aerosol mass measurements was conducted using simulated mass within the instrument detection ranges. Model evaluation was quantified using Pearson correlation coefficient (r), mean bias (MB) and normalised mean bias factor (NMBF) (Yu et al 2006):

where M and O are the model and observation value at location and timestep i. MB shows the deviation of the model to observation in the same units. NMBF is unitless and is interpreted as a factor NMBF + 1 by which the model under or overestimates the observation.
2.3.2. Surface measurements
We used surface particulate matter (PM) measurements from a forested site in south-western Amazon 5 km upwind from the city of Porto Velho (population of around 500 000) (Brito et al 2014) (figure 1). Composition resolved aerosol mass are available from an Aethalometer (Magee Scientific, model AE30) and an aerosol chemical speciation monitor (ACSM). The Aethalometer measured equivalent black carbon (BC) at a 5 min resolution, while the ACSM measured ammonium (NH4), nitrate (NO3), sulfate (SO4), chloride (Cl) and organic mass concentration in the 75–650 nm size range at a 30 min resolution. Measurements from both instruments were available from 6th September to 1st October 2012. Details regarding measurement uncertainty for both instruments can be found in Brito et al (2014) and Reddington et al (2019b). PM2.5 mass concentrations from a gravimetric filter analysis were used from May to October 2012, with a temporal resolution ranging 1 to ∼7 days (Artaxo et al 2013). Annual mean PM2.5 measurements for 2012 were taken from the World Health Organisation (WHO) Ambient Air Quality Database 2018 Update (WHO 2018) (figure 1). The WHO database is compiled such that PM2.5 are representative of annual mean city and town level concentrations using measurements from urban background locations. For consistency, PM2.5 concentrations were estimated using PM10:PM2.5 conversion factors at locations where PM10 measurements were only available (WHO 2018). We used WHO PM2.5 measurements from Brazil, Bolivia, Colombia, Ecuador, Peru, Paraguay and Uruguay (supplementary table 3).
2.3.3. Aircraft measurements
We used aerosol measurements taken during flights of the Facility for Airborne Atmospheric Measurements (FAAM) BAe-146 research aircraft as part of the SAMBBA campaign (Johnson et al 2016, Darbyshire et al 2019, Reddington et al 2019b). Measurements included organic aerosol (OA) in the 50–750 nm size range from an aerosol mass spectrometer (AMS) (Canagaratna et al 2007, Allan et al 2014) and refractive BC taken from a single-particle soot photometer (SP2) (Stephens et al 2003, Allan et al 2014). FAAM flight track paths are shown in figure 1. Following Johnson et al (2016) and Reddington et al (2019b), we split analysis of profile measurements into SAMBBA Phase 1 (13–22 September 2012; flights 1–8) and Phase 2 (23 September–3 October; flights 9–20), and by western region and eastern region (figure 1). We note, however, the smaller number of flights in the eastern region (one full flight and sections of three flights) compared to the western region (14 full flights and sections of 5 flights). To avoid additional data biases, data were removed when the FAAM aircraft were sampling in-plumes and within clouds, see Darbyshire et al (2019) for more details.
2.3.4. Aerosol optical depth measurements
We used spectral columnar aerosol optical depth (AOD) data from the Aerosol Robotic Network (AERONET) Cimel sun photometers (Holben et al 1998). We used Version 3 Level 2 cloud-screened and quality-assured daytime average AOD data (Giles et al 2019), retrieved at 500 nm at five stations located across the Amazon Basin (figure 1). Measurements were taken at 12:00 UTC.
Satellite-derived AOD was obtained from Moderate resolution Imaging Spectroradiometer (MODIS) on Aqua (MYD04_L2) and Terra (MOD04_L2) satellites. Collection 6.1, level 2, AOD was acquired at 550 nm for the dataset 'Dark Target Deep Blue Combined' (Levy et al 2013). Swaths of 10 km (at nadir) were resampled to 0.1° × 0.1° resolution. Data were aggregated to daily means. Because daytime overpass times are different for both Terra (10:30 LT) and Aqua (13:30 LT), we used model simulated AOD averaged between both overpass times and evaluated only on days when satellite data were available.
2.3.5. Radiosonde measurements
We used radiosonde measurements of potential temperature, water mixing ratio, relative humidity, wind speed and direction taken from the University of Wyoming database of radiosonde measurements (http://weather.uwyo.edu/upperair/sounding.html). Atmospheric sounding data were obtained at 12:00 UTC at 3 stations within the Amazon Basin: Porto Velho UNIR, Alta Floresta and Cuiabá-Miranda. At all 3 locations, WRF-Chem performs reasonably at simulating key atmospheric variables potential temperature, water mixing ratio, relative humidity, wind speed and direction (NMBF = −0.24 to 0.14, r = 0.7 to 0.99) during the dry season (supplementary figure 2).
2.4. Health burden calculation
We used simulated annual mean surface PM2.5 concentrations to quantify the health impact due to fires through the disease burden attributable to air pollution exposure. To estimate annual mean PM2.5 we assumed simulated concentrations in May and December are representative of January–April, when fire emissions are also low.
Using population attributable fractions of relative risk taken from associational epidemiology, intervention–driven variations in exposure (i.e., population exposure including and excluding vegetation fires) were used to predict associated variations in health burden outcomes. The population attributable fraction (PAF) was estimated as a function of population (P) and the relative risk (RR) of exposure:

The RR was estimated through the Global Exposure Mortality Model (GEMM) (Burnett et al 2018). We used the GEMM for non–accidental mortality (non–communicable disease, NCD, plus lower respiratory infections, LRI), using parameters including the China cohort, with age–specific modifiers for adults over 25 years of age in 5–year intervals. The GEMM functions have mean, lower, and upper uncertainty intervals. The theoretical minimum-risk exposure level for the GEMM functions is 2.4 μg m–3. The toxicity of PM2.5 was treated as homogenous with no differences for source, shape, or chemical composition, due to a lack of associations among epidemiological studies.
The effect of air pollution is known to be significantly different for morbidity and mortality from cardiovascular outcomes (IHD and STR) (Cohen et al 2017), and the relative risks from equation (1) were adjusted by equation (2) (RRadjusted) when estimating years lived with disability (YLD). The ratio for IHD and STR morbidity were 0.141 and 0.553 from the GBD2016 (Cohen et al 2017), based on data from three cohort studies (Miller et al 2007, Puett et al 2009, Lipsett et al 2011)

Premature mortality (MORT), years of life lost (YLL), and years lived with disability (YLD) per health outcome, age bracket, and grid cell were estimated as a function of the PAF and corresponding baseline mortality (IMORT), YLL (IYLL), and YLD (IYLD) following equations (3)–(5), respectively.


Disability–adjusted life years (DALYs), i.e. the total loss of healthy life, was estimated as the total of YLL and YLD:

The rates of MORT, YLL, YLD, and DALYs were calculated per 100,000 population. Mean estimates were quantified in addition to upper and lower uncertainty intervals at the 95% confidence level. The United Nations adjusted population count dataset for 2015 at 0.25° × 0.25° resolution was obtained from the Gridded Population of the World, Version 4 (GPWv4) (Doxsey-Whitfield et al 2015). Population age composition was taken from the GBD2017 for 2015 for early–neonatal (0–6 days), late–neonatal (7–27 days), post–neonatal (8–364 days), 1–4 years, 5 to 95 years in 5–year intervals, and 95 years plus (Global Burden of Disease Study 2017, 2018). Shapefiles were used to aggregate results at the country and state level (Hijmans et al 2012).
The health impacts of PM2.5 depend non-linearly on exposure, with impacts starting to saturate at high PM2.5 concentrations. We estimate the health benefits that would arise if fires were prevented, as the health burden from a scenario with fires (fire_on) minus the health burden from a scenario without fires (fire_off) (but including other emission sources). This is described as the 'subtraction' method (Kodros et al 2016, Conibear et al 2018).
3. Results and discussion
3.1. Surface PM
Figure 3 shows measured and simulated surface aerosol mass concentrations at Porto Velho, a location heavily influenced by vegetation fires. Before the dry season (May to July), measured PM2.5 concentrations are typically less than 3 μg m−3, peaking at 30–50 μg m−3 in August and September, followed by a decline in early October to less than 10 μg m−3 (figure 3(a)). The model captures this seasonal cycle relatively well (r = 0.57), but overestimates concentrations (NMBF = 0.72, MB = 7.6 μg m−3) largely due to an over prediction from mid-August to September. Simulated PM2.5 concentrations are underestimated in early August, possibly due to the missing fires at the start of the dry season in the FINN dataset (Reddington et al 2019b). Vegetation fires contributed ∼86% to simulated PM2.5 concentrations in August and September. In the simulation without fires, PM2.5 concentrations remain below 3 μg m−3 throughout May to December. At urban locations far from the fires, the model simulates annual mean surface PM2.5 concentrations to within 25% (supplementary figure 3; NMBF = −0.26, MB = −3.47 μg m−3).

Figure 3. Comparison of simulated and measured particulate matter concentrations at Porto Velho. (a) Time-series of mean PM2.5 between May and October 2012. Observed and simulated PM2.5 concentrations are averages over measurement sampling periods ranging from 1 to 7 d. (b) Hourly mean concentrations during the SAMBBA campaign (13th to 30th September 2012). Measurements of OA by ACSM, BC equivalent by aethalometer, and total mass including ACSM OA, nitrate, ammonium, chloride, sulfate and aethalometer BC (OA + NO3 + NH4 + Chl + SO4 + BC). Normalised mean bias factors are provided overall (NMBF) and for SAMBBA Phase 1 (NMBFP1) and Phase 2 (NMBFP2).
Download figure:
Standard image High-resolution imageDuring the SAMBBA campaign, measured concentrations of OA, BC and total aerosol mass show a decline in mass concentrations towards the end of the dry season, from 13th to 30th September 2012 (figure 3(b)). Overall, the model also overestimates OA (NMBF = 0.87), BC (NMBF = 0.2) and total aerosol mass (NMBF = 0.87) in September (figure 3(b)). The model performs better during SAMBBA Phase 1 (OA NMBF = 0.36; BC NMBF = 0.03; total aerosol mass NMBF = 0.37), compared to Phase 2 (OA NMBF = 3.51; BC NMBF = 0.60; total aerosol mass NMBF = 3.05). Measured and simulated aerosol mass (not shown) are dominated by OA (measured: 78.7%, model: 83.6%), with smaller contribution from BC (measured: 11.5%, model: 5.8%), and inorganics (NH4 + NO3 + Cl + SO4; measured: 9.8%, model: 10.6%). Analysis of OA:CO ratios in biomass burning smoke during the SAMBBA campaign suggests limited net gain of OA mass from secondary processes within fire plumes (Brito et al 2014, Morgan et al 2019a). We also find limited additional mass due to SOA formation, with SOA contributing <15% to simulated OA mass at Porto Velho.
3.2. Vertical profile
Figure 4 shows simulated and measured vertical profiles of OA and BC mass taken during the SAMBBA flight campaign. Following previous studies (e.g., Archer-Nicholls et al 2015, Reddington et al 2019b), we separate analysis into SAMBBA Phase 1 and Phase 2, and into western and eastern regions (section 2.3.3). Measured aerosol mass concentrations are greater in the lower 2.5 km in the west and the lower 4 km in the east, with concentrations rapidly declining above. Simulated concentrations capture the shape of the observed vertical profile (r ≥ 0.9), showing that distributing fire emissions through the BL is a reasonable assumption.
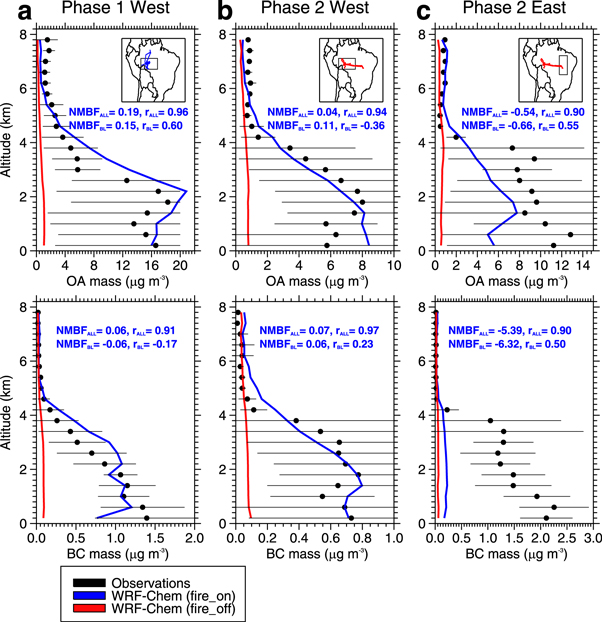
Figure 4. Mean observed (black circles) and simulated (coloured line) vertical profiles of OA and BC taken during the SAMBBA aircraft campaign. (a) Western Amazon during Phase 1 (Phase 1: 13–22 September 2012). (b) Western Amazon during Phase 2 (Phase 2: 23 September–3 October 2012). (c) Eastern Amazon (Phase 2). Inset maps show the western and eastern regions and flight paths (see also figure 1). Error bars show the standard deviation of the measurements. NMBF and correlation coefficient are shown for entire vertical profile (NMBFALL and rALL), and within the PBL (NMBFBL and rBL).
Download figure:
Standard image High-resolution imageIn the western Amazon, simulated BL concentrations of both BC and OA are in generally good agreement with observations (NMBF ≤ 0.15). Measured OA and BC concentrations show a reduction between Phase 1(OA: 15 μg m−3; BC: 1 μg m−3) and Phase 2 (OA: 7 μg m−3; BC: 0.6), consistent with the decline in measured surface concentrations at Porto Velho (figure 3). The model simulates this reduction in OA (observations: −56%; model: −58%) and BC (observations: −38%; model: −30%) concentrations, coinciding with the dry-to-wet-season transition. Previous modelling studies have struggled to simulate this observed reduction in the western Amazon, potentially due to poor simulation of wet removal of aerosols (Archer-Nicholls et al 2015, Reddington et al 2019b).
For the eastern region, simulated concentrations in the BL are underestimated (OA NMBF = −0.66; BC NMBF = −6.32), consistent with a previous study (Reddington et al 2019b). Measured BC:OA ratios in the BL are greater in the eastern region (0.16) compared to the western region (around 0.1). This may be caused by higher BC emission factors of flaming savannah fires in eastern Cerrado regions relative to the smouldering fires typical of tropical forest fires in western Amazon (Hodgson et al 2018, Darbyshire et al 2019). The underestimation of BC in the eastern region (observed: 1.4 μg m−3; model 0.2 μg m−3) may partly be a result of underrepresentation of emissions from Cerrado fires in eastern regions. However, we note the few flights were undertaken in the eastern region compared to western region (section 2.3.3).
3.3. AOD
Figure 5 shows daily mean simulated and observed AOD at 500 nm (AOD500) between May and December 2012 at five AERONET stations located in western and southern Amazon Basin. Measured AOD500 is typically <0.2 in May and June, increasing to 0.4 to 1.5 in August and September, reducing to <0.2 in December. The model captures this seasonal cycle relatively well (r = 0.61 to 0.88). May to December mean AOD500 is overestimated in western locations (Rio Branco, NMBF = 0.53, Porto Velho UNIR (NMBF = 0.47) and Santa Cruz UTEPSA (NMBF = 0.47), and well simulated compared to more eastern locations: Alta Floresta (NMBF = 0.03) and Cuiabá-Miranda (NMBF = −0.01).
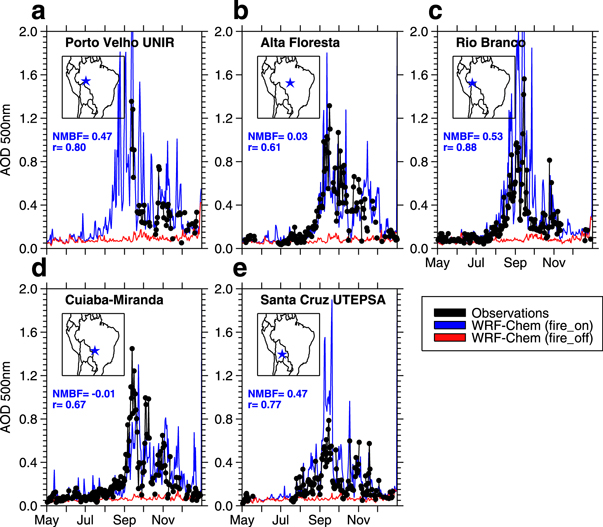
Figure 5. Daily mean observed (black circles) and simulated (coloured lines) aerosol optical depth (AOD) at 500 nm at five AERONET stations. (a) Porto Velho UNIR (8.84 °S, 63.94 °W). (b) Alta Floresta (9.87 °S, 56.10 °W). (c) Rio Branco (9.96 °S, 67.87 °W). (d) Cuiabá-Miranda (15.73 °S, 56.02 °W). (e) Santa Cruz UTEPSA (17.77 °S, 63.20 °W).
Download figure:
Standard image High-resolution imageComparison against AOD at 550 nm retrieved by MODIS (AOD550), confirms the model overestimates in the western Amazon and underestimates eastern regions (supplementary figure 4). AERONET AOD500 and MODIS AOD550 are found to compare well (supplementary figure 5) despite the different wavelengths. Evaluating against MODIS separately over evergreen broadleaf forest and savannah (cerrado) biomes and across the western and eastern regions shows an overall very small low bias in western forest bias regions with an equally small high bias in eastern cerrado regions (supplementary figure 6). The underestimation over savannah regions is considerably less than the underestimate against the one aircraft flight in the east, suggesting comparison against this one flight may not be representative. However, Reddington et al (2019b) also found PM and AOD were underestimated over regions with savannah and grassland fires, possibly suggesting FINN underestimates fire emissions in these regions.
3.4. Fire impacts on simulated PM2.5 and burden of disease
Some previous modelling studies of Amazon (Archer-Nicholls et al 2015, Johnson et al 2016) and other tropical fires (see Reddington et al (2019b) for a review) underestimate AOD and scale-up fire emissions to enable the model to match observed AOD. We find a consistent evaluation of regional boundary layer PM concentrations and AOD, with a slight overestimation over forested regions in the western Amazon and underestimation over savanna regions. Overall, simulated PM2.5 was typically within 25% of measurements both close to fires in the western Amazon and in urban regions far from fires. We therefore chose not to alter fire emissions and we use PM2.5 concentrations from the model runs with and without fire emissions to estimate impacts on human health.
Figure 6 shows simulated surface dry season PM2.5 concentrations. Greatest dry season concentrations (≥45 μg m−3) occur in the southern and western Amazon. Vegetation fires contribute up to 80%–95% of simulated dry season PM2.5 concentrations, with contributions >60% over most of the Brazilian Amazon, Bolivia, and much of Peru and Paraguay.
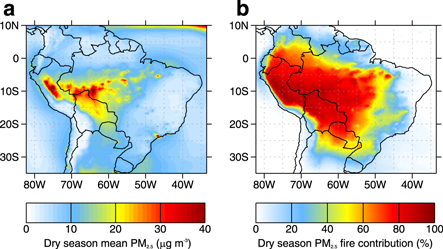
Figure 6. Simulated dry season (August to October) surface PM2.5 concentrations in 2012. (a) PM2.5 concentrations (b) percentage contribution due to fires.
Download figure:
Standard image High-resolution imageFigure 7 shows the regional distribution of dry season mean simulated PM2.5 concentrations. Vegetation fires increased regional mean PM2.5 concentrations by 260% over the Amazon Basin in 2012, exposing 20 million people to dry season mean concentrations above 10 μg m−3 and 3.3 million people to concentrations over 25 μg m−3. Similarly large increases are also simulated at the national scale for Peru (394%) and Bolivia (509%) where 7% (1.36 million people) and 4% (0.42 million people) are exposed to PM2.5 levels above 25 μg m−3, respectively. Fires have a marked impact on annual concentrations and thus chronic exposure (see also supplementary figure 7), increasing annual mean population-weighed PM2.5 concentrations by 35% and 137% in Peru and Bolivia, respectively (table 2). By comparison, vegetation fires increased the national regional dry season mean PM2.5 by a smaller amount in Brazil (148%) in 2012, exposing 14.4 million people to levels above 25 μg m−3 in the dry season, increasing annual mean population-weighed PM2.5 concentrations by 10%.
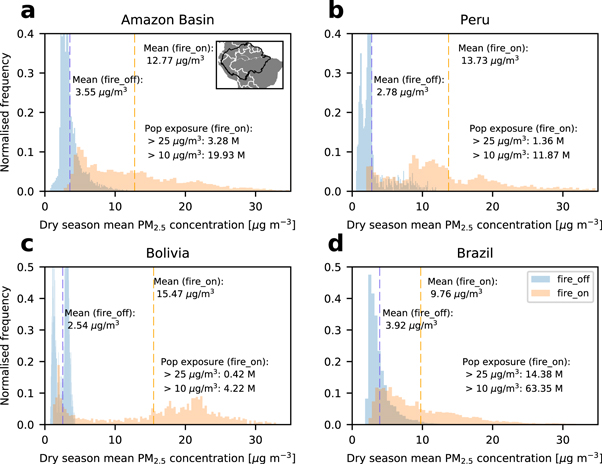
Figure 7. Simulated distribution of dry season (August to October) surface PM2.5 concentrations in 2012. (a) Amazon Basin, (b) Peru, (c) Bolivia, and (d) Brazil. Histograms show mean PM2.5 distribution for WRF-Chem simulations with (fire_on) and without (fire_off) fire emissions, with vertical dashed lines representing the distribution mean for each simulation. The number of people exposed (in millions M) to mean concentrations above 25 (WHO 24-h guideline) and 10 (WHO annual guideline) μg m−3 is also shown.
Download figure:
Standard image High-resolution imageTable 2. Annual mean population-weighted PM2.5 concentrations in 2012 for WRF-Chem simulation (fire_on). Values in parentheses show the increase to due vegetation fires.
| Country | Pop-weighted PM2.5 (μg m−3) |
|---|---|
| Bolivia | 4.1 (137%) |
| Brazil | 10.3 (10%) |
| Peru | 6.2 (35%) |
| Brazilian state | |
| Acre | 10.5 (222%) |
| Amazonas | 9.2 (59%) |
| Mato Grosso | 7.5 (168%) |
| Rondônia | 10.4 (278%) |
| São Paulo | 19.9 (5%) |
Due to the proximity of fires, western states of Brazil are impacted by fires disproportionately. Figure 8 shows regional distribution of dry season mean simulated PM2.5 concentrations in four western states of Brazil (Acre, Amazonas, Mato Grosso, and Rondônia) and the state of São Paulo in south-eastern Brazil. Vegetation fires increase regional PM2.5 concentrations considerably in western states (296%–791%), exposing the majority of state populations to dry season mean PM2.5 concentrations above 25 μg m−3 in Rondônia (53%) and Acre (75%). Fires similarly increase annual mean population-weighted PM2.5 concentrations considerably in these western states (59%–278%), highlighting the impact on chronic exposures. In contrast, exposure to unhealthy PM2.5 concentrations in outflow regions such as São Paulo is largely due to other anthropogenic emissions with fires playing a limited intermittent contribution. Nevertheless fires can contribute to very high concentrations in outflow regions, leading to a 39% increase in dry season regional mean concentrations and a 5% increase in annual mean population-weighted concentrations in São Paulo.
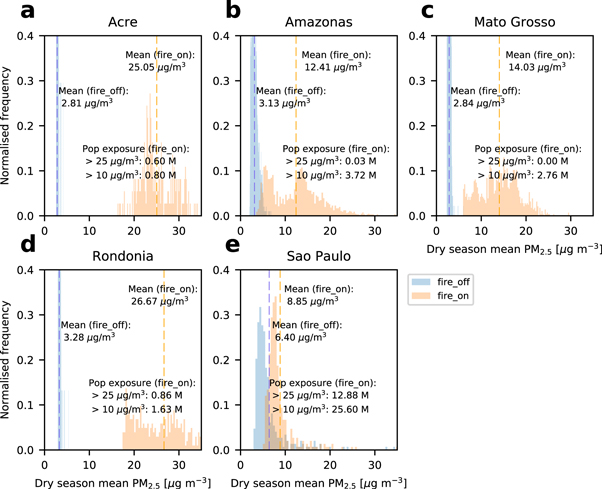
Figure 8. Simulated distribution of regional dry season (August to October) surface PM2.5 concentrations in 2012 for five Brazilian states. (a) Acre, (b) Amazonas, (c) Mato Grosso, (d) Rondônia, and (e) São Paulo. Histograms show mean PM2.5 distribution for WRF-Chem simulations with (fire_on) and without (fire_off) fire emissions, with vertical dashed lines representing the distribution mean for each simulation. The number of people exposed (in millions M) to mean concentrations above 25 (WHO 24-h guideline) and 10 (WHO annual guideline) μg m−3 is also shown.
Download figure:
Standard image High-resolution imageFigure 9 shows the estimated reduction in the regional burden of disease that would occur if all vegetation fires were prevented. We estimate that the prevention of vegetation fire emissions had the potential to avoid 641 00 (95UI: 551 900–741 300) DALYs and 16 800 (95UI: 16 300–17 400) premature deaths across our South American domain in 2012. We found that approximately 26% of the avoided DALYs (167 900 (95UI: 143 800–194 900)) and deaths (4 300 (95UI: 4 100–4 500 )) due to fire prevention were located inside the Amazon Basin. At the national level, preventing vegetation fires could have prevented 9 770 (95UI: 9 690–9 870) premature mortalities in Brazil, 1 467 (95UI: 1 340–1 590) in Peru and 1 195 (95UI: 985–1 410) in Bolivia (table 3). Per capita health burdens remove population size dependence highlighting the impact of fires on public health. The per capita avoided heath burden is greatest in Bolivia (789 (95UI: 605–979) DALYs per 100 000 people) and Paraguay (644 (95UI: 531–772) DALYs per 100 000 people) followed by Brazil (597 (95UI: 524–680) DALYs per 100 000 people). Brazilian states of Rondônia, Acre, and Mato Grosso benefit the most from fire prevention with 1300–1800 DALYs per 100 000 people avoided (figure 9 and supplementary table 4). High disease burden rates in these western Brazilian states and wider Amazon Basin, highlights the adverse impact of vegetation fires on regional public health.

Figure 9. The averted burden of disease due to the prevention of vegetation fires in 2012 using the GEMM NCD + LRI exposure-response function. (a) Total averted disability-adjusted life years (DALYs), and (b) averted DALYs as rate per 100,000 persons.
Download figure:
Standard image High-resolution image
Table 3. Averted burden of disease due to the prevention of vegetation fires in 2012 using the GEMM NCD + LRI exposure-response function. Values shown are estimates using the 'substitution' method.
| Country | DALYs | DALYs rate per 100 000 | Mortality | Mortality rate per 100 000 |
|---|---|---|---|---|
| Argentina | 55 065 (48 341–62 787) | 121 (106–138) | 1 806 (1 765–1849) | 4 (4–4) |
| Bolivia | 43 320 (33 246–53 764) | 789 (605–979) | 1 195 (985–1 409) | 21.8 (18–26) |
| Brazil | 385 173 (338 408 –438 639) | 597 (524–680) | 9 774 (9 686–9 865) | 15.1 (15–15) |
| Chile | 1 053 (910–1 219) | 3 (3–4) | 29 (29–29) | 0.1 (0–0.1) |
| Colombia | 34 096 (29 290–39 703) | 124 (107–145) | 866 (854–879) | 3.2 (3–3.3) |
| Ecuador | 32 394 (27 610–37 806) | 256 (218–299) | 861 (822–900) | 7 (7–7) |
| Guyana | 138 (121–159) | 43 (37–49) | 4 (4–4) | 1 (1–1) |
| Paraguay | 21 978 (18 139–26 371) | 644 (531–772) | 555 (503–613) | 16.2 (15–18) |
| Peru | 57 947 (47 378–69 587) | 422 (345–506) | 1 467 (1 336–1 591) | 11 (10–12) |
| Suriname | 289 (247–337) | 58 (50–68) | 8 (7–9) | 1.6 (2–2) |
| Uruguay | 2 293 (2 031–2 595) | 120 (106–136) | 83 (82–85) | 4 (4–4) |
| Venezuela | 7 186 (6 174–8 336) | 34 (30–40) | 195 (185–204) | 1 (1–1) |
| Total | 640 938 (551 892–741 303) | — | 16 845 (16 256–17 437) | — |
| Amazon Basin: | 168 000 (143 800–194 900) | 4 300 (4 100–4 500) |
Our estimated health impacts are consistent with previous estimates for South America from global models but provide advancement due to the use of a high resolution regional model and updated exposure-response relationships. Johnston et al (2012) estimated preventing fires would avoid 10 000 premature deaths annually between 1997–2006. Reddington et al (2015) estimated prevention of vegetation fires would avert ∼7000 to 9700 premature deaths annually between 2002–2011.
In contrast to the Amazon Basin and the wider South American region, numerous air quality health assessments due to vegetation fires have been conducted across Equatorial Asia. Marlier et al (2019) found the prevention of fires across Equatorial Asia (Indonesia, Malaysia, and Singapore) would avert 24 000 premature deaths annually in the present-day. Using a similar WRF-Chem setup as used in this study, Reddington et al (2019a) estimated the prevention of fires would avoid 8,000 premature deaths annually across Southeast Asia (Myanmar, Thailand, Laos, Cambodia, and Vietnam) in the present-day. Using a similar WRF-Chem setup as used in this study, Kiely et al (2020) found that the prevention of vegetation and peat fires would avert 15 000 premature deaths and 500 000 DALYs annually in 2004, 2006, and 2009 across Equatorial Asia. A number of studies focused on 2015, where drought induced fires resulted in a major haze event across Equatorial Asia, and caused an estimated 44 000–100 300 premature mortalities (Crippa et al 2016, Koplitz et al 2016, Kiely et al 2020).
Calculated health burdens are sensitive to both simulated PM exposure and exposure-response relationships (Ostro et al 2018, Burnett and Cohen 2020). For the 2015 haze event in Equatorial Asia, Kiely et al (2020) found that exposure-outcome associations have the largest influence on health impact estimates. Kiely et al (2020) used the same exposure-outcome association as this study (GEMM NCD + LRI) and estimated 44,000 premature deaths in 2015. In contrast, Koplitz et al (2016) used an exposure-outcome association based on work from Schwartz et al (2008), Anenberg et al (2012), Lepeule et al (2012), with a 1% in all-cause mortality per 1 μg m−3 increase in annual average PM2.5 concentrations. Koplitz et al (2016) estimated 100,300 premature deaths in 2015. When Kiely et al (2020) used the same exposure-outcome association they estimated a similar premature death estimate of 106,000 deaths in 2015. Marlier et al (2019) also used a similar exposure-outcome association to that used in Koplitz et al (2016), based on work from Vodonos et al (2018).
Both the Vodonos et al (2018) exposure-outcome association and the GEMM NCD + LRI rely on epidemiological studies from ambient PM2.5 exposure only, including some from high-exposure locations, and include all non‐accidental causes of death. The current integrated exposure-response (IER) association from Global Burden of Disease GBD2017 is based on studies of ambient and household air pollution, passive smoking, and active smoking exposures and is cause-specific for six causes of death (Burnett et al 2014). The risk responses of Vodonos et al (2018) and the GEMM NCD + LRI are similar for exposures up to 50 μg m−3. At exposures greater than 50 μg m−3 these functions diverge, with the GEMM NCD + LRI risk flattening off at higher concentrations. The IER has lower risks than either Vodonos et al (2018) and the GEMM NCD + LRI, and flattens off at lower concentrations. For example, Nawaz and Henze (2020) estimated 4 407 premature deaths per year on average between 2016 and 2019 in Brazil from biomass burning derived ambient PM2.5, which is approximately half of our estimate for Brazil in 2012, primarily due to their use of the IER from GBD2016 which has approximately half the attributable risks of the GEMM NCD + LRI that we used in this study.
These large differences emphasise the need to reduce these uncertainties and for further epidemiological studies from highly polluted regions of the world (Burnett and Cohen 2020, Pope et al 2020). We used the GEMM NCD + LRI here to be consistent with the latest exposure-outcome associations for ambient PM2.5 exposure only, to include causes beyond that considered by the current IER in the GBD2017, and to be conservative of risk estimates at higher exposures.
Fire emissions in the tropics depend on land-use change and climate conditions and can exhibit strong interannual variability. Reddington et al (2015) found greater health impacts in years with greater fires due to drought or deforestation. Fire emissions in the Amazon in 2012 were comparable to the 11-y average (figure 1). Years with more fires, due either to drought conditions or greater deforestation and land-use change, would have greater emissions, PM concentrations and likely greater associated public health impacts. Future work is needed to understand the year to year variability in health impacts due to PM from fires in the region.
4. Conclusion
We used a high-resolution regional air quality model to assess the impacts of vegetation fires on regional South American air quality and estimate the public health benefits resulting from prevention of fires. We studied 2012, a year with emissions similar to the long-term (2008 to 2018) average. PM2.5 and AOD was evaluated against a comprehensive set of surface, aircraft and satellite measurements, with model typically matching measurements within 25%. Fires are the dominant pollution source, contributing more than 80% of surface PM2.5 concentrations across the southern Amazon during the dry season. Fires in the Amazon account for ∼70% of fire emissions across our South American domain and 12% of global fire emissions.
We found that the prevention of vegetation fires in the region would avert 641 000 (95UI: 551 900–741 300) DALYs and 16 800 (95UI: 16 300–17 400) premature deaths due to the reduction in PM2.5 exposure across South America. The greatest reduction in disease burden rates occurs in regions close to intense fire activity: Bolivia, Paraguay, and the western states of Brazil, including Rondônia, Acre, and Mato Grosso, with 26% of the avoided health burden located within the Amazon Basin. We find that exposure to PM from fires in the Amazon has a similar public health impacts to fires in Equatorial Asia, which have been more extensively studied. Our analysis highlights the substantial public health benefits that could be achieved through prevention of vegetation fires across the Amazon. Future work needs to quantify the air quality degradation specifically caused by fires associated with deforestation and forest degradation, providing further evidence for the health benefits that would result from reduced deforestation (Reddington et al 2015). The deforestation rate in the Amazon increased from 2014 to 2019 with more fires in 2019 compared to recent years (Barlow et al 2020). The future frequency of fire in the Amazon will depend on land-use and climate change, with projected increases in fire occurrence of 20%–100% over the coming decades (Fonseca et al 2019). Achieving reductions in fire in a hotter and potentially drier Amazon (Boisier et al 2015) will require strong environmental governance.
Acknowledgments
This work received funding from the Natural Environment Research Council (NERC) through the SAMMBA project (NE/J009822/1; NE/J010073/1) and the European Research Council (ERC) under the European Union's Horizon 2020 research and innovation programme (Grant agreement No. 771492). We acknowledge support from the United Bank of Carbon (UBoC) and Spracklen acknowledges support from a Philip Leverhulme Prize. Reddington was supported by AIA Group. This work was undertaken on Advanced Research Computing, part of the High Performance Computing facilities at the University of Leeds, UK.