

Abstract
Leaf chlorophyll content declines in response to environmental stressors and during natural senescence periods. Assessments of forest health and vulnerability to stressors require repeated measurements of forest health to quantify declines in chlorophyll content and identify shifts in the timing of key phenological events. Although remote sensing is ideal for making reliable and repeated forest health measurements to assess forest response to environmental change over large areas, reliable warning systems for monitoring plant health are lacking. To facilitate the estimation of chlorophyll content from remotely sensed data, we define the relationships between leaf chlorophyll content and spectral indices in European beech trees (Fagus sylvatica). We show that hand-held chlorophyll meters can be calibrated to leaf chlorophyll content providing a non-destructive method for rapid assessment of leaf chlorophyll content in the field. Spectral indices based on the red edge spectral region have the strongest relationship with leaf chlorophyll content (mND705 R2 = 0.95, RMSE = 4.70; mSR705 R2 = 0.95, RMSE = 4.71) but are unable to discriminate between photosynthetically active leaves and inactive leaves. Alternative spectral indices can discriminate effectively between photosynthetically active and inactive leaves but are less well suited to defining declines in chlorophyll content. These findings reveal key research needs for improving the use of remote sensing data for forest health assessments.
Export citation and abstract BibTeX RIS

Original content from this work may be used under the terms of the Creative Commons Attribution 4.0 licence. Any further distribution of this work must maintain attribution to the author(s) and the title of the work, journal citation and DOI.
Introduction
Plant pigment concentrations are important for understanding plant-environment interactions. Most plants contain light absorbing compounds that are located in the thylakoid membranes of chloroplasts. The chlorophyll a molecule is typically the most abundant pigment, but accessory pigments such as chlorophyll b, β carotene, and xanthophyll all absorb light energy for conversion to chemical energy by photosynthesis [1]. Plants absorb light energy for photosynthesis primarily using the chlorophyll pigments (chlorophyll a and chlorophyll b) and these essential pigments are found in the highest concentrations in healthy leaf material. Leaf chlorophyll content is a primary factor regulating the photosynthetic potential of plant material and is therefore a major determinant of primary productivity [2, 3]. When exposed to environmental stress and during natural senescence periods, chlorophyll content declines in tandem with plant growth [1, 4]. The ability to characterise changes in chlorophyll concentration in vivo during stress events or senescence periods can provide important insights into plant-environment interactions, help to assess plant health, and determine growth potential. The repeated measurement of chlorophyll content over large areas provides an extremely useful mechanism to improve our understanding of plant-environment interactions and provide evidence to inform forest management, by detailing subtle changes in chlorophyll content that will enable changes in plant health and shifts in natural phenology cycles to be characterised [5, 6].
Traditionally, leaf chlorophyll content is estimated using destructive analytical techniques that extract chlorophyll molecules from leaf material using a solvent and subsequently determine the absorbance of the resulting chlorophyll solution using a spectrophotometer. Chlorophyll content is determined from absorbance readings using well-established equations that are specific to the solvent and resolution of the spectrophotometer used [7]. This method for extracting chlorophyll is regarded as the gold standard for measuring leaf chlorophyll content. However, destructive sampling is costly and time consuming, and the nature of the analysis means that leaf samples must be transferred quickly to cold storage to preserve the pigment content before the extraction and analysis of the samples in a laboratory. These restrictions limit the spatial and temporal scope of studies that can use laboratory extraction methods to understand plant-environment interactions due to limitations on the logistical requirements to repeatedly collect, store and analyse leaf samples collected across large areas.
Studies covering large areas or that involve repeated measurements require non-destructive methods for chlorophyll estimation to overcome logistical constraints that restrict extraction-based measurements. Hand-held chlorophyll meters estimate relative chlorophyll content by measuring the absorbance of leaf material, typically at two wavelengths at 650 nm (red) and 940 nm (near-infrared). While hand-held chlorophyll meters provide a practical means by which to collect reference data on leaf chlorophyll content, they cannot easily provide canopy-level data in studies covering large areas. Reflectance spectroscopy and remote sensing approaches have been well researched to enable the estimation of plant chlorophyll content across large areas [3, 5, 8, 9]. Reflectance spectroscopy approaches allow fine resolution spectral data to be collected at the leaf level that can then be used to inform the specification and analysis of data collected using imaging sensors mounted on unmanned aerial vehicles (UAV), aircraft or satellites. Field spectrometers collect data in up to 2000 spectral bands, yet these spectral bands have a high degree of collinearity and so appropriate transformations are required to reduce the number of spectral bands required to estimate chlorophyll content. The use of reflectance spectroscopy for estimating leaf chlorophyll content has received attention in the literature and many studies have sought to identify spectral indices that are highly correlated with leaf chlorophyll content [5, 10, 11]. Identifying practical solutions for the estimation of plant chlorophyll content from these studies is challenging due to the wide variety of spectral indices published and lack of published data or information on regression equations used to fit spectral indices to chlorophyll content [1]. This lack of information hinders a meaningful comparison of indices across different studies. The practical application of spectral indices is further confounded because, in many cases, new indices are derived from a limited selection of species and so the use of the spectral indices on alternative species requires investigation for new applications [1, 5].
Assessments of forest vulnerability to stressors are crucial for informing forest planning and management interventions in order to avoid potentially irreversible loss of forest biomass or to identify outbreaks of pathogens and pests [12]. However, warning systems for monitoring plant health are lacking. While chlorophyll content declines during stress events, the timing of a stress event may cause a decline in chlorophyll content during peak growing season or may cause a shift in the typical phenological cycle, resulting in the early senescence of leaves (figure 1). The potential for a decline in peak chlorophyll content and shifts in the timing of phenological events requires spectral indices that can be repeatedly measured and are sufficiently sensitive to chlorophyll content to capture response of trees to a stress event. Many studies have, therefore, attempted to characterise the impact of drought on forests using satellite remote sensing data [13–16]. Such studies primarily attempt to relate changes in precipitation and temperature to remotely sensed Normalised Difference Vegetation Index (NDVI) but show mixed success. While data from satellite sensors enables repeated measurement of the land surface, NDVI is known to suffer from a saturation at high biomass and is not sufficiently sensitive to leaf chlorophyll content to provide an early indicator of chlorophyll decline in broadleaf species [5, 17, 18]. Consequently, there is good reason to believe that NDVI is not an ideal indicator of stress response despite the widespread use of the index in studies of forest health decline.
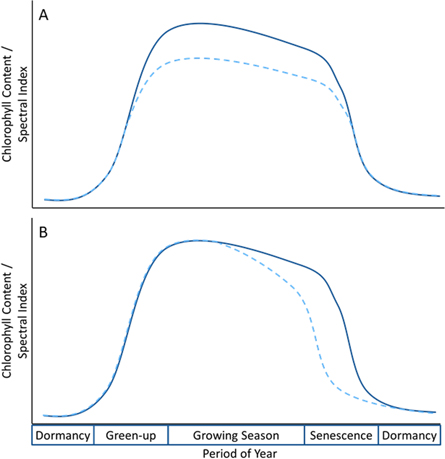
Figure 1. Conceptualised progression of leaf chlorophyll content or a spectral index over a natural phenological period for a deciduous broadleaf species. The solid line represents a typical phenological pattern and the dashed line represents a change in chlorophyll content under atypical environmental conditions. In panel A, a reduction in peak chlorophyll content is observed without a shift in phenological timing while in panel B, peak chlorophyll content remains the same but early onset of senescence is observed.
Download figure:
Standard image High-resolution imageAn improvement in our ability to detect declines in chlorophyll content and identify shifts in the timing of key phenological events is essential to further our understanding of how temperate broadleaf forests respond to environmental stress and enable effective decision making for intervention management during stress events [12]. European beech (Fagus sylvatica) is the continent's most widespread broadleaf forestry species dominating some 15 Mha of Europe and is susceptible to drought [19]. While many studies include European beech leaves in investigations of spectral indices, few studies exist that define species-specific relationships between chlorophyll content and spectral properties of beech leaves in mature forests, which in combination with the predominant use of NDVI, restricts the development of appropriate remote sensing methods for forest health monitoring. There is, therefore, a clear need to improve our understanding of how sensitive alternative spectral indices are to declines in chlorophyll content in European beech forests. To improve our understanding, we define the relationship between spectral indices and chlorophyll content in European beech leaves to identify the point at which declines in leaf chlorophyll content can be determined in order to facilitate the development of effective methods to monitor forest health decline.
Method
Fifty leaf samples were collected from mature European beech (Fagus sylvatica) trees in a mixed woodland (Chopwell Woods, UK) during the autumn senescence period, capturing a wide range of leaves with total chlorophyll content between 0–70 μg cm−2. Leaf samples varied in colour from dark green to brown and all leaf samples were collected while leaves were still attached to a live, mature tree. During senescence, leaves often turn brown before falling from the branch and so characterising brown leaves as well as yellow and green leaves is critical to capture the full phenological response that might be captured in remote sensing data. Leaf-level measurements were taken to record spectral reflectance and hand-held chlorophyll meter values, and the leaf samples were stored in the dark at −80 °C until subsequent laboratory chlorophyll extraction and spectrophotometer analysis.
Hand-held chlorophyll meter
A hand-held SPAD-502 chlorophyll meter (Minolta Camera Co.) was used to calculate relative chlorophyll content. The SPAD-502 meter measures Optical Density Difference at 650 nm and 940 nm using a proprietary equation to return a unitless estimate of chlorophyll content between −9.9 and 199.9. Chlorophyll absorbs light in the red region (650 nm) while the near-infrared (940 nm) is used as a reference to adjust for differences in spectral properties not related to chlorophyll content, such as leaf structure. Three measurements were taken from each leaf sample and the mean value was used for all subsequent analysis.
Leaf reflectance
Leaf spectral reflectance was measured at 1 nm spectral intervals using an ASD fieldspec 3 spectroradiometer (spectral range: 350–2500 nm, spectral resolution: 3 nm at 700 nm and 10 nm at 1400/2100 nm, samples taken every 1.4 nm between 350–1050 nm and every 2 nm between 1000–2500 nm; Malvern Panalytical). Reflectance measurements taken with the ASD fieldspec 3 spectroradiometer were calibrated against a Spectralon reference panel with repeat calibration every five leaf samples. Individual leaves were mounted against a Spectralon panel and leaf reflectance measurements were collected using a contact probe that contains a dedicated light source. The spectral reflectance (R) measurements were transformed into spectral indices using either simple (Ra/Rb) or normalised difference ((Ra − Rb)/(Ra + Rb)) ratios using the hsdar package in R [20], to test published indices that have been shown to correlate with leaf pigment content in other plant species (table 1). Spectral indices typically compare reflectance values from two regions of the electromagnetic spectrum, one measurement from a region that is sensitive to chlorophyll content compared against a measurement from a region that is less sensitive to chlorophyll content, such as the near-infrared. Reflectance values from the green (550 nm) or red-edge (700 nm) regions are preferred in spectral indices for pigment estimation because they are more sensitive to high chlorophyll concentrations than the main absorption features (positioned in the blue and red spectral regions) which saturate as chlorophyll concentration increases.
Table 1. Published spectral indices investigated in this study and their formula. The naming of the spectral indices come from the hsdar r package [20] and are not necessarily the original name given by the referenced authors due to inconsistencies in the naming of spectral indices between studies. In the formulae below, R695 corresponds to the reflectance value recorded at 695 nm.
| Spectral index | Formula | Original Reference |
|---|---|---|
| Simple Ratios | ||
| Carter | R695/R420 | Carter (1994) |
| Carter2 | R695/R760 | Carter (1994) |
| Carter3 | R605/R760 | Carter (1994) |
| Carter4 | R710/R760 | Carter (1994) |
| Carter5 | R695/R670 | Carter (1994) |
| GI | R554/R677 | Smith et al (1995) |
| mSR705 | (R750-R445)/(R705-R445) | Sims and Gamon (2002) |
| PSSR | R800/R635 | Blackburn (1998) |
| SR1 | R750/R700 | Gitelson and Merzlyak (1997) |
| SR3 | R750/R550 | Gitelson and Merzlyak (1997) |
| SR6 | R750/R710 | Zarco-Tejada and Miller (1999) |
| Difference ratios | ||
| Datt | (R850-R710)/(R850-R680) | Datt (1999b) |
| Gitelson2 | (R750-R800/R695-R740)-1 | Gitelson et al (2003) |
| Green NDVI | (R800-R550)/(R800 + R550) | Gitelson et al 1996 |
| mND705 | (R750-R705)/(R750 + R705-2*R445) | Sims and Gamon (2002) |
| NDVI | (R800-R680)/(R800 + R680) | Tucker (1979) |
| NDVI2 | R750-R705)/(R750 + R705) | Gitelson and Merzlyak (1994) |
| NDVI3 | (R682-R553)/(R682 + R553) | Gandia et al (2004) |
| PRI | (R531-R570)/(R531 + R570) | Gamon et al (1992) |
Chlorophyll extraction
For destructive chlorophyll extraction, an 11 mm disk was cut from each leaf, avoiding the midrib, and ground to a fine powder in an agate pestle and mortar using liquid nitrogen. The chlorophyll pigments were serially extracted by grinding the sample with four 2.5 ml aliquots of 80% aqueous acetone and transferred into a clean glass test-tube. The solution was then passed through a 0.2 μm Polytetrafluoroethylene syringe filter into a clean sealable glass tube before absorbance measurements were taken using a Cary 50 UV–vis Spectrophotometer (spectral range 190–1100 nm, spectral bandwidth 1.5 nm, wavelength accuracy ±0.07 at 541.94 nm and ±0.24 at 260.54 nm, wavelength reproducibility ±0.01; Agilent Technologies). Baseline correction of spectral measurements was performed by measuring a blank sample of 80% aqueous acetone prior to sample measurement. Absorbance was measured between 300–800 nm at 1 nm intervals, but only the absorbance at 663 nm (A663) and 646 nm (A646) are required for chlorophyll estimation using the equations defined by Wellburn [7]. Chlorophyll a and Chlorophyll b are calculated separately (equations (1) and (2) respectively) and then summed to return total leaf chlorophyll content which is used throughout the subsequent analysis.


Data analysis
The relationship between total chlorophyll content, as defined through acetone extraction, and the relative measure of chlorophyll content from the SPAD-502 meter was assessed using a linear model with a square root transformation on chlorophyll content. Spectral indices were regressed against total chlorophyll content and SPAD values independently to assess the ability of spectral indices to characterise absolute chlorophyll content. SPAD values were regressed against total chlorophyll content to evaluate the use of the SPAD-502 meter to validate relative chlorophyll estimates derived from remotely sensed images. In previous studies the curvilinear relationship between chlorophyll content and spectral indices has typically been characterised using polynomial forms. However, we found that polynomial forms did not adequately characterise the relationship here due to a sharp change in the slope of the regression curve between total chlorophyll content and spectral indices. We therefore compared second-order polynomial regression against a segmented regression approach that allowed a single change in the slope of the linear regression [21, 22]. Segmented regression was less appropriate for assessing the relationship between SPAD values and spectral indices because there was generally a closer linear relationship between the variables that could be adequately characterised with a second-order polynomial or linear regression. All regression analyses were conducted in R [23] using the package segmented [21] for segmented regression. We use the coefficient of determination (R2) and the root mean square error (RMSE) to rank the relative ability of the spectral indices tested here to characterise absolute and relative chlorophyll content from European beech leaves.
Results and discussion
The SPAD-502 meter readings show good correspondence to total chlorophyll concentration measured through acetone extraction. However, they fail to accurately characterise the chlorophyll content of brown leaves that were collected prior to the leaves being shed from the tree (figure 2). The close relationship between SPAD values and total chlorophyll content of mature European beech leaves and low root mean square error (R2: 0.96; RMSE: 4.31) demonstrates that the SPAD-502 meter is capable of detecting declines in chlorophyll content and emphasises the value of hand-held chlorophyll meters for estimating chlorophyll content in the field [1, 24, 25]. The ability to perform a rapid assessment of leaf chlorophyll content over a moderately sized area is vital to enable the assessment of tree health. The speed and precision with which chlorophyll content can be estimated using the hand-held SPAD-502 chlorophyll meter facilitates the spatial and temporal extension of forest health surveys that might otherwise be restricted by costly laboratory extraction techniques.
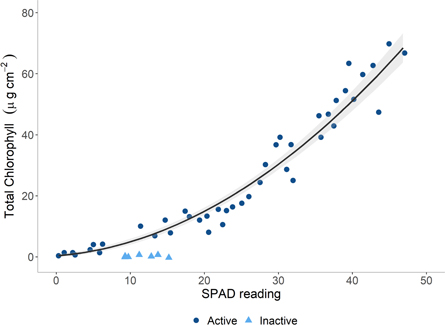
Figure 2. Curvilinear relationship between measurements from the SPAD-502 chlorophyll meter and total chlorophyll content in mature European beech leaves. The curve is fitted only including photosynthetically active leaves with the brown, photosynthetically inactive leaves excluded from the regression due to inaccurate measurement by the SPAD-502 meter.
Download figure:
Standard image High-resolution imageTo extend the assessment of forest health to large areas it is necessary to be able to identify chlorophyll content using remotely sensed data [5, 6]. Comparison of the linear correlation coefficient between total leaf chlorophyll content and spectral reflectance shows that leaf chlorophyll content in mature European beech leaves is best characterised in the visible region of the electromagnetic spectrum, while reflectance in the near infrared and shortwave infrared wavelength regions do not show a strong correlation with leaf chlorophyll content (figure 3). Within the visible region there are two peaks in correlation coefficient, one centred at 550 nm (green light) (−0.82 at 550 nm) and one at 705 nm at the start of the red-edge (−0.85 at 705 nm) that neighbour the peak absorption features of chlorophyll a and b in the red region (646 nm and 663 nm). The position of these two areas of strong correlation shifts and the overall strength of correlation declines when brown leaves are included in the analysis, with the areas of strong correlation being positioned closer to the peak absorption features of chlorophyll (strongest correlation coefficients: −0.71 at 635 nm and −0.75 at 695 nm; figure 3).
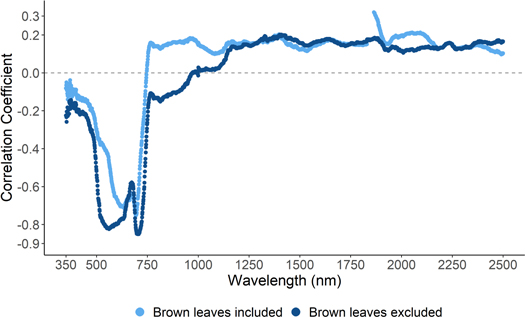
Figure 3. Correlation coefficient of the linear relationship between leaf chlorophyll content and spectral reflectance between 350 and 2500 nm.
Download figure:
Standard image High-resolution imageWhen spectral reflectance data are transformed into spectral indices, spectral indices that make use of reflectance measurements from bands in the red edge region show the strongest relationship with chlorophyll content (table 2; Le Maire et al 2004, Lu et al 2018). The mSR705 and mND705 indices show the strongest relationships with total leaf chlorophyll in mature European beech leaves (R2 = 0.95, RMSE = 4.70; R2 = 0.95, RMSE = 4.71 respectively) while the Green NDVI shows the best relationship out of the indices that do not make use of a spectral band in the red edge region (R2 = 0.94, RMSE = 5.23; table 2). All the spectral indices studied here show a curvilinear response with total chlorophyll content in mature European beech leaves. While it is common practice to use polynomial terms to characterise the curvilinear relationship between total leaf chlorophyll content and spectral indices [1, 5], we find that polynomial terms did not fully capture the sharp change in the slope of the relationship between total chlorophyll content and spectral indices occurring around a chlorophyll content of 20 μg cm−2 (figure 4). To overcome this change in slope, we use segmented regression to characterise the two linear relationships either side of a break point which improves the strength of relationship and reduces the root mean square error between chlorophyll content and spectral indices (table S1 is available online at stacks.iop.org/ERC/2/071002/mmedia). The need for segmented regression is reduced when spectral indices are related to SPAD values owing to a closer linear relationship that can be adequately characterised by a straight linear or polynomial equation in most cases (figure 5).
Table 2. Correlation coefficient and root mean square error from a segmented regression of total leaf chlorophyll content against spectral indices and second order polynomial regression of SPAD values against spectral indices.
| Chlorophyll (μg cm−2) | SPAD | |||
|---|---|---|---|---|
| Spectral index | R2 | RMSE | R2 | RMSE |
| mSR705 | 0.95 | 4.70 | 0.96 | 2.78 |
| mND705 | 0.95 | 4.71 | 0.98 | 1.89 |
| GreenNDVI | 0.94 | 5.23 | 0.94 | 3.37 |
| SR6 | 0.92 | 5.78 | 0.96 | 2.73 |
| Carter4 | 0.92 | 5.80 | 0.97 | 2.43 |
| SR1 | 0.92 | 6.01 | 0.95 | 3.07 |
| NDVI2 | 0.92 | 6.09 | 0.97 | 2.48 |
| Carter | 0.91 | 6.23 | 0.91 | 4.07 |
| SR3 | 0.90 | 6.64 | 0.91 | 3.94 |
| Datt | 0.87 | 7.52 | 0.80 | 6.07 |
| Gitelson2 | 0.86 | 7.86 | 0.93 | 3.60 |
| Carter2 | 0.86 | 7.95 | 0.92 | 3.82 |
| Carter3 | 0.79 | 9.75 | 0.89 | 4.52 |
| PRI | 0.75 | 10.73 | 0.87 | 4.94 |
| PSSR | 0.73 | 10.96 | 0.85 | 5.23 |
| GI | 0.49 | 15.03 | 0.12 | 12.61 |
| NDVI | 0.51 | 15.03 | 0.64 | 8.07 |
| NDVI3 | 0.51 | 15.10 | 0.22 | 11.74 |
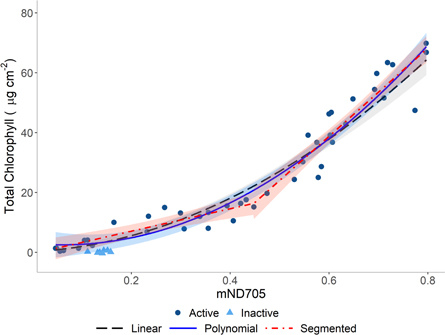
Figure 4. Curvilinear relationship between mND705 and total chlorophyll content of mature European beech (Fagus sylvatica) leaves. Three fit lines are shown with 95% confidence intervals from three different regression methods: a linear regression with a square root transformation on total chlorophyll content, a second order polynomial, and a segmented regression. Regression models were fitted using the photosynthetically active leaves only, with the inactive (brown) leaves excluded.
Download figure:
Standard image High-resolution image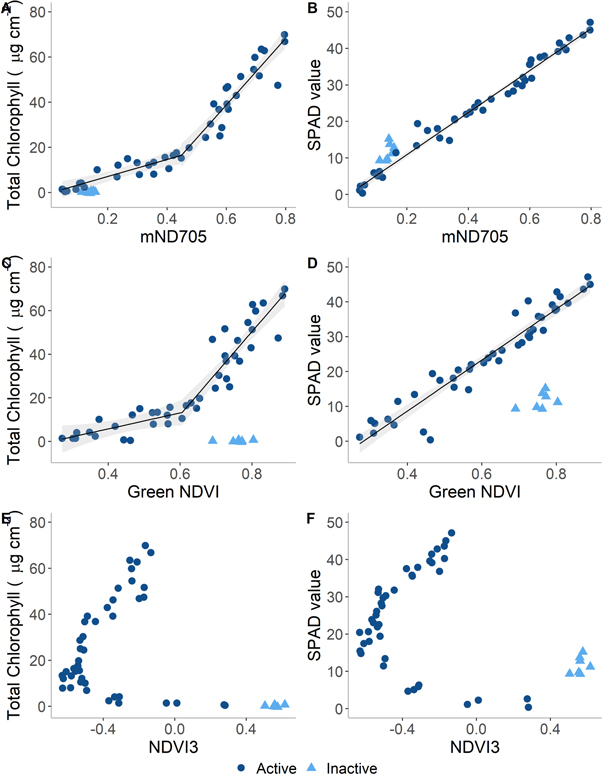
Figure 5. Relationship between mND705, Green NDVI and NDVI3 with total chlorophyll content or SPAD values of mature European beech (Fagus sylvatica) leaves. Fit lines are shown with 95% confidence intervals against mND705 (A) and (B) and Green NDVI (C) and (D). A segmented regression is shown for the relationship between spectral indices and total chlorophyll content and a linear regression shown for the relationship between spectral indices and SPAD values. No fit line is shown for NDVI3 due to the horizontal parabola that would limit the prediction of chlorophyll content from spectral data. Regression models were fitted using the photosynthetically active leaves only, with the brown, inactive leaves excluded.
Download figure:
Standard image High-resolution image
The spectral indices that best characterise declines in total chlorophyll content were unable to adequately differentiate between brown leaves and photosynthetically active leaves (figure 5). This imposes a clear limitation on the use of spectral indices to estimate plant health or the estimation of phenological stages as the chlorophyll content of any brown leaves will be over-estimated and so plants will seem healthier or at an earlier stage of senescence than is the reality. Indices based on red and green spectral regions such as NDVI3 were better able to discriminate between brown and photosynthetically active leaves despite not being suited to characterising leaf chlorophyll content (figure 5). This occurs due to an asymmetrical horizontal parabola relationship between NDVI3 and total chlorophyll content. This relationship results in a negative index value potentially corresponding to two different chlorophyll contents while a positive index value corresponds only to leaves with very low total chlorophyll content or brown leaves, enabling a clear discrimination between brown and photosynthetically active leaves (figure 5).
Well-defined relationships between chlorophyll content and spectral indices are required to facilitate the necessary development of methods to monitor health decline in temperate broadleaf forests. From an operational standpoint, our results show there is not an individual index that is well suited to detecting both decline in chlorophyll content as well as the point at which the leaves turn brown in European beech. Furthermore, the spectral indices with the strongest correlation with total leaf chlorophyll content show a curvilinear relationship [1]. In combination, these these limitations present a challenge when scaling leaf level results up to the canopy scale using remotely sensed data. When remotely sensed images are collected, multiple leaves or branches are captured within the boundary of a single pixel and the spectral response of all the material contained within the pixel is averaged. Spectral averaging may result in a misestimation of chlorophyll content because the mean spectral response of two leaves does not necessarily correspond to the mean chlorophyll content of those same two leaves due to the curvilinear response between spectral reflectance and total chlorophyll content observed in figures 4 and 5 and reported by Richardson et al [1]. This phenomenon will be further complicated because, at the canopy scale, pixels may represent a mixture of brown and photosynthetically active leaves, may have varying Leaf Area Index, stand density and contain understory vegetation which affect measured reflectance [26, 27]. In combination, spectral mixing presents a significant obstacle for detecting declines in chlorophyll content using remotely sensed images.
Minimising the impact of spectral averaging is best achieved by improving the spatial resolution of the remote sensing data sets used. High-resolution remote sensing data will improve the spectral purity of individual pixels by measuring reflectance from a smaller area and so reduce the impact of spectral mixing [28]. UAV mounted sensors allow centimetre-scale images to be acquired and the indices that best characterise chlorophyll content or discriminate between photosynthetically active and inactive leaves in European beech could be derived from off-the-shelf UAV mountable sensors. Data collected from a UAV platform would enable the separation of photosynthetically active from photosynthetically inactive material as well as retrieval of canopy structure thereby enabling improved estimates of chemical properties of the forest canopy [28–30]. The collection of centimetre-scale remote sensing data in combination with leaf level validation using a hand-held chlorophyll meter, offers an unprecedented opportunity to collect detailed data from individual trees and forest stands that would provide the best possible interpretation of forest health status and should be a priority for new research to build on the results presented here.
While UAV-mounted sensors will enable collection of high-quality data, they are limited by their flight time and are therefore best suited to detailed surveys of smaller forest stands rather than the repeated measurement of large areas required to monitor changes in phenology and peak chlorophyll content [6, 29]. Repeated measurements over large areas are best achieved with satellite-based observations and numerous multispectral satellite sensors are available with spatial resolutions ranging from 1.3 m pixel size (Worldview-3) to 500 m (MODIS). While satellite borne sensors have the potential to return multispectral data at 1.3 m pixel size, at present the mND705 or mSR705 can only be calculated at 20 m pixel size using data from the Sentinel-2 MSI instrument. The Green NDVI could, however, be calculated from a greater number of satellite sensors at spatial resolutions as high as 1.3 m. A suite of high spectral resolution sensors with 30 m pixel size have recently been launched, or are due to be launched on space-borne platforms in the near future, including the ASI PRISMA, DLR EnMAP, DLR DESIS (currently onboard the International Space Station) that further enhance the capabilities of satellite-borne sensors to monitor plant health. While high spectral resolution sensors lack the spatial resolution of some multispectral sensors, the greater number of spectral bands captured increases the number of spectral indices that can be calculated, thereby increasing the ability to identify declines in chlorophyll content. Despite the choice of available satellite-borne datasets, a key challenge in scaling from leaf to canopy-scale measurements using satellite remote sensing data is understanding the impact of decreasing spatial resolution on the ability of different spectral indices to characterise chlorophyll content decline. Validation data is needed to adequately assess the ability of satellite remote sensing data to characterise declines in chlorophyll and better understand the impact of decreasing spatial resolution when scaling leaf level studies up to the forest canopy [28, 29]. Validation data could be provided from well-designed studies using UAV mounted sensors to provide snapshots of forest canopies with varied health conditions that coincide with satellite overpasses. Such studies would provide validation data that is needed to develop methods that use spectral satellite remote sensing data to quantify chlorophyll content in forests globally.
Conclusions
Forest vulnerability assessments require methods for monitoring change in chlorophyll content that can be used to inform when forest stands experience a suppression in growth or are at increased risk to outbreaks of pests and pathogens. Monitoring changes in chlorophyll content helps to provide early indictors of declining plant vigour, yet operational, remote-sensing based systems for monitoring plant health are lacking. Here we identify spectral indices that are sensitive to chlorophyll content in mature European beech trees, Europe's most significant commercial broadleaf tree crop and a major component of European temperate broadleaved forests. We define relationships that will facilitate the estimation of chlorophyll content from remotely sensed data and demonstrate that the data from hand-held chlorophyll meters can be calibrated to provide leaf chlorophyll content using a non-destructive method in mature European beech trees, thereby providing essential validation of remote sensing-based estimates of canopy chlorophyll content. The results presented here provide the foundation for a remote sensing-based assessment of broadleaf tree health that would complement and expand the scope of traditional canopy condition assessments, ultimately leading to the development of an early warning system for detecting declines in forest health.
Acknowledgments
This work was funded by the Natural Environment Research Council [grant number: NE/S010041/1].