

Abstract
Unplanned urbanization, demographic and environmental changes have forced many cities into more uncertainty and risk, challenging economic, social, and environmental sustainability. In this context nurturing resilience in the face of various uncertainties of environmental, socioeconomic and other sociopolitical risk is an urgent matter. Resilience has become an important goal for many cities throughout the world leading to the enhancement of urban ecology and maintenance of essential ecosystem goods and services to make sure the sustainable future for all. The Kathmandu metropolitan city is one of the fastest-growing capital cities with recent and frequent evidence of unplanned development, loss of green space, tragic events of an earthquake, flood and other environmental problems causing devastation, economic damages, and loss of human life/health, and habitats. In this background, the paper evaluates suitable sites for urban green space development using the analytical hierarchy process (AHP) based multi-criteria analysis methods with geographical information system (GIS).Variables taken for this study are school point data, health facility's location data, emergency service's locations, water bodies, emergency road network data, recent land use/land cover data, population data, existing park, and slope. The unit of a study is a metropolitan city. Our evaluations demonstrate the spatial distribution of different not suitable areas, less suitable, moderate suitable, and highly suitable area respectively, of the 4.47%, 7.19% of the area are high and moderate suitable area, while the largest area 78.87% is less suitable and 9.47% are not suitable for the development of green open space. The result indicates human occupancy is everywhere and per capita, open green space in the city is very below the global average. The local government must think about different modality for development of green open space in collaboration with other government agency occupying more open space or engagement with private sectors. This finding could contribute a planner for spatial planning of green space development in a Metropolitan City.
Export citation and abstract BibTeX RIS

Original content from this work may be used under the terms of the Creative Commons Attribution 3.0 licence. Any further distribution of this work must maintain attribution to the author(s) and the title of the work, journal citation and DOI.
Introduction
Population and economic growth are results of the expansion of cities throughout the world (Childers et al 2015). More recent decades cities around the world including in developing countries have been facing rapid urbanization and expansion of cities (UNDESA 2015). Because of this rapid unplanned urbanization in the developing world the municipal administrators and planner are facing numerous problems and gradually leading to declining of the basic services like green space, sanitation, water supply, mobility, and primary health services centers, schools, public services providing offices, etc which or nearby them at least need some more green space for to maintain appropriate carrying capacity. The urban green places exposure is not enough to meet the increasing population pressure per unit area along with growing human pressure expansion of building construction site; industrialization in the process of urbanization (Cetin 2015). With the increasing populations require for municipal areas, some ecological and environmental roles move towards improving the eminence of life (Jim and Chen 2003). However because of the unplanned urban expansion, no balance is seen between natural land patterns and municipal set of connections in the process of urbanization in a phrase of urban green spaces and open spaces; urban expansion has been dominating natural networks that provide multifunction for both human and ecology (Abebe and Megento 2017). Similarly cities have been also facing multiple risks from various stresses due to unplanned urbanization which forced the urban system in to complex and unpredictable adverse impacts on human and natural system throughout the urban area especially in developing world.
In this background city specially in underdeveloped world need to develop a resilience plan as they have been suffering from rapid unmanaged urbanization, inappropriate development plan, lacking awareness of hazard risk, not enough access to basic infrastructure services, urban poverty, have been further contributing to exposure and vulnerabilities of human being , assets , and basic urban services (Inderberg et al 2014). Likewise the formal and informal expansions of settlements in marginal to high risk area/land have further prone to natural hazard such as flood; landslide and the impact of climate change have further making the situation more vulnerable and creating problems to municipal authority to provide services (United Nations 2014). An effective urban resilience plan is more urgent.
As urban resilience is the abilities of any cities/urban area that can withstand and recover from astonishing shocks associated with hazard and environmental changes (Pickett et al 2004). Literally the building resilience to those risks can be done with an effectual through maintaining and implementing of spatial urban planning that consider and respond the different risks as a part of proactive urban development and management strategies and urban infrastructure development plan. The possible approach's such as risk-resilient spatial planning, improve infrastructure design standard, preserve natural ecosystem functions and green spaces, implementing effective early warning system, participatory bottom-up urban development strategies, improved urban institutional coordination arrangements etc, for building urban resilience (Pickett et al 2004). While the expecting physical and socioeconomic developments in terms of a suitable area for different facilities like health, education, recreation, where bioclimatic comfort arises are the main indicators of planned urbanization (Cetin 2015). Many study shows access to urban green space can have an immense encouraging influence on health by promoting physical activity, improving the public health of urban residents, and enhance psychological well-being at the same time in the same way to these significant apparatus. (Mitchell and Popham 2007) argue that people who live near green spaces are healthier than people who live farther from green spaces.
Urban green spaces are also an important part of urban ecosystem and function as a key role in conserving urban biodiversity through habitat corridor, pollution control, flood mitigation and soil conservation in riverbank along the urban areas, and provide spaces during or after disaster like earthquake. Furthermore, green spaces conserve the co2 (Nowak 1993, McHale et al 2007). Supply and produce o2 (Jo 2002); reduce air and noise pollution (Yang et al 2005); regulate microclimates; reduce the heats island effects in cities (Shin and Lee 2005) which altogether help to build urban resilience and safer cities. In Kathmandu valley the generally agricultural landscape steadily converted into urban landscape with increasing the anthropogenic occupied settlements in the 1960s and 1970s and the process reached to high during 1980s to 1990s. Following 1990s political Kathmandu becomes the center of political and business activities leading high demand for housing which eventually increased built-up area in the valley (Thapa et al 2008). More recently the landscape fragmentation and varied land use development are common in a different part of the valley (Thapa and Murayama 2009).
As a result of the expansion of urban sprawl and the decreasing of urban green spaces cause tremendous pressure on urban daily life and ecological environment throughout the Kathmandu valley. The movements of people from the plain, hills, mountain periphery to the valley floor are the most widespread phenomenon in the valley (Bhattarai and Conway 2010). In the past decade, the government has been developing various urban land use development planning and policy initiatives for the valley (Thapa et al 2008). However, the rapid unrestrained urbanization is also responsible for the conversion or occupying of agricultural areas, river banks, open spaces, and cultural heritage areas. More recent the demands of public open spaces is increasing rapidly due to loss of open land and provide the shelter places during the disaster like in 2015 devastating earthquake. As per the CBS 2011 census record the population of the Kathmandu valley alone crosses the millions (CBS 2011) and subject to increase by double fold by 2030 (UNDESA 2015). The rapid expansion of the built up area in recent decades and population changes have caused in the significant transformation of land use the land cover of the valley with 3.94% urban growth rate between 2010 to 2014 (UNDESA 2015). Old residents living in Kathmandu have been experiencing dramatic changes in settlements, land use, cemented constructions and exponential population growth figure 1 show how the urban expansion happened in last few decades in Kathmandu Valley.

Figure 1. Land use land cover change in Kathmandu Valley from 1989 to 2016 (Source Ishtiaque et al 2017).
Download figure:
Standard image High-resolution imageAs per the census report total population of Kathmandu in 1981 was just 422237, after 30 years the population of Kathmandu reached to 1744240. Likewise the number of households reached to 436344 within the area of 49.45 square kilometer leading to an unplanned rapid urbanized city with very low open green space (CBS 2011). Similarly air pollution is another significant public issue in Kathmandu metropolitan city where air quality has worsened in the past few years. Nepal was ranked 177th out of 180 countries in 2016 Environmental Performance Index (EPI) and Kathmandu is ranked one of the most polluted cities in Asia (Hsu et al 2016, Parajuly 2016). Various causes are responsible for air pollution in Kathmandu city, among them rapid urbanization is one. Data from 2014 shows 4.6 million of Nepalese live in urban areas, among them Kathmandu city is in top. With increasing urban population the number of vehicles is also increasing proportionally and causing more air pollution. According to data, in Kathmandu Valley a number of vehicles registered in 2000/1 was 24003 and by 2015/16 the number reached to 779822 by an increment of 32 times more in one and half decades (DoTM 2017).
Though a planning document named 'Long Term Development Concept for Kathmandu Valley' was released in 2002 with planning references conceptualizes scenario to develop Kathmandu metropolitan region with focusing long term plan for mantling and compacting urban form with conservation of agriculture land synchronized infrastructures development and land use land cover plan with defined precise ecological sensitive areas by 2020 (KVUDC 2002). Similarly, many documents and plan have been developed for making Kathmandu as a smart metropolitan city such as risk sensitive land use planning with various zones like residential promotion area, agriculture area promotion zone, medium alert zone, high alert zone, identification of economic opportunities and growth area, identification promotion and restriction area of construction for sustainable urban plan and promotion of at least one tree on home, and more recently plantation along road side and open space is also increasing.
However many of those plan are in written form only. Till date no studies have been conducted for evaluating the urban green space with focusing to multiple environmental and social benefits as last decade most focus have been directed toward economic activities and political changes. As GIS-based suitability analysis has been extensively used for site selection, impact studies and land use planning (Edward et al 2010). In order to answer the question, like best spatial location for urban growth by making use of different types of criteria and weights and have becomes important tool for planning, analyzing and monitoring changes in urban development , their impacts on ecosystem, and achievement of sustainable urban development (Wang et al 2014). The purpose of the current study is to evaluate the urban green space suitability for better spatial urban green space development and management for multiple environmental and social benefits for sustainable urban planning of Kathmandu Metropolitan City, Nepal.
Method and material
Study area
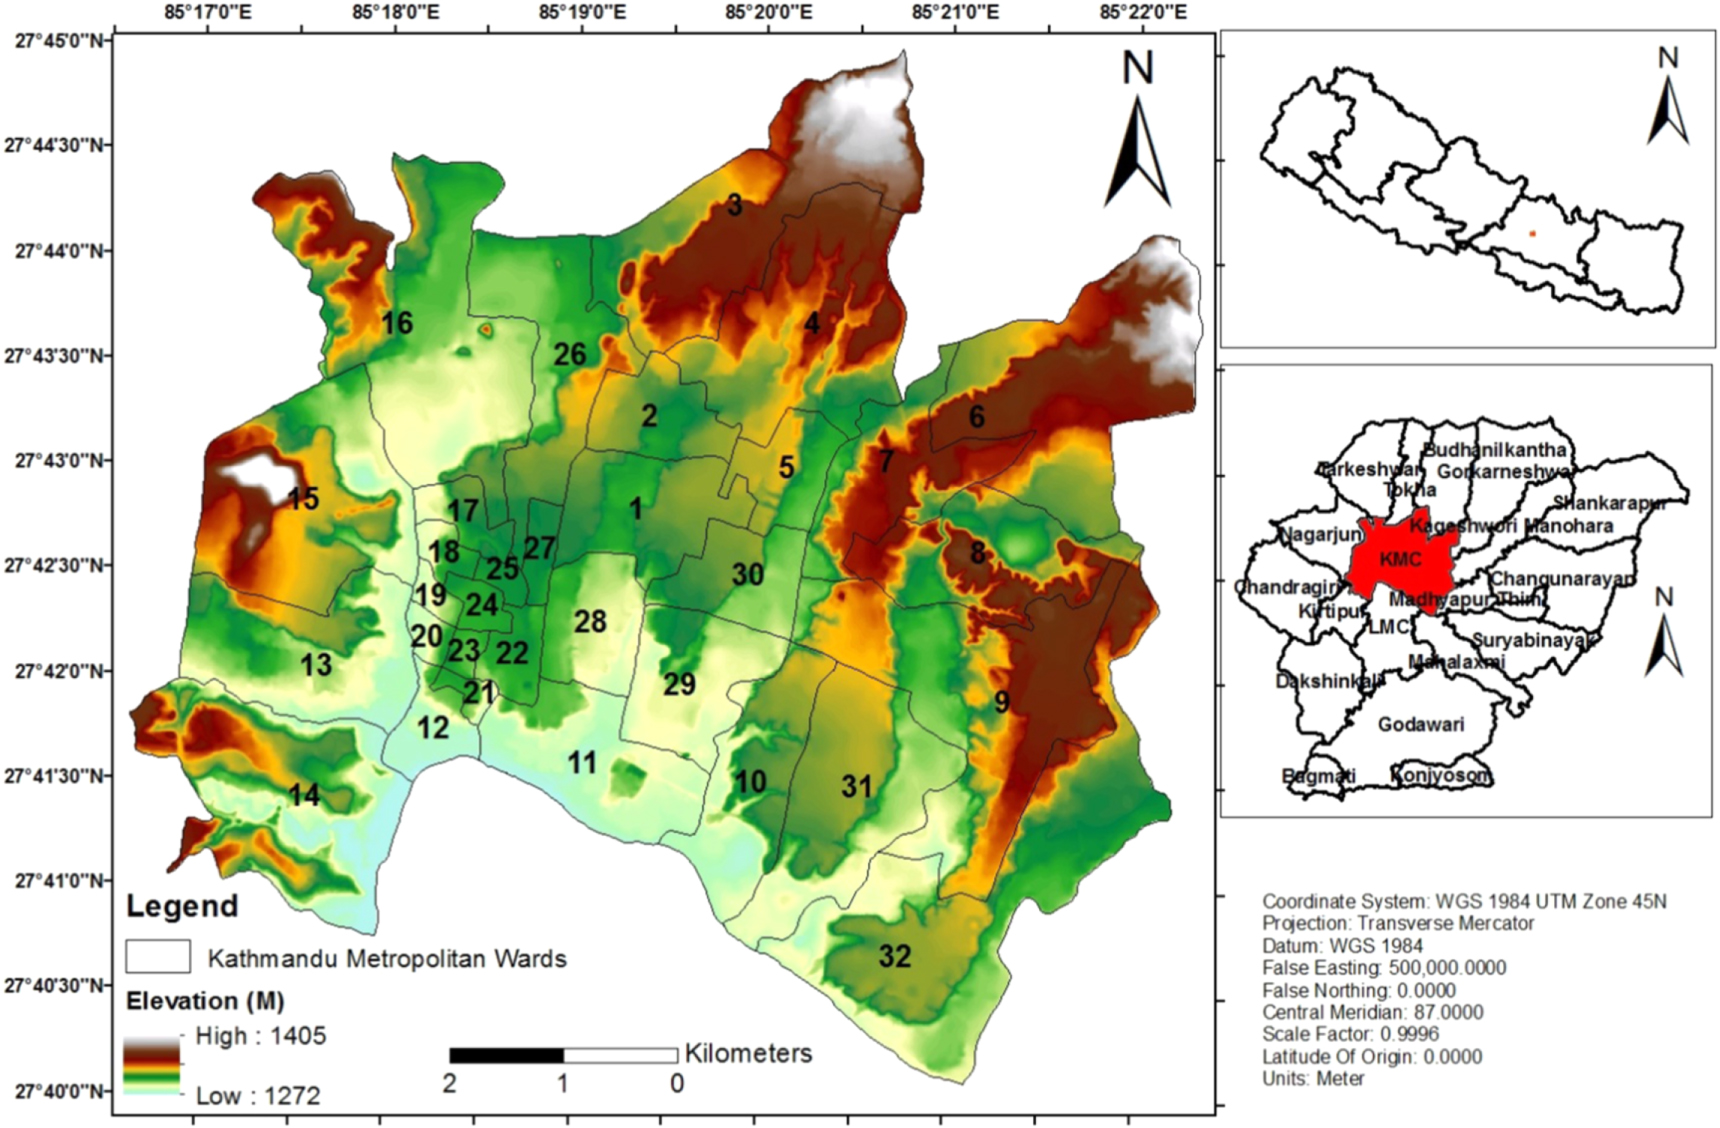
Kathmandu is an eldest metropolitan city of Nepal lies between the latitudes 27° 32' 13'' and 27° 49' 10'' north and longitudes 85° 11' 31'' and 85° 31' 38'' East and is located at a mean elevation of about 1,300 meters (4,265 feet) above sea level. The city is the urban core of the Kathmandu Valley in the Himalayas with an area of 49.5 km2, and 32 wards; where about 60% of the Kathmandu district's population resides with 20288.8 km−2 (CBS 2011).
Metropolitan city predominantly lies in sub-tropical cool temperature with summer maximum 35.6 °C and winter minimum temperature –3 °C and 75% annual humidity. The average temperature of the city is about 19 °C to 27 °C in summer and 2 °C to 20 °C in winter. The average rainfall is about 1400 millimeters of which mostly occurred from June to August (DHM 2017). Being a national capital, the migration of peoples is one of the important driving factors for increasing economic activities, fossil fuel loaded traffics, waste in different wards of metropolitan areas and which act as a major driving force for environmental pollution/degradation. Air pollution, Water scarcity, improper drainage and sewerage system, losses of green as well as open space, growth of informal settlements like slum dwellers along river bank, squatter settlements are common in Kathmandu metropolitan city. Figure 2 show study area with Metropolitan wards and eleviation.

Figure 2. Methodology adapted for study.
Download figure:
Standard image High-resolution imageData sources and methodology
Nature have provided wide range of resources, however some of the natural resources existence is limited by the environmental potential for anthropogenic use, in this background assessing land suitability and identifying the aptness of ecologic should be seen as an essential requirement in spatial planning (Zeinivand et al 2014). When talking about social, economic, and environmental benefits of any land for human use such as agriculture, forestry, pasture, recreation, open spaces, nature protection, tourism activities, environmental protection, urban development or any development activities assessment of the land and environmental suitability is most important. According to (FAO 2006) those land having a no significant limitations to sustained application of a given use or only limitation that will not significantly reduce a benefit and will not raise inputs above an acceptable level are considered as high suitable land.
While any land that have restrictions which emerge as severe as to prevent any possibilities of successful sustained use of the land in the given manner are considered as not suitable land. Identifying the best criteria is the keys for land suitability analysis (Dong et al 2008, Chakma 2014). Significant criteria have been commonly used for developing the framework of APH method to identify the best location. On the other hand, selecting criteria may depend on other factors that can influence the selection process i.e. the availability of data extent of the study area, etc. Some most significant criteria used for suitability evaluation are accessibility criteria, Physical criteria, Environmental Criteria, and Socio-economic criteria (Javadian et al 2011, Chakma 2014).
Then those criteria haven classified into different sub-criteria for suitability evaluation. Some earlier studies and literature conducted by some researchers had used those criteria and sub-criteria (Manlun 2003, Pantalone 2010, Ahmed et al 2011, Heshmat et al 2013, Kuldeep 2013, Elahe et al 2014, Yousef and Mohammad 2014). For this study we used sub criteria such as land use/land cover, population density, slope, proximity to emergency road, and distance to existing park and historical and cultural site, distances to facility services, distance to Waterbody for the green space development in Kathmandu metropolitan city.
Topographic variables were derived from 10 m digital elevation model with a geometric resolution of 10 m. These spatial data sets were collected from a number of organizations and further processed using ArcGIS software for multi-criteria analysis in order to make the compression possible standardization was done by converting them into the same format and extent. Data sets were reclassified based on Food and agriculture organization standard land suitability classification i.e. (S1) highly suitable to unsuitable (N1) likewise (S2) moderately suitable, (S3) less suitable, and (N1) not suitable. Further AHP method was applied for weight and ranking based on the importance of green space. This was done by constructing a pairwise matrix by comparing each criterion with the other criteria based on its relative to its importance, on a scale from 1 to 9.
Analytical hierarchy process (AHP)
The Analytic Hierarchy Process (AHP) was introduced by Thomas saaty (1980). This has been using as an effective tool for dealing with the complex decision-making process and aids the decision makers to set priorities to make better decision through reducing the complex decision to series of pairwise compression, and then producing the result. AHP method has used multi-criteria evolution (MCE) as a substitute to the MCDA approach in land suitability analysis to locate the spatial optimal sites for expansion (Ying et al 2007, Uy and Nobukazu 2008). Though AHP is a conventional land suitability analysis technique and that provides the right decision-making use extensively for site selection. In the same way, AHP has integrated with GIS for land suitability modeling (Malczewski 1999). AHP helps to capture a mutually subjective and objective aspect of the decision and also for checking the consistency of the decision maker's evaluations, consequently sinking the bias in the decision-making method (Saaty 1980, Malczewski 2006,). Further this method is also an ordered approach that can be used for compound cases and can normally be identified by using driven knowledge and driven data. At same time the weights of factors can also be calculated by using export opinion that have significant knowledge in the field of urban growth, environment and importance of open spaces and can be determined by using pairwise compression method to evaluate their relative importance vies-versa on another (Javadian et al 2011, Kumar and Shaikh 2013). Scale for the pairwise comparisons, based on judgment are expressed by a degree of preference as describe by equally preferred = 1, moderately preferred = 3, strongly preferred = 5 very strongly preferred = 7 and extremely preferred = 9.
At the same time the number 2, 4, 6, and 8 are generally used to distinguish similar options while reciprocal for inverse comparison (Saaty 1980).
The consistency index (CI) is calculated by shown below in equation (1)

Where γ MAX is the principal eigenvalue; n is the number of factors.
γ MAX = Σ of the products between each element of the priority vector and column totals. The consistency index of a randomly generated reciprocal matrix is called the Random Index (RI). Similarly another ratio that has to be calculated is the CR (Consistency Ratio). The Formula used for calculating CR is expressed in equation (2)

After this process, an aggregation of the criteria was done by using the weight linear combination method (WLC) methods using the raster calculator available in ArcGIS. In weight linear combination method criteria factors or variables (Vi) multiplied by the weight of the evaluation parameters (Wi) to obtain the composite weights and then summed. Weight linear combination method is considered as a straight forward process for calculating composite weights (Mendoza 1997).

Where, Si = Suitability, Wi = relative importance's or weight, Vi = Factors or variables, n = total number of factors/parameters.
Taken as an advantage of this process weight linear combination method was used to generate a evaluation of green space. The types of criteria and sub-criteria including methodology are shown detail on figure 3. Similarly list of data sets and their sources are listed in below table 1.

Figure 3. The study area: location and elevation.
Download figure:
Standard image High-resolution imageTable 1. List of data layer for the green space suitability and their original sources.
| Data Name | Type | Date | Sources |
|---|---|---|---|
| Municipal Boundary ,ward | Area | 2017 | Department of Survey Government of Nepal |
| Digital Elevation Model | Raster | 2013 | UNDP/CDRMP |
| School inventory | Point | 2015 | Department of Education Government of Nepal |
| Land Use/land Cover | Vector | 2012 | UNDP/CDRMP |
| Population | Polygon | 2016 | Central Bureau of Statistics |
| Park | Point | 2013 | UNDP/CDRMP |
| Waterbody | Area | 2012 | UNDP/CDRMP |
| Emergency Transportation road | Line | 2013 | Department of Road Government of Nepal |
| Emergency Services Location | Point | 2015 | DUDBC |
| Health Facility Location | Point | 2015 | Department of Health Government of Nepal |
Criteria description
Accessibility criteria
Accessibility to green space is one of the important factors that determine the usefulness and the likelihood of monitoring and maintenance their safekeeping for the public, which will be essential in addition to the passersby's aesthetic and ecosystem services similarly easy access to green space during an emergency or crowed put additional benefit and utilization of green spaces. So for this study distance from the main and emergency road was considered as important accessibility criteria. An earlier study carried out by (Yang et al 2008, Kumar and Shaikh 2013), considered accessibility as an important factor for suitability evaluation/analysis'.
Physical criteria
As per the FAO (2006) classification slope has been divided into various classes the slope value 0 to 0.2% is considered as flat slope and 2 to 5% as a gentle slope. Where 5, 10 to 30% is considered as sloping and strongly sloping. Similarly, slope greater than 30% is considered as moderately to seep slope respectively. The most appropriate slope for building a green space is appropriate is 2 to 15%.
However, in general, the limiting factors are not problematic as the slope can be properly used for soil conservation, design or improve beautification. However, a gradient from 0 to 2 is not much suitable due to drainage problem (FAO). Similarly, the aspect, direction of the slope also determines the quality of sunlight which has some influences in the growth and development of vegetation or greenery.
Socio-economic criteria
Various socio-economic factors are directly or indirectly associated with the green space suitability evaluation. Factors like facility location, land use, population density, house density, and zoning area have used for this study. For example distances from facility location to green space is important to ensure their closeness and high compatibility with each other for maintaining the healthy environment for hospital visitors, students, employees and consumers for revitalization at these services center.
Similarly, places near the high population density with a greater number of a citizen with crowded places required access to the open green spaces (Schipperijn et al 2010). This is similar to other factors.
Environmental criteria
Environmental criteria are the most significant and important criteria for the evaluation of open green spaces in any locality. Factor like availability open space, river network, Waterbody, existing park and vegetation plays an important role. As (Kuldeep 2013) state that land closer to river stream banks get more preferences and help to maintain the environmental health of the green open area. Similarly, green location near to water resources like reservoirs, ponds, lakes, rivers is the best suitable location for green space planning (Heshmat et al 2013). In case of the existing park, it is recommended develop a park or green spaces with a certain degree of distances to make equal spatial distribution and this will help to secure development of green spaces or vegetations to a new area (Pantalone 2010).
Pairwise comparison matrix
In AHP method a priority vector is also called normalized principal eigenvector and is generally applied using pairwise compression through a mathematical calculation that simplifies the rank of preference among the proposed criteria, in which normalized values is divided by cell values by the priority vectors/weight to determine the value of the mean row (Saaty 1980). The computation matrix of the pairwise comparison along with values in this study is shown in table 2.
Table 2. Pairwise comparison matrix.
| ERN | Slope | Park | Wb | FL | LU | PD | HC | Weight | |
|---|---|---|---|---|---|---|---|---|---|
| Emergency Road Network | 1.00 | 2.00 | 5.00 | 3.00 | 9.00 | 5.00 | 8.00 | 6.00 | 0.30 |
| Slope | 0.50 | 1.00 | 4.00 | 0.50 | 3.00 | 5.00 | 0.50 | 4.00 | 0.15 |
| Existing Park | 0.25 | 0.25 | 1.00 | 6.00 | 5.00 | 4.00 | 5.00 | 6.00 | 0.18 |
| Waterbody | 0.33 | 2.00 | 0.17 | 1.00 | 4.00 | 5.00 | 4.00 | 4.00 | 0.14 |
| Facility Location | 0.11 | 0.33 | 0.20 | 0.25 | 1.00 | 4.00 | 6.00 | 7.00 | 0.09 |
| Land Use Land Cover | 0.20 | 0.20 | 0.25 | 0.20 | 0.25 | 1.00 | 4.00 | 6.00 | 0.06 |
| Population Density | 0.13 | 2.00 | 0.20 | 0.25 | 0.17 | 0.25 | 1.00 | 4.00 | 0.06 |
| Historical &Cultural places | 0.17 | 0.25 | 0.17 | 0.25 | 0.14 | 0.17 | 0.25 | 1.00 | 0.02 |
| Total | 2.69 | 8.03 | 10.98 | 11.45 | 22.56 | 24.42 | 28.75 | 38.00 | 1.00 |
Result and discussion
Green space suitability evaluation for Kathmandu Metropolitan city
As Kathmandu metropolitan city have been facing unprecedented challenges of rapid unplanned urbanization leading to severe problems such as sanitation, air pollution, squatter settlements, loss of public open spaces and so forth, the situation get more worsen when city get some disaster like earthquake and due its geographic location such events are common. So considering this reality the present study try to identify the potential area where public open green spaces could be develop, taking into account the open green spaces could provide the nature based solution to develop urban resilience. Table 3 indicte at what unit, level and weight criterion for green space suitability evaluation is done.
Table 3. Suitability level per criterion for green space evaluation.
| Criteria | Measurement Unit | Suitability Level | Weights (%) | ||||
|---|---|---|---|---|---|---|---|
| 5 | 4 | 3 | 2 | 1 | |||
| S1 | S2 | S3 | N1 | N2 | |||
| LULC | Classes | RO | For | Agr | Built-up | WB | |
| Distance to road | M | 100 | 200 | 300 | 400 | 500 | 30 |
| Distance to water body | M | 100 | 200 | 300 | 400 | 500 | 14 |
| Distance from park | M | 2000 | 1500 | 1000 | 500 | >500 | 18 |
| Population density | Pop/ha | <500 | 300–400 | 200–300 | 100–200 | >100 | 6 |
| Distance to cultural and His. | M | 100 | 200 | 300 | 400 | 500 | 2 |
| Slope | % | <5 | 5–10 | 10–20 | 20–30 | >30 | 15 |
| Distance to services location | M | 500 | 1000 | 1500 | 2000 | 15 |
RO = Road, For = Forest, Agr = Agriculture, WB = Waterbody, His = Historical, M = Meter, ha = Hectare.
Looking from the prospective of spatial planning various criteria and sub-criteria that have equal and crosscutting to all physical, socio-economic and environmental were chosen. However while choosing the sub-criteria the priority should given to socio-economic and environmental as they are key drivers and changes in one system can easily influence another's. For identification of suitable land and location for green space development, it is important to evaluate the spatial suitability with focusing spatial urban planning development. The different factors affecting the evaluation of green open space development are discussed below. The collective effects of these factors establish the degree of evaluation and also emphasize the limitation of green space development. Various spatial data serves as a source of generating different maps required for this purpose and are described. The calculated CR of the factors are less than 0.10, the rating values for these causative factors are consistent and indicating the effectiveness of factors under evaluation. The criteria and sub-criteria their coverage area and their percentages with level of suitability are shown in below table 4.
Table 4. Reclassified Land Use Land Cover and suitability area of study area.
| Main Criteria | Sub-Criteria | Values | Area in (Ha) | Area cover in (%) | Level of suitability |
|---|---|---|---|---|---|
| Accessibility | Emergency | <100 | 2288 | 37.18 | S1 |
| Road | 200 | 1608 | 26.13 | S2 | |
| Network | 300 | 1780 | 28.93 | S3 | |
| >400 | 478 | 7.77 | N1 | ||
| <5 | 3165.36 | 64.03 | S1 | ||
| 5–10 | 970.40 | 19.63 | S2 | ||
| Physical Criteria | Slope | 10–20 | 733.92 | 14.84 | S3 |
| >20 | 74.04 | 1.50 | N1 | ||
| <100 | 64.03 | 34.80 | S1 | ||
| Facilities | 200 | 19.63 | 32.65 | S2 | |
| Location | 300 | 14.84 | 24.91 | S3 | |
| >400 | 1.50 | 7.65 | N1 | ||
| Forest | 136.00 | 2.74 | S2 | ||
| Land Use land Cover | Agriculture | 441.00 | 8.89 | S3 | |
| Waterbody | 35.00 | 0.70 | N1 | ||
| Socio-economic | Built-upOpen space | 424996 | 85.711.93 | N1S1 | |
| >500 | 122.3 | 2.47 | S1 | ||
| Population | 300–400 | 430.74 | 8.71 | S2 | |
| Density | 200–300 | 3696.4 | 74.77 | S3 | |
| <200 | 694.2 | 14.04 | N1 | ||
| Historical and cultural sites | 500 | 589 | 17.01 | S1 | |
| 1000 | 244 | 27.62 | S2 | ||
| 1500 | 276 | 27.99 | S3 | ||
| 2000 | 305 | 27.38 | N1 | ||
| 500 | 122.3 | 8.71 | N1 | ||
| Existing | 1000 | 430.74 | 74.77 | S3 | |
| Park | 1500 | 3696.4 | 14.05 | S2 | |
| Environmental Criteria | 2000 | 694.2 | 2.47 | S1 | |
| Water | 500 | 589 | 17.01 | S1 | |
| Bodies | 1000 | 244 | 27.62 | S2 | |
| 1500 | 276 | 27.99 | S3 | ||
| 2000 | 305 | 27.38 | N1 |
S1 = highly suitable, S2 = moderately suitable, S3 = less suitable, and N1 = not suitable.
Suitability for land use and land cover
Even before 1960s Kathmandu valley was predominantly an agriculture landscape and changing into human settlements after 1960s, 1970s and so on and more rapid expansion in after 1990s (Bhattarai and Conway 2010). Earlier studies (Manlun 2003, Ahmed et al 2011, Heshmat et al 2013) suggest that land which is bare and grassland are the best places for the development of green places in an urban area. Similarly, existing forest area, other types of land use and land cover that have sufficient open spaces could be other options where green space can be developed in the future. In study area major land use and land cover types are built-up (85.71%), agriculture (8.89%), recreation open space (1.93%), forest area (2.74), water body (0.70%). Below figure 4 shows the land use land cover of classes and their level of suitability for green open space.

Figure 4. Reclassified LULC of study area.
Download figure:
Standard image High-resolution imageSuitability distance from emergency road
Accessibility depends upon the time and distance the green space should close to emergency road/road is more suitable. So whenever those areas are nearby emergency road could add values for recreation as well as during the emergency time. Similarly Ahmed et al 2011 and Elahe et al 2014) suggested that transportation play a significant factor for developing green open space as the distance from road determine that.
In this study places near to 100 m were reclassified as suitable area and greater than 400 m were unsuitable. While the distance from 100–200 and 300 were considered as moderately suitable. The result indicated that 37.18% of the total is highly suitable with class value 4. Likewise 26.13%, 28.93 areas are moderately suitable & less suitable. Similarly, 7.77% of the land is unsuitable for green spaces as shown in figure 5 show.

Figure 5. Reclassified Emergency transportation network study area.
Download figure:
Standard image High-resolution imageSuitability distances from the waterbody
Water plays a significant role in the growth and development of a living organism. Some earlier studies carried out by various researcher like (Manlun 2003, Heshmat et al 2013 and Kuldeep 2013) stated that land closer to Waterbody like rivers, lakes, ponds, reservoirs are suitable for the development of green space. As they maintain good environmental health and are highly suitable from the ecosystem perspective too. Agreeing with this statement distance of fewer than 100 m occupying 18.93% area is highly suitable places. Similarly, 20.97% is moderately suitable. While around 41 .21% of the area is considered a less suitable area and 18.78 not suitable. Below figure 6 shows resultant output map.

Figure 6. Reclassified Water Body study area.
Download figure:
Standard image High-resolution imageSuitability distances from the facility locations
The facilities location covers the schools, college, hospitals, and major health facilities, police stations; fire brigade locations that are crucial and important to get all services and meantime need some open spaces nearby such locations. While developing green space closer to these locations could maintain the ecological benefits and provide environmental services to all service takers as well as provides shelters at any emergency. Based on those views the lands which are closer to those facilities are more suitable than farther land. Distances from facilities located less than 100 meters, and between 200 to 300 meter are highly and moderately suitable similarly distance away from 400 and greater are not suitable. Of the total area, 34.80% is highly suitable area, 32.65%, and 24.91% moderately suitable and less suitable area while 17.2% is not suitable area. Figure 7 map show the resultant output of suitability distances from facilities location.

Figure 7. Reclassified Services location map of study area.
Download figure:
Standard image High-resolution imageDistances from the park
In KMC there are around 22 parks distributed in different wards among them Bhrikuti Mandap is the biggest followed by Ratna park, Tara gaoun park, sankha park, and others. For the development of a new park or open green spaces the area which is farthest from the existing park highly requires the green space (Pantlone 2010). Therefore in this study area from far distances from the existing park is considered a highly suitable area and vice versa. Out of 2.47% are considered as highly suitable area flowed by 14.05 %, moderate 74. 77 less suitable and 8.71 % are not suitable area below figure 8 map shows the resultant output.

Figure 8. Reclassified park location map of study area.
Download figure:
Standard image High-resolution imagePopulation density
For the evaluation of green space, population density is one of the important criteria. When there is more population density in a particular residential region it is recommended to develop more green space close to those areas. Previous studies carried out by (Pantalone 2010, Ahmed et al 2011, Heshmat et al 2013, Elahe et al 2014) also recommend for developing green space near high-density residential area could provide various benefits. In Kathmandu metropolitan city especially southwestern, central and northwestern parts are highly populated hence required green spaces. In cross ponds to population density, 122.30 ha areas cover a highly suitable area. While 430.74 ha and 3696.4 ha are not suitable area likewise 694.2 ha are less suitable area. Below figure 9 map show the resultant output.

Figure 9. Reclassified population distribution map of study area
Download figure:
Standard image High-resolution imageSlope suitability for green space
The slope is another important factor that has an influence on the evaluation of green space. Earlier studies on similar topics (Heshmat et al 2013 and Yousef and Mohammad 2014) show that areas with low slopes are highly suitable for developing green space, especially park. In this face, the food and agriculture the slope 0 to 0.2% is considered flat land and up to 5 gentle slopes and these slopes are considered as suitable for the urban green space development in this study.
The dominant percentage i.e. 64.03% of the study area lies on the slope class less than 5% while at least 1.5% of the study area lays heavy sloppy area that is greater than 30%. The detail resultant output of the analysis is shown in below figure 10.

Figure 10. Reclassified Slope map of study area.
Download figure:
Standard image High-resolution imageSuitability distances from the historical and cultural sites
Historical and cultural places are the important assets of the Nation and provide wide ranges of knowledge and recreation and as well as associated with faith and believe. In this background it is worth full to develop green space closer to those areas could help to preserve and maintain ecological values of such places (Manlun 2003). So the land area which is nearer to such places are more suitable than farther places, hence places 500 m, 1000 m are high and moderate suitable and places far than 2000 m are considered as not suitable area. Around 17.01% and 27.62% of the land area close to cultural and historical area are a high and moderate suitable location for green space development, 27.38% of the area is not permanently suitable for the green space development. Resultant outputs are shown in below figure 11.

Figure 11. Reclassified distance from historical and cultural map of study area.
Download figure:
Standard image High-resolution imageGreen space suitability of Kathmandu metropolitan city
Based on the evaluation, out of the total area 4.47%, 7.19% of areas are a high and moderate suitable area for developing green space. Majority of the area is less suitable with 78.87% area in existing condition and rest 9.47% of the area is not suitable for the development of green space. As the strategic plan of Kathmandu valley development authority, they are planning to manage open space about 5 to 7% within the year by 2035 with current 2.01% open space (KVDA 2015). Comparatively, Kathmandu metropolitan city required more per capita open space than other municipality within Kathmandu valley, because of high population density and exiting unplanned urbanization. Among the various variables taken for study within facilities location of schools which include private and government seems to be more per unit area by number in Kathmandu metropolitan city in this scenario, from resilience prospective spatially planned green open space need to be developed in a such a way that nearby schools could commonly access and utilize those open spaces for recreation, excursion, and during the emergency time. As per unit area occupied by many schools in Kathmandu valley are less and may not be sufficient during any emergency that is similar with other services/facilities locations too. The detail with the level of suitability and area and percent are shown in below table 5 and figure 12.
Table 5. Suitability areas for green space and their coverage percentage.
| Level of suitability | Area (Ha) | Percent of total area |
|---|---|---|
| High suitable | 221.31 | 4.47 |
| Moderate suitable | 355.69 | 7.19 |
| Less suitable | 3901.76 | 78.87 |
| Not suitable | 468.24 | 9.47 |

Figure 12. Green space suitability map of study area.
Download figure:
Standard image High-resolution image
Conclusion
The open green spaces in the urban area have been declining faster and faster so that a large section of the general public does not have access to such green spaces. As the green spaces are the important components of the urban landscape and provide multiple benefits through acting as a lung of cities, improve the physical, psychological stress relief center and improve social harmony through social interaction and recreation. At the meantime, unplanned expansion and development have been leading the city to the multiple risk hotspot area from various environmental, social and disaster perspective. In this situation urban green spaces are considered as important natural contributor that supplies numerous ecosystem services for human kind living in cities and can be a noteworthy part to reach sustainable development goals. In Kathmandu metropolitan city growing numbers of population and their derived services and unmanaged distributions of facilities like schools, health, facilities, settlements, changes in land cover through unplanned development activities have put city in to more risk and vulnerable. Likewise air pollution poses another risk to people and situation is getting more worsen as shown by recent reports. In this situation KMC should focus on development of urban open green spaces with considering as interdisciplinary and integrative move towards achieving environmental, social, economic, cultural, and disaster risk reduction and overall building a resilience where many crosscutting ecological benefits that greenery provide are affected by land cover change and unplanned urbanization. As open green spaces provide many ecological and social functions that directly and indirectly benefits peoples and other organism around. Further these green spaces help to protect urban biodiversity to protect urban landscape through mitigation and adaption of adverse impact of climate change, through heat reduction and cooling effects. Likewise many studies have also found that urban green spaces have a natural ability to filter pollution from the air and reduce local air and ground temperature too which also can play significant role in combating air pollution issues in Kathmandu metropolitan city, the same way the green space also helps to maintain the hydrology around city, provide emergency shelter and many more.
As risk resilient urban development and environmental friendly resilient planning are the key important plan those 20 years strategic development master plan for Kathmandu valley master plan (2015–2035) highlights and should incorporate values of open green space as core for resilience cities. The current and future urbanization trend of city including environment, socio-political and economic situations are the key concern in Kathmandu metropolitan city to address these concerns the green open space also plays a significant role. More recent Kathmandu metropolitan city have been planning to build at least one park in each ward and expand the green belts throughout the city where the finding of this study could support planner for better urban green space development for urban resilience building purpose. Likewise, looking at the global implication prospective many cities in middle to low income countries have been suffering from various unplanned urban expansion and force themselves to more risk and vulnerable, in this milieu the findings of this analysis could enable a new assessment of possible spatial planning of urban green space development in cities especially, which have suffered from unplanned urbanization and prefer to have urban resilience plan for developing an effective strategy options for spatial development of urban green spaces in cities area as well as elsewhere in the world for sustainable urban development.
Acknowledgments
Author would like to thank all organizations who provide the data sets for this study. The author is grateful for the constructive comments from the editor and anonymous reviewers.
Conflicts of interest
The author declares no conflict of interest.