

Abstract
The Gulf of Mexico (GoM) is heavily exploited by the oil industry. Incidental oil releases, such as the 2010 blowout of the Deepwater Horizon platform, lead to a large scale dispersion of pollutants by ocean currents, contaminating the coastline and damaging the ecosystems. In order to determine whether the ocean dynamics hampers or conversely fosters the landing of material in the coastal regions, we simulate more than 29 000 individual tracer releases in the offshore waters of the GoM. We assume that the tracers are not decaying and transported passively by the ocean currents. In a first part of our study we focus on the mean dispersion pattern of 80 releases occurring at the location of the Deepwater Horizon. In a second part, we generalize the metrics that we defined to the whole GoM. Our study shows that releases occurring in specific regions, i.e. the bay of Campeche, off the Mississipi-Alabama-Florida and the West Florida shelfs are associated with higher environmental costs as the ocean currents steer the released material toward the productive coastal ecosystems and foster landings. Conversely, the tracers released off the Louisiana-Texas-shelfs and the center of the Gulf of Mexico are less threatening for coastal regions as the material recirculates offshore. We show that the coastline of the southwest part of the Bay of Campeche, the Mississipi's mouth and the Island of Cuba are particularly exposed as 70% of the landings occur in these 3 regions.

Original content from this work may be used under the terms of the Creative Commons Attribution 3.0 licence. Any further distribution of this work must maintain attribution to the author(s) and the title of the work, journal citation and DOI.
1. Introduction
The Gulf of Mexico (GoM) is characterized by an intense anthropogenic activity. The four biggest industries in the Gulf of Mexico are oil, tourism, fishing and shipping; they accounted in 2007 for $234 billion in economic activity (Cato et al 2008). Two-thirds of that amount is generated in the United States, with the other third is in Mexico. The oil industry alone represents 53% of the total activity. The United States Energy Information Administration (EIA) estimated the 2015 US oil production to be about 1.6 million barrels/day whereas the Mexican production was about 1.8 million barrels/day. The total production of the GoM represents more than 3% of the world's total production (100 million barrels/day source EIA).
As technology has progressed over the years, oil companies have extended drilling and production farther offshore and into deeper waters. In 2009, about 80% of the northern Gulf of Mexico oil production originated from wells drilled in water depths greater than 500 m ('deep water') and 30% in water depths greater than 1500 m ('ultra-deep water'). In contrast, 90% of the oil was extracted in shallow waters before 1995 (source EIA, Moerschbaecher and Day Jr 2011). As an example of this trend, all of the 14 oil production projects which started between 2015–2017 involved drilling in water deeper than 500 m, with 7 of them in waters deeper than 1500 m (source EIA). Among the deepest drilling sites are the platforms associated with the Perdido and the Stones projects which lie in waters 2400 m and 2900 m deep respectively. The deepest water where a discovery has been made is 3040 m, close to the Sigsbee escarpment (source Bureau of Ocean Energy Management - BOEM), suggesting that oil exploitation in abyssal plains may be possible in the near future. In total, more than 2700 leases are active in the US sector of the GoM (source BOEM: https://www.boem.gov/Gulf-of-Mexico-Region-Leasing-Information/) (figure 1). The Mexican government opened 3 rounds of lease sales since 2015 permitting the participation of international companies in the Mexican 'deep waters'. In January 2018, 19 leases were adjudicated (source Mexican Secretary of Energy—SENER: https://rondasmexico.gob.mx). Last but not least, while the Cuban production is currently negligible (∼0.05 million barrels/day), the currently unexploited oil reserves in the deep waters located north off Cuba may reach 10 billion barrels, a size similar to the Mexican oil reserves and half of the US GoM reserves (Schenk 2010).

Figure 1. (a)—Oil and gas leasing for exploration and exploitation (blue: USA. Source BOEM: https://www.boem.gov/Gulf-of-Mexico-Region-Leasing-Information/, green: Mexico, source SENER (https://www.gob.mx/sener/acciones-y-programas/programa-quinquenal-de-licitaciones-para-la-exploracion-y-extraccion-de-hidrocarburos-2015–2019, yellow: Cuba, source: Nerurkar and Sullivan 2011). The name of the shelves have been specified : Louisiana—Texas (LATEX), Mississipi-Alabama-Florida (MALFA), West Florida Shelf (WFS), Tamaulipas-Veracruz (TAVE), The location of the Bay of Campeche is indicated as BoC. The black dot is the Deepwater Horizon (DWH) location. The mean Loop Current velocity (ms−1) is displayed in grayscale.
Download figure:
Standard image High-resolution imageThe development of the 'deep' and 'ultra-deep' offshore exploitation leads to environmental issues. The tragedy of the Deepwater Horizon which occurred in April 2010 illustrates the consequences of a rig blowout. Estimates suggest that the blowout and the subsequent sinking of the platform resulted in the release of approximately 4 million barrels into the northern Gulf of Mexico over a 3 month period, from April to June 2010 (Crone and Tolstoy 2010). About half of the oil remained at depth while the other half reached the surface (see Passow and Hetland 2016 for a global budget). More than 1800 km of coasts were polluted (Michel et al 2013, Nixon et al 2016), representing the largest marine oil spill in history by length of shoreline oiled (Nixon et al 2016). Closures of commercial and recreational fishing covered approximately 15% of the Gulf of Mexico during nearly 2 months (Gohlke et al 2011). Between 2 and 5 trillion fish larvae were killed directly by the spill (Final Programmatic Damage Assessment and Restoration Plan) and the oil incorporated into the foodweb (Graham et al 2010, Chanton et al 2012). A comprehensive review of the impacts on the ecosystem is available in Joye et al (2016). Long term effects include a reduction of the habitat of species such as the bluefin tuna (Hazen et al 2016) and a significant increase in mortality in fishes (Esbaugh et al 2016, Incardona et al 2014), oysters (Vignier et al 2017) and corals (DeLeo et al 2016).
In order to organize efficiently spill responses (e.g deployment of booms or skimmers) and minimize the negative effects of oil release, numerical models of the ocean are used by the academic community and environmental agencies to forecast as realistically as possible the extension of the spill at short time scale (next hours or days). These so-called 'operational models' use observations (e.g remote sensing data) to constrain the ocean simulations in a realistic manner. The simulated velocity fields are used to transport 'particles' of oil, which locations of origin are eventually seeded by satellite imagery (Liu et al 2011). For this purpose the US National ocean and Atmospheric Administration (NOAA) uses the General Operational Modelling Environment (GNOME) framework) (MacFayden et al 2011). Other comparable engines have been developed such as MEDSLIK (DeDominicis et al 2013) used by the Regional Marine Pollution Emergency Response Centre for the Mediterranean Sea (REMPEC). To complement these operational applications, ocean models are also used to improve our understanding of the oil-ocean system and quantify the role of specific biogeochemical and physical processes, such as the biodegradation (Valentine et al 2012), the role of the waves (Weisberg et al 2017), the mesoscale and submesoscale activity (Bracco et al 2018).
Most of the studies characterize the extension of spills originating from a single location under specific conditions. Few studies focus on a systematic exposure analysis and on determining the environmental impact (e.g coastline landings) of an eventual spill. The objectives of such exposure analyses are fundamentally different compared to operational applications. By making an analogy with meteorological sciences, risk analyses characterize the 'climate' (broad context, probabilistic aspect) while operational applications focus on the current 'weather' (short time scale, specific event). Risk analyses are usually performed by statistical models, such as the Oil Spill Risk Analysis (OSRA) model, an environmental impact assessment tool using a Lagrangian framework that provides estimates of the probabilities of oil spill occurrence and coastal contact (Price et al 2004, 2006). The OSRA model has been applied to the location of the Deepwater Horizon platform (Ji et al 2011). In some cases the location where an incident may occur is however not necessarily known with precision. A typical case is the shipping and maritime industry as an incident may occur on any part of a shipping lane. In this context, Soomere et al (2014) developed a method for the preventive reduction of the remote environmental risks by computing the average probability for a particle to reach the coast from a shipping lane in the Baltic Sea. Liubartseva et al (2015) derived beached oil hazard maps in the Ionean Sea. Singh et al (2015) identified that 83% of the coastal regions of the Caribbean Sea are potentially at risk from oil spills occurring along shipping lanes. A similar underlying question, i.e. 'how large is the coastal exposure to the whole economical activity ?' applies to the oil industry. Very few studies tackle this issue. Among those, Nelson et al (2015) assess the exposure of the northern coastline of the GoM to 5 potential spills locations in deep offshore regions. Nelson and Grubesic (2018) simulate 10 spills in the Eastern GoM to assess the environmental exposure of the Florida coastline to a potential development of offshore activities. We perform a basin-scale dispersion study simulating more than 370 release locations.
In this pilot study, we do not intend to tackle the physical and chemical oil complexity. Instead of selecting arbitrary a specific type of oil, we assume that the released material is purely passive and focus specifically on its transport due to ocean circulation (section 2), After detailing the dispersion patterns, coastal accumulation, and metrics applied to the specific case of a release occurring at the DWH location (section 3), we generalize this approach to the whole set of release locations (section 4) and determine (i) whether some specific releases locations have the potential to cause a larger environmental impact than others (e.g wider dispersion, larger coastal contact) (ii). whether some locations of the coastline of the GoM coastline are either 'protected' by the ocean circulation (the current system hampers the landing of material) or conversely particularly exposed (the current system drives the material toward the coastline). We conclude in section 5.
2. Experiments
2.1. Regional characteristics of the GoM
The near-surface circulation of the GoM is dominated by the Loop Current, which enters the Eastern Gulf of Mexico through the Yucatan Straits and exits through the Strait of Florida. It extends northward and bends at a variable most northern position that can reach the Mississipi-Alabama-Florida shelves (MALFA) (see figure 1) (Sturges and Leben 2000, Andrade-Canto et al 2013, Sheinbaum et al 2016). The western part of the Gulf is constrained by a persistent (except for summer) cyclonic gyre located on the shelves of Texas—Louisiana (LATEX) (Cochrane and Kelly 1986, Cho et al 1998, Nowlin et al 2005), a semi-permanent cyclonic Gyre in the Bay of Campeche and the large anticyclonic Loop Current eddies (∼200–300 km diameter) that shed from the Loop Current and travel westward across the GoM. The circulation on the shelves is regionally dependent and dominated by its along-shore component (Zavala-Hidalgo et al (2003, 2006), Weisberg et al (2000)). It is characterized by large seasonal variability that impacts cross-shelf transports usually confined to specific regions such as the TAVE (Tamaulipas-Veracruz) region, located between the LATEX shelf and the western GoM shelf and extending till the Bay of Campeche (Martinez-Lopez and Zavala-Hidalgo (2009), Zavala-Hidalgo et al (2003), Weisberg and He (2003)). From a biological perspective, there is a clear contrast between the productive coastal waters and the oligotrophic deep waters. The major river discharges, in particular the Mississippi River strongly constrain the biological activity (e.g: Lohrenz et al 1990, 1997).
2.2. Modeling framework and methodology
The circulation fields (temperature, salinity, currents, diffusivity) have been obtained using a GoM regional configuration based on the Nucleus for European Modelling of the Ocean (NEMO), a state-of-the-art modeling environment of ocean related engines (Madec 2016). The configuration that we employed, called GOLFO12, is described in detail in Damien et al (2018) and similar to the one used in Garcia-Jove Navarro et al (2016). The resolution is 1/12° degree in longitude and latitude. The model includes 75 vertical levels (25 in the first 100 m). The atmospherical forcings are given by the interannual 3h-resolution Drakkar Forcing Sets 5 (DFS5) dataset (Brodeau et al 2010) from 1995 to 2015. Boundary conditions are constrained by the Mercator reanalysis GLORYS. The circulation model has been coupled to the PISCES biogeochemical model (Aumont et al 2015). The GoM circulation and the distribution of chlorophyll, further used in this study, displays consistent patterns with observations (Damien et al 2018).
The released passive tracers are transported using a full Eulerian framework using the 'offline' version of the NEMO modeling environment (configuration GOLFO12-OFF). The 'offline' tridimensional grid is identical to the grid used in the 'online' GOLFO12 configuration briefly described above. The advection scheme employed is based on the Monotonic Upwind Scheme for Conservation Laws (MUSCL) (VanLeer 1979), which provides accurate numerical solutions even in cases where the solutions exhibit large horizontal or vertical gradients. Isopycnal diffusion is included (coefficient 220 m2/s). Vertical diffusion of tracers is performed by the Generic Length Scale (GLS) scheme (Reffray et al 2015).
We implemented a total of 371 passive tracers covering all the regions of the GoM deeper than 1000 m (figure S1 is available online at stacks.iop.org/ERC/1/081006/mmedia).Each passive tracer is initialized with an arbitrary value at surface of 1000 permil in a 0.5 degree * 0.5 degree box and 0 elsewhere. We performed simultaneous releases at surface at these 371 locations considering that the tracer is neutrally buoyant and passively transported by the model ocean currents. The tracers are not decaying as the objective of this idealized study is to estimate the potential maximal dispersion and accumulation on the coastline rather than to describe a specific spill as realistically as possible (as e.g in Barker 2011, Paris et al 2012, LeHenaff et al 2012, Boufadel et al 2014 in the case of the Deepwater Horizon). The tracers accumulate once they 'land' (i.e. when they are located in an ocean box adjacent to the coast). A release is performed every 3 months from 1995 to 2015 totalizing 80 releases of 371 tracers (more than 29 000 releases) integrated during 3 months each (examples of individual releases are displayed in figure S2).
3. Test case : releases at the Deepwater Horizon location
We consider here the tracers released at surface at the Deepwater Horizon (DWH) location (28.8 °N/88.3 °W) and compare the simulations (location of coastal landing, extension of contaminated area) to 'in situ' observed data. As a note of caution, it does not constitute a validation of the model's performance as our experiments specifically focus on evaluating the role of the upper ocean circulation on the dispersion of passive tracers. Furthermore an ensemble of 80 experiments characterized by different circulation patterns is considered. It however indicates whether the simulated coastal and environmental exposure is consistent at first order with an event which occurred in reality and allows to detail our methodology and to introduce key quantitative metrics
3.1. Exposure of the coastline
The DWH coastal oiling reached its maximum about 3 months after the spill (July 2010): more than 1800 km of coasts were affected ('maximum oiling') as revealed by 'in situ' observations performed during the Shoreline Cleanup Assessment Technique (SCAT) program (Michel et al 2013, Nixon et al 2016). The regions close to the Mississipi's mouth (30 °N/90 °W) and Mobile Bay (30.5 °N/88 °W) were heavily impacted (see Michel et al 2013 Figure S3(a)). The mean pattern of the simulated coastal landings after 3 months integration in GOLFO12 (figure 2(a)) shows similarities with the SCAT observations, with a strong accumulation close to the Mississipi's mouth (more than 5 permil of the released tracers) and east of Mobile Bay (4 permil). The average total coastal accumulation is 565 permil. The 'polluted' (we define the pollution threshold as 0.01 permil) area extends from 97 °W to 83 °W in the LATEX-MAFLA coastline in our experiments; the total length of the polluted coastline represents 18% of the GoM coastline.

Figure 2. (a) - mean (80 releases every 3 months from 1995 to 2015) tracers concentration on the coastline 3 months after a release of 1000 permil at Deepwater Horizon location (black square). (b), (c)—frequency (%) of b- > 'pollution' (0.01 permil threshold), c- > 'heavy pollution'(1 permil threshold).
Download figure:
Standard image High-resolution imageThe regions located between 92 °W and 86 °W (LATEX-MAFLA) are 'very frequently' (75 to 90% of the experiments) or 'always' (>90%) polluted (threshold 0.01 permil), while the regions located west of 94 °W and east of 84 °W are polluted in less than 25% of the releases (figure 2(b)). The central part of the LATEX shelf is polluted in about 25%–75% of the releases, depending both of the eddy activity and the seasonal circulation. The connection between the eastern and the western part of the GoM is stronger in October/November leading to an increase of the tracer transport from the MALFA toward the LATEX shelf in winter. Morey et al (2003) showed that in winter 52% of the drifters deployed in the MALFA travel westward (compared to 1% in summer), past the Mississippi Delta, and onto the LATEX shelf. In the MALFA shelf the winds are most intense and southwestward in Autumn (Velasco ans Winant 1996), fostering the transport of tracers toward the coast (onshore Ekman transport), explaining the 25%–75% pollution probability between 86 °W and 84 °W.
Using a larger 'heavy pollution' threshold (1 permil) shows a similar geographical pattern (figure 2(c)). The probabaility of 'heavy polution' close to the Mississipi's mouth and east of Mobile bay are however lower and ranges between 50 and 75%. The mean length of the 'heavy polluted' coastline is about 7%.
3.2. Surface dispersion and ecosystem exposure
The mean surface dispersion of the tracers released at the DWH location displays similarities with the surface dispersion monitored by remote sensing (source : National Environmental Satellite, Data, and Information Service, NESDIS) (Leifer et al 2012) and forecasted by operational models (figure S3(b)). A part of the oil slicks was transported toward the coast where it landed, while the other part was transported offshore where it reached the northern rim of a Loop Current eddy located approximately at 27 °N (Weisberg et al 2017) in the form of a 'tiger-tail' filament (Olascoaga and Haller 2012). In the specific case of the DWH, the observations show very little surface oil south of about 26.5 °N and west of about 85 °W (Ylitalo et al 2012), possibly due to biodegradation (North et al 2015)/weathering processes and the use of dispersants.
In our model experiments, the tracer concentration is maximal east of the release location. The tracer reaches the loop current and is advected toward the Florida and Cuba region. The extension of the modeled spill is similar in >90% of the releases between 27 °N-28°N and 88 °W–84 °W (threshold 0.05 permil: figure 3(b)) or east of 88 °W (threshold 0.005 permil: figure 3(c)). The western extension is characterized by a stronger variability, in particular due to the presence of the mesoscale activity associated with the loop current, the role of the seasonal cycle and the strength of the connection eastern/western GoM (see 3.1).
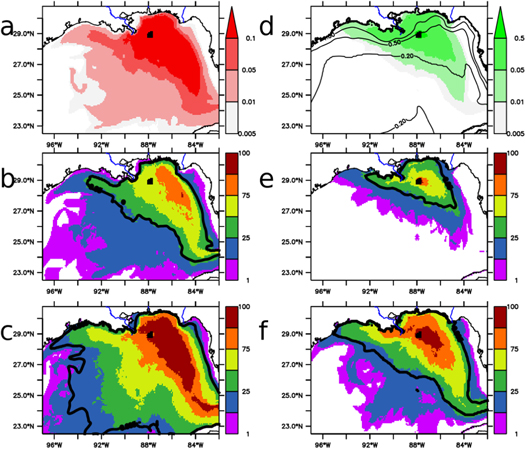
Figure 3. (a)—mean tracer depth-integrated concentration (permil) after 3 months. b- percentage of the experiments where the tracer concentration is greater than (b)- > 0.05 and (c)- > 0.005 The contour represent the b- 0.05 and c- 0.005 concentration isoline. (d)– Chlorophyll-Tracer Index (CTI) (mgChl.permil) (see definition in the main text) (contour : mean surface chlorophyll concentration (mg.m-3)). (e), (f)- percentage of the experiments where the CTI is greater than e- > 0.05 and f- > 0.005. The contour represent the b- 0.05 and c- 0.005 CTI isoline. The black square represents the release location.
Download figure:
Standard image High-resolution imageThe DWH release occurred in one of the most productive regions of the GoM due to the fertilizing role of nutrients originating from the Mississipi's mouth (Lohrenz et al 1997). The impact of oil on organisms, foodwebs and ecosystems is complex and includes multiple feedbacks (Joye et al 2016, Short et al 2017). The chlorophyll concentration in the upper ocean is directly related with the primary productivity and is simulated by GOLFO12 in a consistent way compared to observations as shown by Damien et al (2018). In a very crude way, we computed a 'Chlorophyll-Tracer Index' (CTI) (figure 3(d)) to quantify the co-presence of both chlorophyll and tracer. The CTI is computed as the integral of the chlorophyll concentration obtained by GOLFO12 multiplied by the tracer distribution. High values indicate that high tracer levels are located in productive regions, resulting in a strong negative impact on the ecosystem. Lower values indicate that either the released tracer displays lower concentrations and/or that the region is less productive. The CTI is maximal between the DWH release location and the coastline as the productivity is maximal on the shelf and the tracer concentration high. Its value is lower in the center of the GoM as chlorophyll concentrations are lower. The integrated CTI value is valuable to compare different spills location (see 3.3 and 4).
3.3. Quantitative set of metrics
Based on the analysis above we derive a set of metrics (table 1) which characterize the spill originating from the DWH location. These metrics will be used to perform a basin-scale characterization (see part 4.1)
Table 1. Quantitative metrics used to characterize a release occurring at the DWH location and generalized to the whole GoM (3 months integration).
| Metric | DWH | GoM |
|---|---|---|
| Integral of landed tracers (permil) | 565 (mean value) | figure 4(a)-I |
| Integral of landed tracers : greater than 50/200/500 permil | 77/56/38% of the experiments | figure 4(a)-II–IV |
| Coastal extension (% of the total GoM coastal length : threshold 0.01 and 1 permil) | 18%/7% (mean value) | figure 4(b)-I (threshold 0.01 permil) |
| Coastal extension (threshold 0.01 permil) greater than 5%/10%/20% of total GoM length | 91/82/52% of the experiments | figure 4(b)-II–IV |
| Surface extension (% of the basin surface : threshold 0.005 and 0.05 permil) | 25%/12% (mean value) | figure 4(c)-I (threshold 0.005 permil) |
| Surface extension (threshold 0.005 permil) greater than 20%/30%/40% of the GoM surface | 81/26/3% of the experiments | figure 4(c)-II–IV |
| 'Chlrophyll-Tracer Index' | 270 (mean value) | figure 4(d)-I |
| CTI greater than 50/100/150 | 85/80/36% of the experiments | figure 4(d)- II–IV |
3.4. Exposure and release location
The metrics (see table 1) computed for each 371 release locations at sea surface are reported at the location of each release and displayed in figure 4. The release regions characterized by large amount of landings are located in the Bay of Campeche (up to 1000 permil), off the MALFA shelf (up to 800 permil) and close to the Cuba Island (1000 permil) (figure 4(a)-I). The regions presenting large mean landing amounts are also characterized by high frequency of occurrences (figure 4(a)-II–IV). For instance a total landing greater than 200 (500) permil originate from releases regions located in the southwest bay of Campeche and close to the Cuba Island in 75 to 90% (50 to 75%) of the experiments and 50 to 75% (25 to 50%) of the experiments close to the MALFA shelf. Conversely to these 'hotspots', a release occurring in the regions located off the LATEX and the West Florida shelfs has relatively few impact on the coastline (less than 100 permil). An explanation is that the LATEX shelf presents a semi permanent cyclonic circulation (Cochrane and Kelly 1986), which may acts as a dynamical barrier and traps the tracer in its center. The southern part of the WFS is characterized by a persistent cross shelf barrier (Olascoaga et al 2006). More intuitively, a release occurring in the center of the GoM does not impact the coastal regions in a 3 months timescale as the tracer recirculates in the center of the GoM. It is noteworthy that the horizontal gradient is significant : release locations potentially polluting the coastline are located close to regions which do not pollute the coastline (especially close to the bay of Campeche, around 23 °N–94°W).

Figure 4. (a): integral (permil) of landing tracers for each release location. (b): length of polluted coast (% of GoM total coast length) for each release location. (c): surface contaminated (% of GoM total surface) for each release location. (d): 'Chlorophyll-Tracer Index' (permil.mgChl.m-3) for each release location. I: mean value (average of 80 experiments). II–IV:% of experiments greater than a given threshold (thresholds a-II–IV: 50,200,500/b-II–IV : 5,10,20/c-II–IV : 20,30,40/d: II–IV: 50,100,200).
Download figure:
Standard image High-resolution imageComplementary to the total landed material, the figure 5(b)-I shows the mean length of the polluted coastline (threshold 0.01 permil) for each release location. A release occurring on the MALFA shelf or close to the island of Cuba pollutes up to 20% of the total GoM coastline. A release occurring in the bay of Campeche pollutes up to 15% of the total GoM coastline as the circulation in the Bay of Campeche is sluggisher. A basin scale pollution (defined as >20% of the length of the GoM coastline—figure 4(b)-III) occurs in 25%–50% of the experiments where the release location is located in MALFA shelf and the Cuba Island, while it almost never occurs when it is located in the Campeche region. The material released close to the Cuba Island is characterized by a broad dispersion, likely due to the transport by the loop current/eddies. The role of the loop current is clearly visible in figure 5(c)-I, showing the mean surface extension of the tracer (threshold 0.005 permil as in figure 3(c)). The tracer originating from the regions located westward of 88 °W spreads into the GoM and covers after 3 months about 30%–35% of the GoM surface (in 50–75 of the experiment, the area polluted covers more than 30% of the GoM—figure 4(c)-III). Conversely, east of 88 °W the contaminated surface area is smaller (5 to 25%) as a significant amount of tracers is flushed out from the GoM to the Atlantic Ocean.

Figure 5. (a)- mean integrated levels (permil) of coastal landings in the case of a simultaneous release of the 371 tracers covering the whole GoM. The regions highlighted in red ('hot spots') are the regions where the accumulation is larger than the mean accumulation (value 78.7 permil). (b)- percentage of the experiments where an accumulation greater than the mean accumulation (78.7 permil) occurs. (c): percentage of the experiments where an accumulation greater than 10 permil occurs. d- tracer origin (%). (d)- origin (%) of the tracers accumulating in each 'hotspot' (contour 0.01%).
Download figure:
Standard image High-resolution image
The CTI is displayed as figure 4(d). Its distribution highlights the large chlorophyll exposure associated with releases located off the MAFLA shelf, where the CTI is maximal as the mean chlorophyll concentration is high off the shelf (between 0.2 and 1 mmol.m-3). Depending of the circulation strength a larger amount of tracer is transported toward the coast, where chlorophyll concentrations are higher thus increasing the CTI. The Bay of Campeche is characterized by intermediate values. The region close to the Island of Cuba is characterized by low CTI as the chlorophyll concentration is low.
3.5. Exposure of the coastline
Are some specific regions more likely to be impacted by oil originating from an offshore 'deep water' platform? We derive a basin-scale picture of the coastal accumulation pattern in the GoM (figure 5(a)) from a 'coastal perspective' (i.e. the occurrences of landings on a specific coastal point independently of the release origin). A preferential coastal accumulation occurs after 3 months integration in three 'hotspots': the island of Cuba (annual mean 22% of the tracers which landed in the GoM), the Bay of Campeche (32%), the region close to the Mississipi mouth (16%): more than 70% of the landing tracers are located in these three regions while the coastline length represents less than 30% of the total coastline. A similar pattern occurs in most of the release experiments (figure 5(b)) : an accumulation greater than the mean accumulation (threshold 78.7 permil) occurs in >90% of the experiments in the Bay of Campeche and the Cuba island. It occurs in 50%–75% of the experiments in the LATEX-MALFA shelf. Conversely, the tracer does not accumulate in other regions of the GoM : western LATEX shelf, bank of Campeche (<10% of the experiments). Performing a similar analysis using a low threshold of 10 permil highlights clearly the three 'hotspots' regions (accumulation in >90% of the experiments) (figure 5(c)).
In order to determine the origin of the the tracers which landed in each of the three 'hotspots', we computed the normalized value (landings originating from a given release location in a hotspot region divided by the total landings occurring in the same hotspot) at the tracer release location (figure 5(d)). A part of the tracers landing in Cuba originates from the regions located off the West Florida Shelf (WFS) and are strongly constrained by the extension of the Loop Current. A large part of the tracers landing in the western Bay of Campeche originates from the southern part of the western GoM, highlighting the role of the currents located off the TAVE shelf. The tracers landing close to the Mississipi's mouth are issued from the regions located in front of the MALFA and eventually LATEX shelf. Depending on the ocean conditions, the tracers released in the western part of the GoM (25–28 °N, 96–94 °W) may land either in the Bay of Campeche or in the Mississipi's mouth. The TAVE shelf is characterized by a large seasonal variability: the currents are going southward from September to March and northward from May to August (Zavala-Hidalgo et al 2003), explaining that a small fraction of the tracers released in this region may reach the Mississipi region. Similarly, a small fraction of the tracers released in the eastern part of the Gulf (90–86 °W, 24–28 °N) may land in the Cuba island, possibly depending of the extension of the loop current. The interconnections between the three regions of origin are however small as few overlaps are presents. It supports the concept of dynamical geographies with weakly interacting provinces in the GoM (Miron et al 2017).
4. Conclusion and discussion
Using a Gulf of Mexico configuration of the NEMO Ocean General Circulation Model we aim to quantify the exposure of the coastline and the open waters to a passive tracer release occurring at surface in 'deep offshore' waters. While the quantification of coastal exposure to pollution using ocean circulation models is not novel, the 'deep offshore' oil exploitation is a new source of risks as an incident may affect large and remote areas due to the basin-scale transport of material by ocean currents. An example of such an incidental release followed the 2010 blow-out of the Deepwater Horizon (DWH) oil platform. In a first part of our study, we focus on a release occurring at the DWH location. The mean coastal landing display patterns consistent at first order compared to 'in situ' coastline oiling surveys conducted after the DHW spill, in particular a strong landing rate close to the Mississipi mouth and east of the Mobile bay. We determine key, basic, metrics : landing amount of the released tracer, extension of the coastline polluted by the tracer, surface of the polluted ocean, co-presence of both released tracer and chlorophyll, a proxy for ecosystem productivity.
We generalize the use of these metrics to 371 release locations covering the whole 'deep offshore' waters of the Gulf of Mexico. The experiments have been repeated 80 times, during each season from 1995 to 2015 (total 29 680 individual releases). The role of ocean dynamics on the landing of material in coastal regions strongly depends of the release location and the ocean dynamical properties (mean and variability of currents, level of eddy activity). Both determine the pathways that the material follows. As a note of caution, the role of the Stokes drift has not been taken in account; in complement to the ocean circulation, the 'windage' impacts the dispersion of material (LeHenaff et al 2012). Our study focuses specifically on the role of ocean currents. Specific release locations (in the bay of Campeche, off the Mississipi-Alabama-Florida -MALFA- and close to the Cuba Island) are characterized by a large negative potential environmental impact as the system of ocean currents steer the released material toward the coast while some others (off Louisiana-Texas -LATEX -shelfs, GoM center) are less threatening as ocean currents steer the released material toward the GoM interior (or even outside the GoM). Our study highlights that a tracer release occurring in 'deep waters' may have a basin-scale impact. We show that the coastline of the western and southern part of the Bay of Campeche, the region close to the Mississipi mouth and the Cuba Island are the most exposed.
Our study presents limitations. The most obvious is that the complexity of the physico-chemistry of the transported material, e.g oil (e.g Spaulding 2017) is not taken in account, as we focus on the role of the ocean circulation in transporting a purely passive tracer. Not accounting for oil dissolution and weathering results in biases toward a over/under estimating the impacts of long/short-transport oiling. Another important limitation is the model resolution. While our mesoscale (1/12°) model displays consistent patterns of ocean circulation with observations (Damien et al 2018), Bracco et al (2018) results indicate that the submesoscale processes (<3 km) can have an important role in the open ocean/shelf exchanges in the northern GoM. Sensitivity tests to determine the impact of higher resolution in the whole GoM are needed. Our study can nevertheless help as a benchmark when using for instance better model resolution and/or a realistic oil spill model.
An aspect which is not assessed here is the potential fate of the so-called 'deep plumes', formed during the release of oil in deep waters as the mixture of buoyant compounds and dense sea water becomes neutrally buoyant (Socolofsky et al 2011). In the case of the DWH, about half of the total discharged oil formed a deep plume, located at about 1000 m depth (e.g Reddy et al 2011, Ryerson et al 2011, Paris et al 2012). This deep plume, even if it does not reach the shoreline, may sediment on the floor and cause ecological damages (Valentine et al 2014). In situ experiments based on the release of a dye close to the sea floor of the DWH location showed a slow transport in the water column and the whole GoM (Ledwell et al 2016).
Despite these limitations, we believe that the results derived from our modelling experiments and more particularly the methodological concept described here could be useful to optimize the coastal planning and are valuable to preventively mitigate the effect of a spill on the environment. A relevant question is for instance to determine what is the 'best' place to implement a major facility or a marine protected area (see the review of Coleman et al 2004, Ortiz-Lozano et al 2013) which should remain as free as possible of pollutants over long (decades) time scales. The exposure considered from a release location perspective is valuable for governmental agencies, the oil and the insurance industry in order to allow a better preparedness regarding the potential environmental and economical (Smith et al 2010) cost of a major incident occurring at a specific location as our study shows that oil exploitation occurring in specific regions may be associated with a higher environmental cost.
As a final consideration, coastal regions are both the primary area of ocean resources and the place where highly complex and fragile ecosystems are located. Quantifying the risks associated with incidental pollution is challenging especially in the context of the on-going climate change and the increased anthropogenisation, fostering stressors such as marine deoxygenation (Breitburg et al 2018, Scavia et al 2017) which may reinforce the negative impact of a pollution event. Having a clear overview of the environmental exposure linked with anthropogenic activities is necessary to reduce and mitigate the impact of these activities on the environment and increase sustainability.
Acknowledgments
Research funded by the National Council of Science and Technology of Mexico (CONACYT)—Mexican Ministry of Energy (SENER)— Hydrocarbon Trust, project 201441. This is a contribution of the Gulf of Mexico Research Consortium (CIGoM). We acknowledge the provision of supercomputing facilities by CICESE.
Code availability
The code of the NEMO (Nucleus for European Modelling of the Ocean) framework is available at https://www.nemo-ocean.eu/.
Data availability
The data (model outputs) that support the findings of this study are available from the authors upon request. The circulation fields and the simulated chlorophyll concentration are obtained from the experiments performed in Damien et al (2018).