


Abstract
The United States is the largest supplier of dairy products globally, making it an important focus for environmental, economic, and societal outcomes. Increasingly greenhouse gases (GHGs) have become an area of focus for the industry, as industry groups have set their own goals to improve environmental impacts. A significant portion of dairy GHG emissions come from manure management, which can vary considerably by farm and region. Here we explore how the adoption and use of six common manure management strategies (MMS) have changed over a recent 12-year period, and how this relates to milk production, climate, and manure GHGs. Using data from the United States Department of Agriculture, the Environmental Protection Agency, and the National Oceanic and Atmospheric Administration across all fifty states, we find that overall US dairy manure management GHG emission intensity (CO2e per kg of milk produced) has increased 18% between 2003 and 2014, which is associated with an increase in adoption of liquid and anaerobic MMS. However, we also find that these systems are positively associated with higher productivity: nationally, total milk production grew by 21.0%, while the cow herd inventory grew by just 1.9%, an increase of 18.7% in per-cow milk production over the study period. We find clear regional adoption of certain kinds of MMS, which relate in many cases to temperature and rainfall. We discuss why these shifts may have occurred as a result of economic and policy drivers, including the shift towards these MMS for compliance with new water quality policies in the past decade, highlighting the tradeoffs that exist in on-farm decision-making. We provide some potential strategies to reduce GHG emissions in these systems while simultaneously considering water quality and other potential tradeoffs. We suggest that transitioning to some of these strategies requires additional research to better understand farmer decision-making as it relates to MMS, a currently understudied topic.
Export citation and abstract BibTeX RIS

Original content from this work may be used under the terms of the Creative Commons Attribution 3.0 licence. Any further distribution of this work must maintain attribution to the author(s) and the title of the work, journal citation and DOI.
1. Introduction
The US dairy industry is the largest producer of cow's milk in the world, producing more than 93 million metric tons of milk in 2014 [1]. This production meets a growing demand for dairy products, not only within the United States, but increasingly throughout the world. Between 2003 and 2014, US per capita consumption of dairy products rose from 597 pounds per person to 616 pounds per person [2], a 3.2% increase. Simultaneously, the dairy industry is faced with new consumer demands including environmental sustainability. Recent research suggests that consumers are willing to pay more for milk with a reduced carbon footprint [3]. In line with consumer demands, the US dairy industry has set high standards for sustainability, including a goal to reduce greenhouse gas (GHG) emission intensity 25% from a 2007 baseline by 2020 [4].
Given the growing demand for milk, and the simultaneous goal of reducing dairy GHG emissions, it is important to examine how dairy emissions have changed over the recent decade as these consumer shifts and sustainability foci have increased. While several recent articles have explored issues of US dairy sustainability at a national level (e.g [5, 6]), here we explore both national and regional changes related to manure GHG emissions in the dairy industry.
This article explores the extent to which manure-generated dairy GHG emissions have changed over a recent 12-year period (2003–2014), and the correlation of GHG emissions to production, climate, and manure management strategies (MMS). While manure-generated GHG emissions have already been reported via the United States Environmental Protection Agency (EPA), our novel contribution is combining multiple datasets to examine the correlations of emissions with MMS, climate, and productivity. We focus on MMS in particular since it is currently the second largest source of GHG emissions in the US dairy sector, behind enteric fermentation [7]. Further, a variety of MMS, which are known to reduce GHG emissions, already exist and are readily-implementable [8]. Conversely, many rumen modification strategies are still in their early development phases and are not widely available or cost effective to mitigate enteric fermentation emissions [9]. Since dairy production varies widely by region, an exploration of how emissions, production, and MMS have changed at regional levels is an important contribution to the literature. Due to the considerable shifts in US dairy production and management methods as compared to 1940, we focus here on the most recent 12 years of available data to explore current dairy production trends [6].
2. Materials and methods
2.1. Data sources
The data utilized in this paper are drawn from several existing datasets and reports from US federal agencies including the EPA, United States Department of Agriculture National Agricultural Statistics Service (USDA NASS), and United States National Oceanic and Atmospheric Administration (NOAA). All data are analyzed at the state level, with each datapoint representing an annual average value for each year from 2003 to 2014. Table 1 details the variables, units, and data sources that comprise our core dataset.
Table 1. Variables, units, and data sources.
| Variable | Units | Sources |
|---|---|---|
| CH4 emissions from dairy operations | kt | 7, 10 |
| N2O emissions from dairy operations | kt | 7, 10 |
| Use of pasture/range/paddock as MMS | % farms | 7, 10 |
| Use of daily spread as MMS | % farms | 7, 10 |
| Use of solid storage as MMS | % farms | 7, 10 |
| Use of liquid slurry as MMS | % farms | 7, 10 |
| Use of anaerobic lagoon as MMS | % farms | 7, 10 |
| Use of deep pit as MMS | % farms | 7, 10 |
| Number of dairy farms | farms | 11 |
| Annual milk production | kg | 12 |
| Average annual milking cow inventory | head | 13 |
| Average annual temperature | deg C | 14 |
| Average annual precipitation | cm | 15 |
Note: All variables represent state-level annual figures for the years 2003–2014. Data were converted from imperial to SI units where applicable.
The EPA's 'Inventory of Greenhouse Gas Emissions and Sinks' reports (together with their annex documentation) [7, 10] provide annual data indicating the percent of dairy farms in each state that used each of the six MMS as their primary method of handling. These EPA reports draw from existing statistical datasets—primarily USDA NASS data—together with expert information from state extension service personnel and university researchers. The following definitions from table A-208 in [10] describe the six MMS considered in the EPA documents, and used in our analyses:
- Pasture/Range/Paddock: The manure from pasture and range grazing animals is allowed to lie as is, and is not managed.
- Daily Spread: Manure is routinely removed from a confinement facility and is applied to cropland or pasture within 24 h of excretion.
- Solid Storage: Manure is stored, typically for a period of several months, in unconfined piles or stacks. Manure is able to be stacked due to the presence of a sufficient amount of bedding material or loss of moisture by evaporation.
- Liquid Slurry: Manure is stored as excreted or with some minimal addition of water to facilitate handling in either tanks or earthen ponds, usually for periods less than one year.
- Anaerobic Lagoon: Uncovered anaerobic lagoons are designed and operated to combine waste stabilization and storage. Lagoon supernatant is usually used to remove manure from the associated confinement facilities to the lagoon. Anaerobic lagoons are designed with varying lengths of storage (up to a year or greater), depending on the climate region, the volatile solids loading rate, and other operational factors. Anaerobic lagoons accumulate sludge over time, diminishing treatment capacity. Lagoons must be cleaned out once every five to 15 years, and the sludge is typically applied to agricultural lands. The water from the lagoon may be recycled as flush water or used to irrigate and fertilize fields. Lagoons are sometimes used in combination with a solids separator, typically for dairy waste. Solids separators help control the buildup of nondegradable material such as straw or other bedding materials.
- Deep Pit: Manure is collected and stored, usually with little or no added water, typically below a slatted floor in an enclosed animal confinement facility. Storage periods range from five to 12 months, after which manure is removed from the pit and transferred to a treatment system or applied to land.
The EPA reports also provide estimates of total annual methane (CH4) and nitrous oxide (N2O) emissions resulting from dairy operations' manure management on an annual, per-state basis. Here we provide an overview of the methods used by the EPA to arrive at these figures. Full details of the calculation procedures are available in the EPA documentation [10].
To determine CH4 emissions from dairy manure, first the quantity of volatile solids (VS) excreted and managed under each MMS in each state is estimated using the EPA's Cattle Enteric Fermentation Model (CEFM). Methane Conversion Factor (MCF) indicates the percentage of manure's maximum CH4 production potential that is actually converted into CH4 during manure management. MCFs for dry systems utilize 2006 Intergovernmental Panel on Climate Change (IPCC) emission factors, dividing states into three temperature categories (table 2 top). Conversely, MCFs for liquid systems are calculated on a per-state basis by applying the van't Hoff-Arrhenius equation, which accounts for seasonal changes in temperatures as well as long term retention time, consistent with IPCC 2006 guidelines (table 2 bottom). VS production figures and conversion factors are then used to generate reported CH4 emissions by state. It should be noted that since temperature is a factor in the calculation, there is an inherent relationship between temperature and CH4 emissions in these data.
Table 2. Methane Conversion Factors used in the EPA calculations for each MMS.
| Dry systems | Cool climate | Temperate climate | Warm climate |
|---|---|---|---|
| Pasture | 1% | 1.5% | 2% |
| Daily spread | 0.1% | 0.5% | 1% |
| Solid storage | 2% | 4% | 5% |
| Liquid systems | Minimum | Mean | Maximum |
| Anaerobic lagoon | 47% | 70% | 79% |
| Liquid slurry/deep Pit | 15% | 29% | 57% |
Source: [10].
To calculate state-level N2O emissions from dairy manure, the amount of N excreted and managed under each MMS in each state is estimated via the CEFM, with the Total Kjeldahl N excretion rate equaling nitrogen consumed minus nitrogen retained by the animal for growth and in milk, as per the IPCC guidelines. IPCC default values for the direct N2O emission factor, the emission factor for volatilization, and the emission factor for runoff and leaching are applied. Reported N2O emissions are generated using N excretion figures and emission factors; with total manure-related N2O emissions equaling the sum of direct and indirect emissions.
In addition to the EPA data, USDA NASS dairy surveys were referenced for annual data on the number of dairy farms, annual milk production, and average milking cow inventory within each state and year. Given there were inconsistences in the non-milking cow data, this analysis only considers the population of milking cows in a given year. Finally, NOAA climatological reports provided state-level data on the average annual temperature and precipitation for each year of the study.
The EPA, USDA, and NOAA data were combined by cross-referencing state and year to generate the core dataset used in our analysis. We note that in the case of the EPA reports, some of the datapoints we use are based upon estimates, which is important to consider when interpreting the certainty of our results and implications of our study. We discuss these limitations further at the end of the discussion section.
2.2. Data processing
Using this core dataset, several other variables were calculated—such as the average annual milk production per cow, total annual GHG emissions from dairy manure (CH4 + N2O) in terms of CO2 equivalency (CO2e), and the average manure-related emissions per kg of milk (i.e. emission intensity)—for each state and year. Note that throughout this paper we use the terminology 'absolute emissions' to refer to total emissions resulting from dairy manure (in g or kg), versus 'emission intensity,' which reports emissions as a function of milk production (e.g. g CO2e/kg milk). Equivalence factors (i.e. global warming potential, GWP) provided by the EPA [16] were used to convert CH4 and N2O into CO2e figures, with a GWP of 25 for CH4 and 298 for N2O. In reporting on national-level statistics, rather than simply averaging results across states—which would have led to inaccuracy due to heterogeneous state-level production quantities—weighted averages based on each state's share of total milk production were calculated.
Initial analysis of the data revealed strong regional trends in both climatic as well as manure management and production variables. To evaluate these effects, each datum was assigned to one of the nine climatically-consistent spatial regions of the contiguous US identified by the NOAA National Centers for Environmental Information [17]. Since Hawaii and Alaska were not included among these nine regions, each was assigned its own eponymous region, bringing the total number of regions to 11. In several of the figures, each state's region is color-coded to visualize how key trends cluster by region. Figure 1 shows regions used in the analysis and serves as a key for colors used in the other figures.

Figure 1. Eleven US regions utilized in the analysis.
Download figure:
Standard image High-resolution imageWe also calculate the 'dominant MMS' for each state. The dominant MMS is simply the MMS that was used by the most farms in each state in each year of the study period. Note that our reports of dominant MMS are meant to highlight and visualize macro-level MMS trends. Dominant MMS datapoints were not incorporated into any statistical calculation reported in this paper, which instead used the percent use of each individual MMS in each state in each year of the study.
2.3. Statistical methods
The full dataset was imported into STATA 15 software [18], which was used for all statistical analyses. The average, standard deviation, coefficient of variation (CV), and percent change were calculated by state across the 12 years of data for each variable of interest. Average annual values for 2003–2014 and percent change between 2003 and 2014 were computed for key variables by state, which is not done in EPA analyses. Pearson correlations were used to evaluate both time-series trends for single variables, as well as correlations between pairs of key variables, with r and p values reported in the tables and figures. Where datapoints indicate state-level averages, these average values (as opposed to each state in each year) are used in the correlations.
To evaluate whether the rate of change in one variable had outpaced the rate of change in another (for example, absolute emissions versus milk production), scatter plots comparing the percent change of the variables of interest between 2003 and 2014 in each state were produced, with y = x (shown as a dashed gray line) plotted to indicate equal growth in both variables. We then overlay the linear correlation calculated from the data (shown as a dashed black line). Wherever the slope of the linear correlation line is greater than the y = x reference line, this indicates that the y data generally grew more rapidly than the x data over the study period (and vice-versa).
For bar plots comparing 2003 to 2014, states are organized by percent change. All error bars in the scatter and bar plots represent standard deviations. ESRI ArcGIS Pro 2.0.0 software [19] was used to generate spatial visualizations, showing both average values and percent change.
3. Results
3.1. Change in absolute emissions and emission intensity
We find that both absolute GHG emissions from dairy manure (total CO2e), as well as emission intensity as a function of milk production (CO2e/kg of milk), increased significantly (p = 0.0003 and 0.0085, respectively) between 2003 and 2014 (figure 2). Absolute GHG emissions rose by 43% over this period, while GHG emission intensity rose by 18%, primarily as a result of CH4 emission intensity, which increased significantly (p = 0.0035), while the N2O emission intensity did not significantly increase (p = 0.2749).

Figure 2. Absolute US GHG emissions (left) and emission intensity (right) from dairy manure between 2003–2014, including CH4, N2O, and total emissions (CH4 + N2O).
Download figure:
Standard image High-resolution imageWe find notable regional variation in GHG emission intensity, with overall higher per-kg emissions in Western states compared to Eastern states. However, despite having lower average emission intensities, we find greater levels of increase in Midwest and Eastern states over the study period (figure 3).
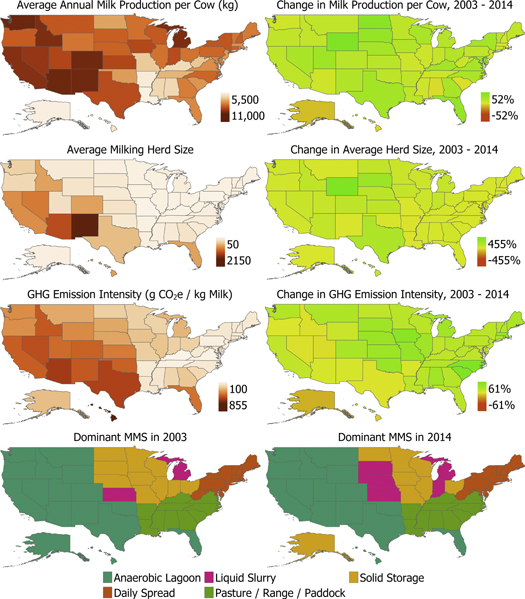
Figure 3. State-level averages across all years in the study period (left column, top three rows) and change over time between 2003 and 2014 (right column, top three rows) for key production variables as well as GHG emission intensity from dairy manure. Bottom row shows the dominant (highest percent use) of MMS by state in 2003 and 2014. See supplementary table 1 for data table, available online at stacks.iop.org/ERC/1/075003/mmedia.
Download figure:
Standard image High-resolution image3.2. Trends in US dairy production
During 2003–2014, overall US dairy milking cow inventory increased by 1.9%, while average milking herd size grew by 9.6%, and total milk production increased by 21.0% (supplementary figure 1). However, there were strong regional trends, with 18 states—largely clustered in Western regions—seeing increases in cow inventory, while the remaining states saw reductions (supplementary figure 2). Likewise, while overall herd sizes have increased on average, Rhode Island, Arkansas, and Louisiana have seen decreasing herd sizes (supplementary figure 3). Finally, while there has been an increase in milk production nationally, growth has generally been the most dramatic in West North Central states, whereas several South/Southeast states have experienced decreased production (supplementary figure 3).
We find that state-level change in milking cow inventory is significantly (p < 0.0001) and positively correlated to change in milk production, with 24 states reporting lower production in 2014 than in 2003, and 26 states reporting higher production (figure 4). Importantly, milk production increases outpaced milking cow inventory increases in all but four states (Alaska, Hawaii, Alabama, and South Carolina), with eight states (New York, Virginia, Minnesota, Nebraska, Georgia, Pennsylvania, Vermont, and Florida) reporting increased production despite decreases in milking cow inventory. Finally, several West North Central states including South Dakota and Wyoming have seen significant increases in cow numbers, coupled with even larger increases in milk production. These trends suggest that productivity-enhancing management practices (i.e. genetic selection, feed efficiency) may have been implemented widely, with an average cow producing 18.7% more milk in 2014 compared to 2003.

Figure 4. Correlation of change in milk production to change in dairy cow inventory, 2003–2014. Dashed gray line indicates the expected correlation (y = x), while dashed black line indicates the observed linear correlation. States in the upper left quadrant are those that both decreased cow inventory and increased milk production (NY, VA, MN, NE, GA, PA, VT, FL). Colors correspond to climactic regions presented in figure 1.
Download figure:
Standard image High-resolution image3.3. Impact of climate on dairy production
Others have explored the relationship of temperature (e.g [20–22]) and precipitation (e.g [23]) on per-cow productivity, and our results confirm these existing findings. We find that both average temperature and especially precipitation are significantly (p = 0.0477 and p < 0.0001 respectively) negatively correlated with productivity (supplementary figure 4). This indicates that milking cows are generally more productive in cooler and drier states compared to warmer and wetter states, although overly-cold climates do appear to limit production efficiency to some extent.
3.4. Impact of climate on emissions
Given that temperature is an arithmetical component of the CH4 calculation utilized by the EPA, it is not surprising that CH4 emission intensity is positively correlated with a state's average annual temperature (although this correlation is weakly significant; p = 0.0647). However, since N2O emission intensity is negatively correlated with temperature (p = 0.0007), overall GHG emission intensity (CO2e from both CH4 and N2O) does not significantly correlate with temperature according to our data (p = 0.1659). In contrast, a state's annual precipitation is significantly negatively correlated with both CH4, N2O, and overall emissions intensities (p = 0.0241, 0.0103, and 0.0158 respectively).
The variability (CV) of annual temperature and precipitation over the study period was highly regional, with temperature being most variable in East North Central, Central, and Northeast states, while precipitation variability was highest in the West, Southwest, South, and Hawaii (supplementary figure 5). Our data show that states with higher precipitation variability had significantly higher CO2e emission intensities (p = 0.0008), while temperature variability had less of an impact (p = 0.1138). Somewhat concerning, the two highest-producing states also had the most variable climates, with California experiencing the highest level of precipitation variability, and Wisconsin the highest temperature variability.
3.5. Correlation of dairy production to emissions
Overall, there is a statistically significant (p < 0.0001) positive trend between changes in milk production and changes in absolute CO2e emissions from dairy manure (figure 5). In most states, emissions increased modestly more than would be expected based on the change in milk production. However, several North Central states—especially Nebraska, Iowa, and South Dakota—show significantly higher increases in GHG emissions than would be expected based on their production increases. Further, some states, notably the Carolinas, report decreased milk production coupled with increased GHG emissions between 2003 and 2014. Only six states (Alaska, Hawaii, Utah, Nevada, Idaho, and Texas) had a slower rate of change in GHG emissions than milk production.
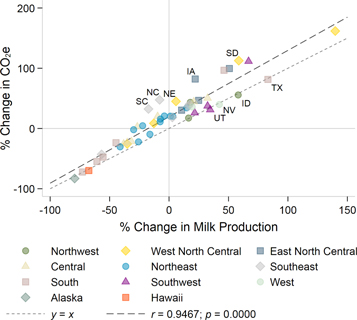
Figure 5. Correlation of change in absolute GHG emissions from dairy manure to change in milk production, 2003–2014. Dashed gray line indicates the expected correlation (y = x), while dashed black line indicates the calculated linear correlation. Colors correspond to climactic regions presented in figure 1.
Download figure:
Standard image High-resolution image3.6. Spatial distribution of MMS use
Overall, our data indicate that the dominant type of MMS (i.e., the MMS that was used most often in each state) is highly regionally specific with a few exceptions (figure 3, bottom row; supplementary figure 6). In the Northwest, West, and Southwest, all states utilized anaerobic lagoons as the dominant strategy. The use of pasture/range/paddock is dominant in the Southeast and some Central and South states. In the Northeast, daily spreading is the dominant strategy, while the East North Central and Central states generally used solid storage. West North Central states showed a more diverse split between anaerobic lagoon, liquid slurry, and solid storage as a dominant MMS strategy. Finally, we note that—while the spatial distribution remained relatively stable over the study period—liquid slurry has supplanted solid storage as the dominant strategy in several West North Central and Central states.
3.7. Correlation of MMS use to production and climate factors
We find that the percent of farms using each MMS by state is significantly correlated to both management and production variables, as well as to climatological variables (table 3; supplementary figure 7). Both liquid slurry and anaerobic lagoons are significantly (p < 0.0001) and positively correlated with increased per-cow productivity, and anaerobic lagoons are also significantly associated with higher average herd sizes (p < 0.0001). Conversely, the other four strategies (pasture/range/paddock, daily spread, solid storage, and deep pit) were all negatively correlated with per-cow productivity and average herd size. Both average annual temperature and average annual precipitation were frequently associated with MMS choice, with pasture significantly correlated with warmer and wetter places (likely due to the necessity of long and productive growing seasons), daily spread associated with cooler and wetter places, and the remaining strategies frequently correlated with cooler and/or drier places.
Table 3. Pearson correlations between percent use of each MMS and key production/climate variables.
|
Note: Gray backgrounds indicate significance at the 0.01 level. Green backgrounds indicate positive correlations, while reds and oranges indicate negative correlations.
3.8. Correlation of MMS use to emissions
We also find a significant correlation of MMS use with GHG emissions, with higher rates of pasture/range/paddock (p = 0.0004) and daily spread (p < 0.0001) significantly correlated with decreased GHG emission intensity. Conversely, increased use of liquid slurry (p = 0.0005) and anaerobic lagoons (p < 0.0001) is significantly correlated with an increase in GHG emission intensity (figure 6). While this finding can largely be attributed to the EPA calculation methods described above—for example the differences in MCF across each MMS—our analysis also explores regional clustering of MMS use, which is clearly visible in figure 6. GHG emission intensity from manure is a function of both the type of MMS and the local climate, and therefore the environmental impact of a farmer's MMS will vary by region. Clearly, complex relationships exist between farmer decision-making, local production norms, climate, and ecological externalities.
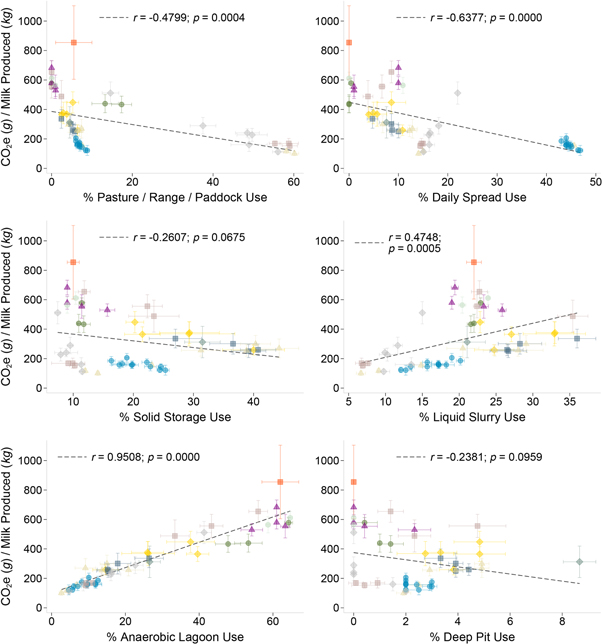
Figure 6. Correlation of GHG emission intensity from dairy manure to percent MMS use by state, averaged across the 12 years of the study. Liquid slurry and anaerobic lagoon use is significantly and positively correlated with an increase in GHG intensity, while pasture/range/paddock and daily spread are significantly correlated with a decrease in GHG intensity. Colors correspond to climatic regions presented in figure 1.
Download figure:
Standard image High-resolution image3.9. Change in MMS use
Nationally, there have been key shifts in the type of MMS used during the study period, with solid storage, daily spread, pasture/range/paddock, and deep pit showing declining use; while anaerobic lagoon and liquid slurry show increasing use (table 4, supplementary figure 8).
Table 4. Change in national MMS use from 2003 to 2014, with Pearson correlation statistics.
|
Note: '% Use' refers to the percent of farms using each MMS. National-level statistics were calculated by weighting state-level statistics according to production volume. Gray backgrounds indicate significance at the 0.01 level. Green backgrounds indicate positive correlations, while reds and oranges indicate negative correlations.
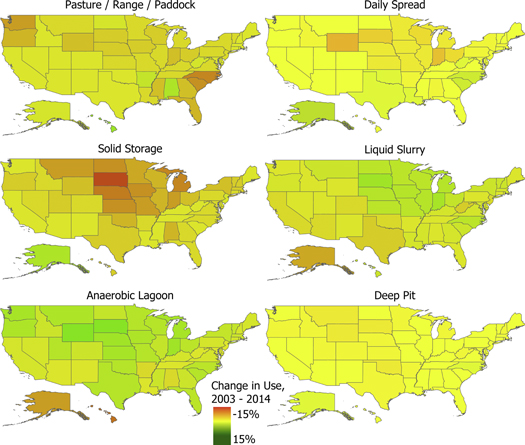
Despite strong national trends, we find notable regional variability in changes to MMS use (figure 7). While pasture/range/paddock use is down nationally, it is especially reduced in the Southeast and Pacific Northwest, with South Carolina reporting the greatest decrease (7%), and Alabama the greatest increase (6%). The use of daily spread is most prominently reduced in West, East North Central, and Central states, with Wyoming reporting the greatest decrease (6%), and North Carolina the greatest increase (7%). The use of solid storage is down in most states, with South Dakota reporting the greatest decrease (14%), and Alaska the greatest increase (6%). Conversely, liquid slurry use has increased, especially in the West and East North Central and Central States, with South Dakota reporting the greatest increase (8%), and Alaska the greatest decrease (5%). Deep pit use, albeit the least used MMS, has remained relatively consistent. Finally, anaerobic lagoons have seen the greatest growth, with both Wyoming and South Dakota reporting a 13% increase in its use, and Alaska reporting the greatest decrease (6%).
Figure 7. Change in percent use of each MMS by state between 2003 and 2014. See supplementary table 2 for data table.
Download figure:
Standard image High-resolution image
4. Discussion
4.1. Key findings
This research set out to explore the trends over time in absolute GHG emissions and GHG intensity related to manure in the US dairy sector over a recent 12 year period, and to understand these changes in the context of production, climate, and MMS use. Our results demonstrate three key findings that are important for the future productivity and sustainability of the US dairy industry, as well as some potential implications of these results for achieving environmental outcomes for GHG emissions and water quality, which we detail below.
First, we find a trend of increased absolute manure-derived GHG emissions (43%), despite the national cow inventory increasing by only 1.9%, and production volume by 21%. This means that manure-derived GHG intensity (per kg milk) increased by 18% over the study period. Simultaneously though, production per-cow has increased by 18.7%, and farms' average herd sizes have increased by nearly 10% nationwide. While these production indicators are positive, we find that efficiency gains are often correlated with manure GHG emission intensity. Even accounting for increased production per cow, manure GHG emissions per kg of milk continue to rise.
Second, in our exploration of both climate and MMS strategies, we find that temperature is (not surprisingly, given its role in the EPA estimates) positively correlated with CH4 emissions, although it is only weakly correlated with manure emission increases overall. Meanwhile, precipitation quantity is negatively correlated with overall emissions, whereas variability of precipitation is positively correlated with emissions, an observation that warrants further investigation. These findings suggest that the location of a dairy farm often influences both management/MMS decisions, as well as the emission intensities of the farm, as has been previously explored in other literature indicating that warmer temperatures can drive methanogenesis, resulting in increased CH4 production [24].
Finally, we find clear trends in MMS and manure GHG emissions, frequently at regional levels. There has been a significant increase in the adoption of liquid slurry and anaerobic lagoon systems, which are positively related to higher per-cow productivity, larger herd sizes, and lower labor costs than solid storage systems; but can also generate more GHGs. All four other MMS strategies are on the decline nationally, and are also generally correlated with decreased productivity, cow-herd sizes, and manure GHG emissions. These results are consistent with what others have found: for example, [25] noted that liquid systems were most common on larger Wisconsin farms, and [26] found liquid systems to be most common among larger dairy farms in Canada. Both liquid and anaerobic systems allow flexibility in manure spreading and management, but also require significant fixed costs for implementation. Several studies have noted that larger farms have greater capacity for large-scale financial investment into MMS change than small farms [27–29].
Shifts in MMS use help to explain the overall increase in manure GHG emissions within the dairy industry, as both increasingly-adopted strategies (liquid slurry and anaerobic lagoon systems) are correlated with higher manure GHG emission intensity. This is consistent with existing data indicating that the use of liquid systems and anaerobic lagoons—especially without processing and long storage times—contribute the greatest amount of GHG emissions [24, 25].
4.2. Potential drivers of shifts in MMS use
Of course, a critical question to ask about these trends is why is this shift occurring? A recent review exploring dairy farmer decision-making as it relates to manure management suggests that there are myriad factors that influence these outcomes [30]. Our data suggest that the shift towards liquid slurry and anaerobic lagoons may be occurring as farmers increase their herd sizes and productivity. Manure management strategies can significantly influence the ability of a farmer to expand their scale, as certain strategies may not be compatible with larger herds [31]. A desire to increase herd sizes may have occurred as a result of fluctuating milk commodity prices. In 2003, the US average price of milk/kg—based on average monthly milk prices—was $0.25; by 2014, the price was $0.47/kg [32]. Variability in milk prices during this time period, as well as a general trend towards increased payouts, is potentially a key driver for the shift towards larger herd sizes, which may require a shift in MMS. Importantly, the average price of milk/kg dropped back to $0.32 as of 2018, demonstrating the significant downward trend in farm-gate price, and the potential implications this has for trends in MMS use.
It is also worth noting that farmers may have shifted their MMS because of state and federal-level policy goals for water quality, to comply with or possibly 'get in front of' pending water quality regulations. Winter manure spreading can increase loss of phosphorus through runoff [33], and has been a growing focus of concern throughout the United States. Liquid storage systems offer farmers the opportunity to store manure longer and manage their application dates and timing. A recent review of global manure spreading bans and policies highlights the heterogeneity across the United States on these policies. Some states—for example Maine and Vermont—have implemented complete bans on winter manure spreading [34, 35], while twenty-six other states have manure spreading regulations that are stricter for larger farm operations than small. The policy focus on such regulations—particularly for large farms—may have resulted in farmers shifting towards longer-term storage options. This presents a clear dilemma for both dairy farmers and regulators: for what environmental outcome are we pursuing on-farm regulations? Water quality regulations would incentivize farmers to shift towards liquid storage and other long-term storage options, which enable spreading during optimal times to minimize water quality impacts. However, our findings indicate that regulations and policies geared towards minimizing GHG emissions would incentivize and encourage farmers to shift away from these systems. When policies and regulations have competing environmental agendas, prioritization of MMS at the farm level becomes complex and challenging. There are critical tradeoffs in managing nutrients and other environmental externalities from dairy farming that may result in competing policy agendas and priorities, rendering 'win-win' scenarios difficult.
4.3. Comprehensive strategies to promote environmentally sustainable MMS choices
Given that climate change and water quality goals may work at cross-purposes regarding MMS use, identifying solutions that enable farmers to minimize their GHG emissions while also considering water quality becomes an important point of discussion. Here we highlight several potential strategies.
A focus on regions and farms utilizing liquid slurry and anaerobic systems could be useful to reduce GHG emissions while also promoting systems that enable manure storage that can assist with water quality goals: technologies exist to reduce GHG emissions from liquid and anaerobic systems, providing a clear pathway. The development of natural and artificial crusts or other covers for manure lagoons has demonstrated a potential GHG emission reduction of up to 20% [9]. Wooden covers can reduce CH4 emissions more than a natural crust, though may have the potential to increase N2O emissions [36]. Manure acidification is another option for reducing emissions in liquid and anaerobic systems [37], with one recent study finding a 68% reduction [38]. Manure aeration or temperature reductions can also offer GHG mitigation opportunities [8], potentially up to 20% [9]. Liquid-solid separation also offers potential benefits for reusing solids in animal bedding [39], as well as curbing emissions from manure application by reducing degradable C in the manure applied to the soil, and as a consequence the potential for nitrification and N2O emissions [8]. While anaerobic lagoons are the dominant strategy in many warmer parts of the United States, their expansion into the Upper Midwest, as shown through this study, does offer some potential promise for minimizing CH4 emissions as compared to warmer places. Greenhouse gases, especially CH4, are reduced in cold temperatures in exterior storage facilities [40, 41]. Emptying a manure lagoon in the spring—before warmer temperatures begin—represents another opportunity to reduce GHG emissions in liquid systems [36, 42].
Another potential opportunity to minimize GHG emissions in liquid and lagoon systems is the use of anaerobic digesters [8], potentially avoiding up to 80% of the CH4 emissions that would have otherwise occurred [9]. Data from multiple studies consistently show that anaerobic digesters can significantly reduce GHG emissions in manure systems as a result of avoided CH4 emissions from manure digestion, as well as electricity production from fossil fuels [43, 44]; however, different types of digesters, management systems, and feedstocks influence the magnitude of these reductions. Further, most systems require a sizable outlay of capital, and cost has been consistently cited as one of the major barriers to digester adoption [45]. Lacking financial support, this strategy may simply not be a viable option for most farmers, particularly considering milk price volatility.
Given the potential of digesters and other innovations in liquid and lagoon manure management to mitigate emissions, a focus on farms utilizing liquid and anaerobic systems—which are generally already realizing productivity gains—may represent a path forward. At least some data suggest that larger and more productive dairy farms are more likely to adopt a new MMS. For example, a survey of Louisiana dairy farmers found that the largest and most efficient farms were most likely to adopt capital intensive MMS, including anaerobic digesters [46]. A survey of New York dairy farmers further affirms the idea that larger farms are most interested in anaerobic digestion [47]. Despite their potential, adoption of these technologies remains low—only 265 livestock anaerobic digesters exist in the United States [48]—suggesting that a greater focus on barriers to adoption of these manure management innovations may be prudent.
A second opportunity to reduce dairy manure GHG emissions could also come from a focus on MMS that are inherently correlated with reduced GHG emissions, including the use of pasture, daily spreading, and solid storage, albeit some of these may be limited by climate or on-farm management, and may also come with tradeoffs for productivity and water quality. This pathway may be particularly effective for farmers who have historically used these strategies, as it is unlikely that a farmer who has invested in a capital-intensive liquid or anaerobic system will switch to one of these MMS. Nevertheless, for farmers currently employing these systems, their continued use could help to minimize increases in dairy manure GHG emissions in the future. However, given their correlation with a reduction in productivity potential, and their climatological requirements (i.e. pasture requiring a long growing season), this may be relevant only in some contexts. Further, many of these strategies don't allow the level of manure storage and flexibility of application that larger, liquid systems do. Once again, this highlights the complex tradeoffs between management decisions, climate, GHG emissions, and state or regional water quality goals.
4.4. Directions for future research
One important additional implication of our results is a particular need for farmer-centered social science research as it relates to dairy manure management. Understanding the reasons behind why farmers choose certain MMS—especially across all US regions—will be critical to understand the potential ways in which farmers could be supported in their MMS adoption choices. Thus far, our scientific understanding of MMS has largely focused on the technical potential for MMS strategies to reduce GHG emissions. For example, in several comprehensive reviews on the topic (e.g [8]) hundreds of studies are cited, which have explored the GHG emissions and other environmental outcomes of varying MMS strategies for decades. Yet, there is, to our knowledge, only one comprehensive review, with only 36 studies, to understand why dairy farmers make MMS adoption decisions [30]. Thus, while the existing technical focus has been critical to establish how the environmental impacts vary among MMS, a shift in focus to farmer decision-making and behavior may be the next critical step in understanding the drivers of on-farm behaviors and decisions as it relates to MMS. Further, our work also suggests that there is a critical need to understand the policy and regulatory drivers that might also influence on-farm decisions related to MMS, particularly since different priorities could lead to adoption of varying MMS at the farm level.
4.5. Limitations of the study
While national in scope and comprehensive across the study period, there are several limitations of this study, which largely derive from the data sources. Several considerations exist regarding the methods used by the EPA to calculate emissions resulting from dairy farming. Firstly—although USDA NASS and other survey data provide a foundation—the EPA reports relied upon best estimates in some cases. For example, MMS use among small farms was estimated by the EPA's Office of Water based on site visits and qualitative input from key state contacts. Similarly, the use of daily spread and pasture/range/paddock systems were estimated based on communications with personnel from NRCS offices, state extension service records, and extrapolation to the national level of MMS use distributions within New York State, as found by Cornell University researchers. Thus, generally speaking, while these data are among the best available, they still rely on a series of estimates, which should be acknowledged when interpreting our results. Further qualitative and/or survey research into what MMS are actually used at dairy farms would significantly improve the academic understanding of this topic.
A second potential limitation of the EPA methods arises from simplifying assumptions necessary to apply the arithmetic. For example, the methane conversion factor calculations—while based on IPCC guidelines—assign each state to one of only three temperature categories (cool, temperate, or warm), and do not incorporate temperature differences within a given state. Further, nitrous oxide emission factor calculations are based on IPCC default values, and do not account for aspects such as varying annual precipitation that can impact runoff and leaching rates. The EPA calculations also assume that each farm uses only one MMS, accounting neither for complex interaction effects resulting from the use of multiple overlapping systems, or the use of alternative systems that do not correspond to one of the six standardized MMS classifications.
Finally, it is worth noting that the EPA estimates do not take into account adoption of best management practices and technologies at the individual farm level. Rather, the implementation of an MMS assumes that strategy according to its definition, without use of many of the best management practices that we've outlined in this discussion. For example, these data would not consider whether a farmer was using a cover on their lagoon, which would likely result in reduced emissions. Thus, it may be the case that some of these emissions data are overestimated by not considering the adoption of emerging GHG mitigation strategies in the industry.
5. Conclusion
This US-level analysis of MMS and their correlation to varying productivity, climate, and dairy manure GHG emission outcomes explores the tradeoffs between these factors, and suggests some of the potential mechanisms behind MMS adoption choices. Our results demonstrate the challenges of understanding how and why farmers manage their manure systems as they do, and what compromises exist in those decisions. We find that there is an overall increase in dairy manure GHG emissions intensity that correlates with a shift towards increased use of liquid and anaerobic MMS, especially in certain regions. However, these systems are also associated with greater productivity and larger herds. As well, some of these MMS systems may provide greater flexibility for farmers to manage their manure for longer periods of time, which can provide benefits for water quality, as farmers have greater flexibility in applying manure. Thus, our results suggest that no single MMS will universally confer benefits across the many factors that farmers must grapple with in their decision-making spanning economic, environmental, animal welfare, and societal considerations. Despite this, we highlight that many new advancements in technology provide opportunities to reduce manure GHG emissions in liquid and anaerobic systems, which may be a pathway for some farmers, particularly larger farms that have capital to invest and/or access to financing. Meanwhile, maintaining lower-impact MMS systems such as pasture and solid storage may be an effective way for smaller farms to mitigate their GHG footprints, but this could come with water quality tradeoffs. We suggest that our results provide a clear pathway for future research that aims to more completely explore the tradeoffs in MMS, particularly at the level of farmer decision-making.