
Abstract
In pump/probe spectroscopy employing supercontinuum (SC) probe light (Pr), multi-wavelength information is provided at the same time. The SC probe generated by a photonic crystal fiber is advantageous owing to the broad spectrum and synchronized timings of the SC Pr pulse and pump pulse. However, SC light accompanies formidable wavelength dependent noise due to the various contributions of generation mechanisms. We previously developed two noise cancellation methodologies suitable for multiwavelength measurements with SC light, that is, phase detection noise cancellation (PDNC) and time division noise cancellation (TDNC), where the pulse timings for Pr and reference (Rf) are time-shifted and detected by a single photodiode (PD) after passing through the common optical system, providing an identical spectral dispersion to conserve the wavelength-dependent noise correlation. In PDNC, Pr and Rf are discriminated based on the pulse repetition phase, and the Pr is then divided by Rf, whereas in TDNC they are distinguished by the detection time, and Rf is subtracted from Pr. However, a shot noise limited performance with high-power input has yet to be realized. In this study, the deterioration mechanisms for PDNC and TDNC are investigated. The nonlinear effect of the photodetector was found to have a non-negligible impact on the phase noise and intensity noise correlation between Pr and Rf. Adequate decay of the photocurrent of Pr at the detection of the Rf optical pulse is effective for avoiding nonlinearity and maintaining the noise correlation of Pr and Rf for the best noise cancellation. Based on this fact, a near-shot-noise-limited performance is demonstrated by the TDNC, where the Rf optical pulse is incident on the PD after sufficient relaxation of the Pr photocurrent. In addition, the coincidence of the timing of Pr and Rf for the noise subtraction was found to be essential for wideband noise cancellation.
Export citation and abstract BibTeX RIS

Original content from this work may be used under the terms of the Creative Commons Attribution 4.0 licence. Any further distribution of this work must maintain attribution to the author(s) and the title of the work, journal citation and DOI.
1. Introduction and objective
In a pump/probe measurement, a sample is excited by the pump light (Pu), and the stimulus on the sample is detected using the probe light (Pr). Here, white Pr and a multi-wavelength detection through the spectral dispersion allow spectral pump/probe measurements. Although a supercontinuum (SC) light source with a highly nonlinear photonic crystal fiber (PCF) [1] is readily available for white Pr, the intensity noise of the SC light is generally formidable. The present study focuses on noise-cancellation techniques for the multi-wavelength measurement of spectrally dispersed SC Pr.
This research is motivated by the development of stimulated Raman spectroscopy (SRS) with multi-wavelength detection. Measurements of the stimulated Raman effect are categorized in the pump/probe measurement, where at least two light pulses at different wavenumbers are irradiated at the same position of the sample. When the difference in the wavenumber matches the wavenumber of a molecular vibration mode, a photon of a higher wavenumber is annihilated, whereas the counterpart photon is generated based on the stimulated Raman effect [2]. The result is sensitively measured through a lock-in detection of either photons serving as Pr, whereas the intensity of the counterpart is modulated as Pu. The signal-to-noise ratio (S/N) of SRS is enhanced by approximately three orders of magnitude compared to that of conventional spontaneous Raman spectroscopy [3] under typical measurement conditions. SRS is frequently employed in molecular imaging applications for biomedical imaging [4–6], polymer material texture imaging [7], and other imaging types [8].
The wavelength conversion of the light source using the PCF is a simple and relatively low-cost solution for the preparation of plural pulsed lights at different wavelengths. The synchronization of the pulse emission timings of Pu and Pr is readily obtained using a single light source [9–12]. Furthermore, wideband wavelength conversion is possible [1, 13]. Multi-channel lock-in detection after spectral dispersion of the SC Pr enables a one-shot spectral measurement without wavelength scanning [9]. However, these advantages are obtained at the expense of abundant noise [14, 15].
The intensity of Pr through the sample is given by the following:

where P and δP are the average power and noise of Pr, respectively. The stimulus on the sample using Pu appears as the intensity modulation (m) of Pr, and generally, m ≪ 1. Here, the noise of Pr dominates the S/N. For instance, when δP is 10−4 with a given observation bandwidth, S/N is unity for m = 10−4, which is a typical modulation depth in SRS microscopy.
The origins of δP are identified as shot noise and dynamical fluctuations of the light source state. The shot noise is a quantum nature of the photon and determines the principle of the maximum S/N. The shot noise current (ish) is given by the following:

where q, S, and B are the elemental charge, responsibility of the employed photodetector, and detection bandwidth, respectively. Therefore, the S/N determined by the shot noise (S/Nsh) is

It can be seen that S/Nsh is improved with a high average power of the light source.
The noise due to the dynamical fluctuation of the light source is canceled by subtracting the noise component in the reference light (Rf) from that in Pr [16–18]. This simple subtraction, however, does not cancel the noise of the white Pr for the multi-wavelength measurement. Because the noise differs among the wavelengths covered by the multi-channel detectors [19, 20], the observation center wavelength and wavelength bandwidth must be identical for Pr and Rf; otherwise, the noise correlation of Pr and Rf is disturbed, and hence the noise in Pr cannot be properly canceled through a simple subtraction. We developed two noise-cancellation techniques to fulfill this requirement: time-division noise cancellation (TDNC) and phase-detection noise cancellation (PDNC).
The outline of the optics system is shown in figure 1. A portion of a pulsed optical beam from a light source is coupled to the PCF and is converted into a white pulsed beam. The white pulse is split into Pr and Rf after the polarization of the white pulse is fixed by a polarizer (P). This stabilization of the polarization is essential because the polarization of the white pulse fluctuates, whereas the splitting ratio depends on the polarization. If P is not inserted, the noise correlation between Pr and Rf is disturbed. Rf undergoes a delay [21] of a half or quarter cycle of the pulse repetition through an additional optical path for TDNC or PDNC, respectively. The path length is ∼2 or ∼1 m for a pulse repetition frequency of 76 MHz. The counterpart from the light source is employed as Pu. The pulse arrival time of Pu in the sample is adjusted to match that of Pr. Pu undergoes intensity modulation for a lock-in detection. Then, Pr, Rf, and Pu are spatially overlapped and irradiated on the sample. The intensity of the Pr is modulated, reflecting the stimulus on the sample. Then, Pr and Rf are spectrally dispersed together using a single spectrograph (SP). A spectral component is input to a noise-canceling detector, and the noise-canceled result is lock-in detected. With both techniques, Pr and Rf are commonly detected using a single photodetector, which enables an identical spectral dispersion by a single SP. The center wavelength and wavelength bandwidth for a detection channel are the same for Pr and Rf. This feature is advantageous for conservation of the noise correlation between Pr and Rf.

Figure 1. Optics system for present noise-cancellation technique. Here, PCF is photonic crystal fiber used to generate a white pulse beam; P is a polarizer to eliminate the polarization fluctuation of the white beam to stabilize the optical splitting ratio in the subsequent optics; Pu, Pr, and Rf are the pump, probe, and reference pulsed beams, respectively; APD is an avalanche photodiode; and SP is a spectrograph.
Download figure:
Standard image High-resolution imageIn TDNC, the Pr and Rf pulses are distinguishably detected by a photodiode (PD) interfacing a high-speed transimpedance amplifier (TIA) (figure 2(a)). The detected pulses are discriminated based on the time, and the intensity noise in the Rf pulse is subtracted from that in Pr [22]. However, for the response speed of the TIA required to distinguish the Pr and Rf pulses, thermal noise overwhelms the shot noise. The thermal noise effect is mitigated by multiplication of the photocurrent in an avalanche photodiode (APD), accompanied by excess noise during multiplication. In our previous study [22], the performance achieved was 2.8 × 10⁻⁵ Hz−1/2 in terms of modulation equivalent noise density (MEND) in the Pr with an average input power of 0.26 μW. The shot noise was estimated to be 1.6 × 10⁻⁶ Hz−1/2, where the responsibility of the employed APD at unity multiplication factor was 0.45 A W−1. The experimental results indicate further room for improvement of ∼25 dB. However, the recent advance in the gain-band product frequency (fGBP ) of the operational amplifiers (op-amps) offers an acceptable tradeoff between the thermal noise and response speed for microwatt detection with APD. For example, the fGBP of the op-amp employed in the previous study [22] was 240 MHz, whereas that in this study was 8 GHz. This is a 33-times advancement in reducing the thermal noise for the same response speed, and there is still further room for investigation.
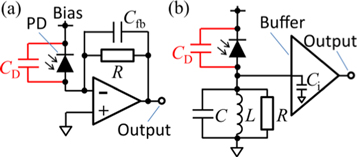
Figure 2. Photodetectors based on transimpedance amplifier (a) and resonant load (b). (a) PD is a photodiode, CD is the junction capacitance of PD, and Cfb is the phase compensation capacitance to stabilize the feedback loop. (b) C, L, and R are external capacitance, inductance, and resistance for parallel resonant load interfacing PD, respectively, and Ci is the input capacitance of the buffering amplifier.
Download figure:
Standard image High-resolution imageFor PDNC, figures 3(a) and (b) show the complex amplitudes of Pr and Rf at the pulse repetition frequency. The horizontal arrow indicates the Pr amplitude. The upward arrow is the Rf amplitude whose phase is shifted by π/2 through the delay of the quarter-cycle of the pulse repetition. When the Pr intensity is modulated by the sample response (figure 3(a)), the intensity modulation is translated into the phase modulation of the superposition of Pr and Rf (broken arrow). At the same time, the phase is unresponsive to the intensity noise because the intensity noises on Pr and Rf are parallel (figure 3(b)). Therefore, the S/N is improved in the phase detection of the overlap of Pr and Rf. Here, the overlapped signal functions as the phase carrier. Note that PDNC requires a frequency band of only around the pulse repetition frequency and is adaptive to a resonant photodetector (figure 2(b)). If the same op-amps are employed for the TIA and resonant photodetectors, the latter is advantageous for suppressing the thermal noise effect with a large resistance [22–25]. This configuration also does not suffer from the noise amplification effect that emerges in the TIA topology [23]. Therefore, in a previous study [22], a superior performance was demonstrated with the resonant photodetector than with the TIA-photodetector. With a 0.26-μW optical input power, MEND was 1.0 × 10⁻⁵ Hz−1/2, and the separation from the shot noise was reduced to ∼16 dB. Note that the separation was due to the excess noise in the multiplication in the APD, not the thermal noise. However, when the input power was further increased [26], the performance was further separate from the shot-noise limited performance despite the lower magnification factor. MEND was ∼5 × 10⁻⁶ Hz−1/2 with an average input power of 3 μW, while the shot noise was estimated to be 4.9 × 10⁻⁷ Hz−1/2. The experimental results indicate that the room improvement deteriorated to ∼20 dB.

Figure 3. The amplitudes of the probe and reference pulses on a complex plane showing the phase detection noise cancellation procedure. (a) The intensity modulation of Pr owing to a sample measurement (from blue to light blue arrows) causes a phase modulation of the overlapped carrier signal (broken arrow) of Pr and Rf. (b) Optical source noise common in Pr and Rf leaves the phase of the carrier signal intact.
Download figure:
Standard image High-resolution imageTherefore, for a low-power optical input (∼0.1 μW), PDNC adaptive to a resonant photodetector with a high resonant impedance is advantageous. The cancellation performance, however, does not improve proportionally with a high-power input. By contrast, as the incident power increases, TDNC with a direct observation of pulses with TIA may achieve a higher performance because the thermal noise effect is relatively hindered. To reduce the contribution of shot noise, which determines the principle limit, it is important to improve the noise cancellation performance with high power. Further, the noise-cancellation performance in our previous study was evaluated with only a few tens hertz band around a center frequency of a few kilo-hertz, and the wide band noise cancellation performance required for high-speed detection remains to be evaluated. In this study, for a wide band shot noise limited performance with a high power input, performance deterioration mechanisms are researched with wide band noise spectra for PDNC with resonant photodetectors. In addition, based on the findings in the aforementioned investigation, a near-shot-noise-limited performance is demonstrated by TDNC with a TIA of a modern high-speed op-amp. To the best of our knowledge, this is the best noise cancellation result of highly noisy SC light of ∼μW. For further a high-power input and wide-band noise cancellation for a rapid pump/probe measurement, the emerging limiting factors are also discussed, and countermeasures are provided.
2. Operation principle and feature
Although the implementations were described in previous studies [22, 26, 27], the authors assumed only ideal conditions. Let us describe the implementations for noise cancellation, as well as the merits and demerits in TDNC and PDNC related to the explicitly expressed response of the photodetector, which is not always ideal. For both TDNC and PDNC, the Pr and Rf optical pulses of the average amplitude of A and the fluctuation of Ak are assumed to be trains of the Dirac delta function for simplicity [26]. The Pr and Rf are given through the following:

where a and b are the splitting ratios for Pr and Rf (a + b = 1), which are determined by optics. In addition, T and T' are the pulse repetition cycle and delay for Rf, respectively, and δ(x) is Dirac's delta function. When these pulses are observed, the pulse output timing from the optical input has been found to depend on the incident power [28]. Therefore, when the response of the photodetector is linear and time invariant, and is expressed by G(t), the detected signal is as follows:

where τp,k and τr,k are the timing deviations. Here, G(t) = 0 for t < 0 (causality), and

2.1. TDNC
A block diagram of TDNC is shown in figure 4(a). In TDNC, T' is set to T/2. The Pr and Rf pulses appear alternatively every half cycle (figure 4(b)). The pulses are discriminated in terms of time using a fast switch synchronous to the pulse repetition. The detected signal is then discriminated using a high-speed switch, such as a diode switch. The discriminated Rf signal (the second term of equation (5)) is subtracted from the Pr signal (the first term) after the weight for the Rf signal is equated using an electrical circuit. This operation is equal to the multiplication of a rectangular wave with an offset of (b −a)/(a + b) (figure 4(b)), that is,
Here, l is a natural number. An adjustment of the offset is possible with feedback control based on the final result (see the supplemental material for the TDNC circuity available online at stacks.iop.org/JPCO/4/125009/mmedia). In general, a measured value is the time average of the observed physical quantity. For example, the integration time is determined as the time constant in the lock-in detection, bandwidth in the spectrum analysis, and so on. The time average of equation (7) over τ = nT + t' (0 ≤ t' < T) is given by the following:
where F(t') is the residual term out of the multiple of T, and σ is noise other than light source fluctuation (e.g., shot noise and thermal noise).

Figure 4. (a) Block diagram of the time-division noise canceler, (b) red, orange, and purple lines indicate the output waveform of the trans-impedance amplifier with a half-cycle optical delay, switching waveform with an offset, and a multiplied result, respectively. (a) Sync. indicates a synchronous signal of the light source pulse repetition, ϕ is a phase shifter to adjust the switching timing, VGA is a variable gain amplifier to adjust the weight for Rf, and LPF is a low-pass filter for the time average.
Download figure:
Standard image High-resolution imageHere, the response speed of the photodetector is sufficiently fast to relax within T/2, that is,

and equation (8) is as follows:

The first term is the signal of the sample, and Al functions as the multiplicative noise. The additive noises in Pr and Rf are cancelled by each other. By setting τ sufficiently larger than T, the residual contribution by the final term is diminished. Note that under the condition of equation (9), the pulse timing jitter has no effect on the output. The TDNC is robust to jitter (τp,k , τr,k ) caused by the photodetector and subsequent electrical circuity.
When the response speed of the photodetector is slow compared to the pulse repetition, however, the signal component (line 1 in equation (8)) is also cancelled. Assuming that an extreme case of G(t) is nearly constant and a = b, the signal disappears. Therefore, a high-speed photodetector that is sufficient to observe an optical pulse is preferred for TDNC. However, the response speed and the thermal noise of the TIA are in a trade-off relation imposed by resistance (R) in the feedback loop. The 3-dB cutoff frequency is given by the following:

where fGBP, CD, Ci, and Cfb are the gain-bandwidth product of an employed op-amp, the junction capacitance of the PD, the input capacitance of the op-amp, and the phase-compensation capacitor used to stabilize the feedback in TIA (details of the response are given in the supplemental material for TIA) [29], respectively. Meanwhile, the thermal noise current (ith) is determined as follows:

where k, B, and T are the Boltzmann constant, frequency bandwidth, and absolute temperature, respectively. The S/N for the thermal noise (S/Nth) is given by the following:

Therefore, an increase in R improves the S/N while limiting the response speed. Moreover, TIA exhibits a noise amplification effect for the voltage noise of the op-amp owing to a reduction in the feedback ratio at high frequencies [29].
2.2. PDNC
In PDNC, T' is set to T/4. The block diagram for the PDNC is shown in figure 5. In general, during the phase detection, a phase reference signal is multiplied, and the result is time-averaged. In our PDNC, the synchronous signal (Sync.) to the pulse repetition is employed as the phase reference, and the phase of Sync. is modulated (feedback controlled) to ensure that the multiplied result is nulled. In this way, the phase deviation in the photodetected signal is obtained as the phase control signal for Sync., while the amplitude fluctuation is rejected.
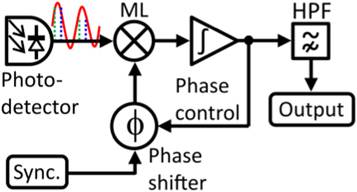
Figure 5. Block diagram of the phase detector. Here, ML is a multiplier, Sync. is the signal synchronous to the pulse repetition of the light source, an HPF is a high-pass filter.
Download figure:
Standard image High-resolution imageAs the dominant merit of PDNC, the required frequency band is only within the vicinity of the repetition frequency. Therefore, we first assume that the response of the photodetector is that of the parallel resonator (figure 2(b)), that is,

where U(t) is the unit step function used to express the causality, and the resonant angular frequency (ω0) and bandwidth, or the Q-value, is given by the following:

respectively. Here, CD and Ci of the buffering amplifier contribute to the capacitance in the resonator. The detected signal is as follows:

where Fk = 0(t) is a residual term of k = 0, and
The Sync. is

and the multiplied result of a low-frequency component is the following:

where ωc is the pulse repetition angular frequency. Note that Fk = 0(t) is omitted because it varies rapidly and contributes little to the low-frequency component. In the feedback phase modulation of Sync., this output is integrated with time. Because ϕ(t) is controlled to ensure that this result is zero, equation (19) nearly converges to zero. Therefore,

where

and n is an integer used to ensure that

Therefore,

The term ψk (m) is the phase modulation owing to the sample response to be measured. We found that a convolution of the jitter by A'k (t) additively affects ψk (m), and Lk (t;ω') is a cause of the intensity noise leak. Here, by adjusting ω' to ωc , Lk (t;ω') is nulled. That is,

However, the effect of jitter is not rejected. Further, if τp,k and τr,k are zero, ak and bk are independent of k, i.e.,

and when ∣m∣ ≪ 1 and b' is close to a,

where

Therefore, the intensity of the noise is clearly cancelled with the resonant photodetector if τp,k and τr,k are zero. Because a large R is permitted independently of the pulse repetition frequency, the thermal noise effect is suppressed with a large R. However, the demerits are sensitive to both the resonant frequency and timing jitter. The resonant frequency shift causes an intensity noise leak, and the jitter directly causes phase noise.
Second, let us consider the TIA-photodetector for PDNC. We assume a response of

In this case, G(t) is expanded using a Fourier series, as follows:

where

The components in the photodetected signal in the vicinity of the fundamental component are given by the following:

for kT ≤ t < (k + 1)T, where

and

The low-frequency component in the multiplied result of the photodetected signal and the phase reference signal is given by

where 〈f〉τ is the time average over τ in the integral feedback control. Therefore, through the feedback control of ϕ(t),
where b is close to a, and ∣m∣, ∣ωc τp,k ∣, ∣ωc τr,k ∣ ≪ 1 are assumed for the approximation. Therefore, in addition to the TIA-photodetector, the amplitude noise is cancelled. Similar to equation (23), the performance is sensitive to jitter, although the amplitude noise is rejected independently of the form of the response function.
3. Experimental operation
3.1. Optics
Figure 1 shows the optics system and principal elements, and the details of the elements are described in the supplemental material. The laser employed was a titanium sapphire (Ti:Sa) laser emitting an optical pulse with a 2.5 ps duration at 802 nm. The pulse repetition frequency was 76.35 MHz. The pulse was split into a Pr branch and Pu branch, although Pu was not used in this study. The pulse in the Pr branch was coupled with a 1-m long PCF (NL-2.3-790-2, THORLABS), and converted into a white pulse. The Rf was delayed for a quarter or half cycle of the pulse repetition through an additional optical path of 98 or 196 cm in length for PDNC or TDNC, respectively, and spatially overlapped on the Pr path. In the present study, the sample was not installed, and Pr and Rf were directly input into a spectrograph (M25-TP, Bunkoukeiki) through a multimode optical fiber. The wavelength component of the 650-nm center and 1.3-nm width was guided to the photodetector on the noise canceler. The average power of the component was in microwatts. An APD was employed as the photodetecting element to secure an adequate S/N for this level of power regarding the thermal noise. The output from the noise canceler was recorded using a spectrum analyzer (DSA815-TG, Rigol).
3.2. Experimental setup for PDNC
Here, the principal parts are described. The details of the circuit diagram are described in the supplementary material.
3.2.1. Photodetector with resonant load
The photocurrent from the APD was converted into a voltage signal by the resonant circuit composed of a parallel connected capacitor, inductor, and resistor (figure 2(b)). The equipped APD was a KPDA100P-8H (Kyosemi), and its CD and sensitivity at a 650-nm wavelength with a unity multiplication factor were 5.5 pF and 0.4 A W−1, respectively. A toroidal inductor was used (the core was T25-12, Amidon). The stray inductance and capacitance must be accounted for by tuning the resonant frequency. The stray inductance originated in the wiring, and the stray capacitance was from CD of APD and Ci of the buffering amplifier, among other sources. The resonant frequency was tuned using a variable capacitor. The reverse bias for the APD, which determined the multiplication factor, was feedback-controlled such that the average output level was constant. The output of the resonator was buffered by a voltage follower of the op-amp (ADA4717, Analog Devices).
To measure the phase dependence of the optical input power, the pairing of the externally soldered inductance and resistance was set at 120 nH and 10 kΩ, 120 nH and infinity, or 235 nH and infinity, respectively, where infinity indicates that no resistor was inserted. For an evaluation of the noise cancellation, 235 nH and 10 kΩ were used. Note that the energy loss in the actual elements served as the resistance even when no external resistor was soldered.
3.2.2. Photodetector with transimpedance amplifier
To investigate and eliminate the effect of the amplitude noise leak owing to the resonant frequency shift (the third term in equation (23)), we also employed the TIA-photodetector. The outline of the circuit is shown in figure 2(a). The details are provided in the supplementary material. The installed APD was S12051 (Hamamatsu), and its CD was 2 pF. The sensitivity at the unity multiplication factor was 0.35 A W−1 at a wavelength of 650 nm. The op-amp was an OPA855 (Texas Instruments), of which fGBP was 8 GHz. In addition, R was set at 10 or 20 kΩ. The reverse bias for the APD was feedback-controlled based on the direct current (DC) component in the output.
3.3. Experimental operation for PDNC
The static output-phase-dependence of the resonant photodetector on the optical input power was investigated in relation to the resonant frequency dependency on the power. The stable intensity of the pulse train emitted from the Ti:Sa laser was incident on the photodetector. The resonant frequency was tuned such that the output amplitude was maximized at an input of 2 μW. The output phase was observed at the DC level before the HPF, as shown in figure 5. The output was calibrated using 76.35 MHz Sync. and a phase-modulated carrier signal generated by a function generator (FG) (DG4162, Rigol). The phase modulation frequency and depth were set at 20 kHz and 1°, respectively.
The noise spectrum of Pr at 650 nm was measured with a TIA-photodetector and spectrum analyzer. The value of R of the TIA was set at 10 kΩ, and the observation bandwidth of the spectrum analyzer was 10 kHz. The optical input power was adjusted to 1 μW using a variable neutral density filter (VND) before guiding the multimode fiber on the spectrograph.
The dependence of the PDNC on the optical input power was evaluated using a resonant photodetector. The optical power ratio of Pr to Rf was fixed at unity. The Pr and Rf powers were adjusted using VND. Hereafter, the optical power indicates the sum of the Pr and Rf powers. The resonator was tuned to ensure that the noise leveled off in a low-frequency region for an optical input power of 1 μW. This tuning was left intact for other optical input powers.
The relative gain of the detector was measured using a spectrum analyzer to calibrate the performance with the resonant photodetector in terms of the gain dependence on the frequency. The bias for the APD was fixed, and intensity-modulated continuous-wave laser light was input. The laser was homemade based on a commercially available laser diode (LM-101-A2, Wen Tai Enterprise), and its intensity was externally modulated. The average power was set to 1 μW. A tracking generator on the spectrum analyzer generated the modulation waveform. The raw noise spectra for PDNC were corrected to the modulation equivalent value for Pr. This correction is based on the aforementioned calibration of the phase detector and the frequency dependence of the resonant photodetector.
The PDNC was also investigated using a TIA-photodetector. The output waveforms of the photodetector were recorded using an oscilloscope (DPO4104B, Tektronix). The optical input power for the waveform measurements was 1 μW.
3.4. Experimental setup for TDNC
A TIA-photodetector with 10 kΩ R used for PDNC was employed to detect the Pr and Rf pulses. The block diagram of the noise canceller is shown in figure 4(a). For the detailed circuity of the TDNC, see the supplemental material. Although a low-pass filter (LPF) for the multiplied result through the switching discrimination and subsequent subtraction was not required in principle because it was effectively time-averaged in the spectrum analyzer, the harmonic component of the pulse repetition was rejected by the LPF to secure the dynamic range of the spectrum analyzer. This LPF was the seventh cascade of the first-order 66 MHz LPF, and the 3-dB cutoff frequency was 25 MHz.
3.5. Experimental operation for TDNC
The output waveform from the TIA-photodetector was recorded using an oscilloscope. The output noise spectra of various optical input powers from the noise canceler were then recorded using a spectrum analyzer with a 10-kHz observation bandwidth. The power ratio of Pr and Rf was fixed at 1:1, and the sum of the power was adjusted using VND. The noise spectra obtained were calibrated to MEND according to the noise spectrum at a 1-μW input of Pr and a MEND of 4.02 × 10⁻⁵ Hz−1/2 of Pr, as mentioned later.
4. Results and discussion for PDNC
Figure 6 shows the output dependence of the resonant photodetector on the optical input power. The values were normalized to zero at a 2-μW input. The phases were retarded in a larger input power with all of the resonant parameters, where the retardation was more sensitive with a larger R and L. The output phase is described with the parameters of the resonant load as follows:

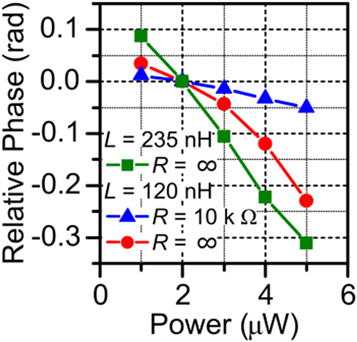
Figure 6. Output phase dependence on the optical input power of the resonant photodetector. The values of L and R in the legend indicate the inductance and resistance of the external elements. The infinity value of R indicates that no external resistor was set.
Download figure:
Standard image High-resolution imageThe fact that the phase shift was more prominent with a larger R supports the change in the resonant parameter. The sensitivity enhancement in parallel with L in the phase shift indicates that the major origin is an increase in the CD of the APD because its contribution to the capacitance of the resonator increases in the tuning. The increase in CD for a high-power optical input was also observed in prior research [30]. This deviation of CD is translated into a resonant-frequency shift.
The optimal resonant frequency (equation (24)) is essential for achieving the best performance. Therefore, the parameter dependence on the input power requires an optimization of ω0 at any time along with the average input power. This explanation resumes a static and constant pulse intensity. In an actual situation, however, the intensity fluctuates. In addition, the aforementioned results are based on the input of only the Pr pulse. In the actual case, Pr and Rf, where the input timing shifts, are input. If Pr influences the gain (magnitude of bk in equation (17)) and phase (τr,k ) of Rf, this effect also adds the phase noise of the carrier. A dynamic effect should be taken into account for a precise investigation of the deterioration factors in PDNC.
Therefore, noise spectra with the inputs of Pr and Rf of a white pulse were evaluated. Figure 7(a) shows the normalized noise spectrum of Pr. The peak at 76.35 MHz is the fundamental component of the pulse train, and the flat baseline is the noise floor. The noise floor was horizontal and constant within the bandwidth of the TIA. The relative intensity noise was −47.9 dBc with an observation bandwidth of 10 kHz. This value was converted into a modulation equivalent noise density (MEND) of 4.02 × 10⁻⁵ Hz−1/2. This value indicates a 35% relative standard deviation of a pulse-to-pulse fluctuation. The gain curve of the resonant photodetector for PDNC is shown in figure 7(b). This curve is explained well by the Lorenz curve for the ideal parallel resonant circuit, and the 3-dB bandwidth was estimated to be 1.125 MHz.
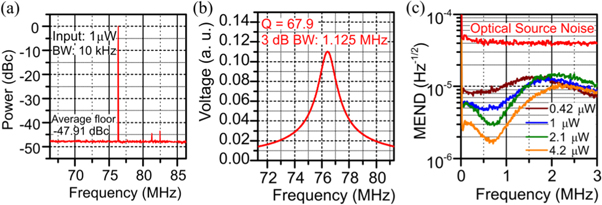
Figure 7. (a) Normalized optical light source noise spectrum, (b) gain curve of the resonant photodetector, and (c) modulation-equivalent noise spectra with the present phase-detection noise cancellation. (a) BW is the observation bandwidth, and the peek at 76.35 MHz is the fundamental component of the light source. (c) MEND is the modulation equivalent noise density of the probe light. The spectra are corrected with the gain curve (figure (b)) and a phase modulated signal from a function generator.
Download figure:
Standard image High-resolution imageThe noise spectra with the PDNC are shown in figure 7(c). A valley structure formed, and its position shifted with the input power. The dip also moved when C was changed (not shown), which this indicates that the frequency for effective noise cancellation depends on the resonant frequency. The power dependence of the dip position was related to the static resonant frequency shift owing to the CD change. The results also show that the shot-noise-limited performance cannot be achieved even when the bottom frequency of the valley is adjusted through engineering the resonant parameters. For a 1-μW input, for instance, the minimum noise was ∼5 × 10⁻⁶ Hz−1/2, whereas the shot noise was estimated as 8.9 × 10⁻⁷ Hz−1/2 for the 0.4 A W−1 sensitivity of the present APD. The obstacle to the shot-noise-limited performance was considered to be the dynamical fluctuation of the CD and/or jitter of the photocurrent; that is, the convoluted effect (caused by Ak '(t) in equation (23)) of the fluctuation of ω0 (fluctuation of Lk (t)) and/or output timing disturbance of the Pr and Rf photocurrents (the second term) cause the phase noise. The analysis of these effects on the noise spectra is interlaced and complicated.
Therefore, to eliminate the effect of Lk (t) and the convolution effect of the jitter over one period, a TIA-photodetector with a shortened relaxation time within one cycle of the pulse repetition was employed. The output waveforms with 10 and 20 kΩ Rs are plotted in figure 8(a). The peaks of the Pr and Rf output pulses are distinguished with both Rs, whereas the Rf-pulse height-ratio was more extensive with 20 kΩ R. This fact indicates that the Rf optical pulse is input when the Pr photocurrent output is less relaxed with 20 kΩ R than with 10 kΩ R.
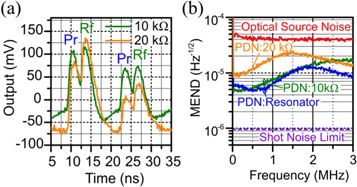
Figure 8. (a) Output waveforms of the trans-impedance amplifiers and (b) noise spectra of 1-μW average optical input (sum of the probe and reference lights). (a) The 'Pr' and 'Rf' mark the probe and reference pulses, respectively. The legend indicates the feedback resistance. (b) MEND is the modulation equivalent noise density of the probe light. The curves marked by PDN:10kΩ and 20 kΩ show the results of the phase-detection noise cancellation with a feedback resistance of 10 kΩ and 20 kΩ for the trans-impedance amplifiers, respectively. The result in figure 7(c) is redisplayed as the blue curve of PDNC for a resonator.
Download figure:
Standard image High-resolution imageFigure 8(b) shows the noise spectra of PDNC with a 1-μW input. Contrary to the dictation by equation (35), the performance depended on the response speed. The amount of noise with the 10 k Ω R was less abundant than that of the 20 kΩ R. From this result, it can be inferred that there is non-negligible nonlinearity concerning jitters of the Pr and Rf pulses. There is also the possibility of a nonlinearity in the correlation of the photocurrent intensities, which is expressed by the pulse-to-pulse fluctuation of a and b (note the fourth term in equation (35)). Prior studies [30, 31] have also referred to reductions in the response speed and quantum efficiency owing to an abundant photocurrent. Less disturbance was due to less nonlinear effects with a faster relaxation. Note that the minimum noise of the TIA-photodetector with 10 kΩ R was similar to that of the resonant photodetector. Therefore, the disturbance in one cycle of the pulse train dominated the performance; the nonlinearity by the nearest pulse in the time domain is critical in the performance. One can expect that the amount of noise cancellation will be modified with a rapid relaxation with a smaller R. In this way, however, one must compromise the thermal noise performance.
In our previous study, [28] another countermeasure was described. This method is based on the correlation of the phase noise with the intensity noise. The phase of the Sync. was modulated based on the intensity noise used to cancel the phase noise correlated with the intensity noise. This phase noise cancellation functions well for a TIA-photodetector, whereas it will not work for the resonant photodetector. In the TIA-photodetector, the phase and intensity fluctuations are determined commonly in one cycle of the pulse repetition, and the correlation of the fluctuations will be secured. Therefore, pulse-to-pulse modulation of ϕ(t) by − [ωc (τp,k + τr,k )/2 + tan−1(ak − bk )] based on Ak can cancel the phase noise (equation (35)). By contrast, the phase fluctuation in the resonant photodetector is a convolution of the jitters by Ak exp(−ζω0 T), whereas the intensity noise is that of Ak by exp(−ζω0 T) (equation (23)). The difference in the convolution weights for the phase and intensity noises destroys the correlation in the noises. Instead of executing the previous countermeasure against the phase noise with the TIA-photodetector compromising the thermal noise effect, in the following, let us investigate a more straightforward way to avoid the nonlinear effect of jitter and the responsibility of APD.
5. TDNC
TDNC is robust against the jitter problem. Further, T' is set at the half-cycle of the pulse repetition rather than the quarter cycle to serve as an adequate time margin for the relaxation of the Pr photocurrent. The correlation in the Pr and Rf noises is expected to be conserved under a situation in which the Rf optical pulse inputs after the Pr photocurrent sufficiently relax to avoid a nonlinear effect.
5.1. Results and discussion for TDNC
The output waveform with a 1-μW average input is shown in figure 9(a). The pulse signals of Pr and Rf separately appeared and mostly did not overlap in the time domain. It can be verified that the Pr pulse sufficiently decayed at the input of the Rf pulse. The blue plot in figure 10(a) is the noise spectrum for TDNC with a 1-μW input. The shot-noise-limited performance (broken violet line) is 9.56 × 10⁻⁷ Hz−1/2, based on the responsibility of 0.35 AW−1. One can find that the optical source noise (the red plot) was canceled out to ∼1.6-times of the shot-noise-limited performance in a low-frequency region below 1 MHz. The power dependence of the noise spectra is shown in figure 10(b). The amount of noise was reduced in the higher power input. However, a bump, as one can recognize on the plot of the 5-μW input, appeared when the input power was more than ∼2 μW. The average noise from the 0.2–1 MHz region is plotted in figure 10(c). From these data, one can consider that a near-shot-noise-limited performance was achieved from an optical input of 0.6 to 2 μW. Therefore, an adequate time margin for the Pr pulse until decay was effective in maintaining the intensity noise correlation of Pr and Rf. Note that TDNC is also robust to jitter of the pulse signals compared to PDNC because switching is in principle insensitive to the time drift in the half-cycle of the pulse repetition. Because the output timing of the photocurrent pulse is affected by the optical input power [28, 31], this robustness also contributes to the performance.
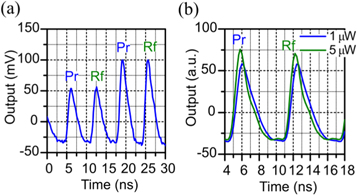
Figure 9. Output waveforms of the trans-impedance amplifier with the half-cycle optical delay for the reference beam. (a) Average input power of 1 μW and (b) average of 512 waveforms for 1 μW and 5 μW inputs.
Download figure:
Standard image High-resolution image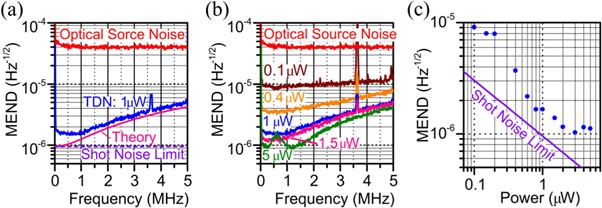
Figure 10. (a), (b) Modulation equivalent noise density spectra with the present time-division noise cancellation, and (b) optical input power dependency of noise. MEND is the modulation equivalent noise density for Pr. (a) The blue curve indicates MEND with a 1-μW optical input. 'Theory' is the calculated MEND based on the degradation mechanism owing to the reference signal delay. (b) Dependence of MEND on optical input power. The spike at 3.6 MHz is external noise. (c) The plotted values are the averaged MEND within the range of 0.2 to 1 MHz.
Download figure:
Standard image High-resolution image
The origin of the deterioration in the low-power region (figure 10(c)) is considered to be the excessive noise of the APD [32]. However, the estimated MEND with an interpolation at an input of 0.26 μW was ∼5 × 10⁻⁶ Hz−1/2. This value is a 6-dB modification from the previous study [22] because of the larger R and smaller excess noise with reduced multiplication factor of APD. The value of R can be increased to 10 kΩ from 510 Ω relying on the present high-speed op-amp. In the high-power region, the bump is accounted for by the degradation and limits of the dynamic range. Prior studies in [30] and [31] demonstrated that a high power input resulted in a slow response speed because of the space-charge effect in the depletion layer. Thus, abundant photogenerated charges were left in the prolonged decay over the half cycle of the pulse repetition owing to the high-power input. When the optical pulse is input under this situation, its quantum efficiency is adversely influenced by a carrier recombination [30]. The gain for the optical pulse after an intense optical pulse is diminished by this mechanism. The input power dependency of the 512 averaged waveforms shown in figure 9(b) support this mechanism. With a 1-μW input, Pr and Rf pulses were identical, whereas at 5 μW, the gain for the Rf pulse was clearly reduced. The difference in τp,k and τr,k was not prominent compared in gain. Therefore, the intensity noise fluctuates the space-charge effect and results in a disturbance against the ratio of gains for Pr and Rf. The fluctuation of the gain ratio destroys the correlation between the noises of Pr and Rf. It may be practical to reduce the incident light intensity per unit area against this deterioration mechanism [31, 33]. One can optically divide the Pr and Rf lights after the sample using a fiber bundle and detect them with the same photodetectors. The detected signals are then merged for processing. Another way is to employ a large area PD. Although CD increases in parallel with the light-receiving area, it can be compensated in the bootstrapping topology [29, 34–36].
The deterioration of the noise cancellation can be seen within a high-frequency region (figures 10(a) and (b)). For a fast measurement, a wideband noise cancellation is desirable. Let us calculate the noise power spectral density (PSD) to investigate the degradation mechanism. Herein, we assume an infinite response speed of the photodetector and that no jitter is induced. In this case, the photodetected signal is the same as in equation (4). PDS is calculated based on the difference between the first and second terms in equation (4) (see supplemental material). When Ak is white noise, as displayed in figure 7(a), the PSD is given by the following:

where LPF(ω), s2, σ2, and σ'2 are the response of the LPF; the variance of the pulse intensity; noise before the LPF, including shot noise; and noise after the LPF, respectively. Therefore, for the best performance within the low-frequency region, a and b should be equal to 1/2. In this case, one can also see that the optical source noise leaks with a factor of sin2(ωT'/2) as ω increases.
The theoretical curve for the 1-μW input predicted by equation (37) is drawn by the pink line in figure 10(a). In the theoretical calculation, σ2 was assumed to be the shot noise of the 1-μW input, and the ant T' value was the half-cycle delay. The term σ' 2 was ignored. It can be seen that the experimental result supports well the theoretical curve and deterioration mechanism of T'. Therefore, the deterioration in the high-frequency region was caused not by the nonlinearity but by a timing mismatch in the Pr and Rf pulses (T') because equation (37) assumes a linear time-invariant system. It is preferable that T' be as small as possible for wideband noise cancellation. Here, if T' is shrunken by shortening the optical delay, there is a tradeoff between the noise leak owing to T' and the conservation of the noise correlation. Instead, one can delay the Pr signal after separation in the circuity. This delay is readily provided electronically with a coaxial cable or a passive delay line circuity. When the Pr signal is delayed by T', the optical source noise other than the shot noise is canceled independently of the probing frequency. To reduce the shot noise contribution, enhancing the dynamic range and expanding the noise cancellation bandwidth is essential for a fast measurement with a high-power light source [37, 38]. We will verify the effectiveness of the discussed countermeasures in the near future.
6. Conclusions
The performance-limiting factors were investigated using a resonant photodetector and TIA-photodetector for PDNC. In the case of the resonant photodetector, the static CD dependence on the optical intensity was found to cause a deviation of the optimal parameter setting for the resonator. Even under the optimal conditions, the dynamical CD fluctuation and photocurrent jitter responding to the pulse-to-pulse intensity swing induced a phase noise and deteriorated the noise-cancellation performance. To investigate the pulse-to-pulse jitter effect apart from the parameters of the resonator, the PDNC performance was also evaluated using the fast TIA-photodetector, in which the photocurrent decayed within one cycle of the pulse repetition. From the results, it can be inferred that the disturbance in the one-cycle ratio of the Pr and Rf photocurrent intensities and/or output delays dominated the phase noise. The performance was modified with a shorter relaxation time of the photodetector, where Rf was input after a sufficient decay of the Pr photocurrent. The nonlinear effects owing to the space charge effect and a quantum efficiency reduction in the photodetector were found to have a non-negligible impact on the performance. In other words, the gain and output delay for Pr and Rf were conserved at the same level when the interval of the inputs was sufficiently long for the photocurrent to decay and avoid nonlinear effects.
Based on these findings, to maintain the intensity noise correlation between Pr and Rf, the delay for Rf was set at the half-cycle of the pulse repetition, which was the maximum delay to avoid the nonlinear effect between Pr and Rf. TDNC was applied for this optics configuration. The near-shot-noise-limited performance was demonstrated within the low-frequency region. However, the performance deteriorated for a high-power input. It may be effective to reduce the optical intensity per unit area for a PD with multiple photodetectors after optical splitting or a large-area PD interfacing the bootstrap circuity. In addition, the delay for the Rf signal from the Pr induced an intensity noise leak within the high-frequency region. The passive delay element in the Pr signal branch after the discrimination of Pr and Rf is able to compensate for the delay effect. We believe that these countermeasures for the present TDNC enable spectral pump/probe measurements of a high-dynamic range and wide bandwidth using a high-power SC-light source.
Acknowledgments
This study was financially supported by JSPS KAKENHI, Grant No. JP17K18145.