
Abstract
Neutron Compton scattering and neutron diffraction, augmented by ab initio modelling, have been applied for the characterisation of disorder in molybdate glasses, 20MoO3 + 30Nd2O3 + 50B2O3, 40MoO3 + 30Nd2O3 + 30B2O3, and 50MoO3 + 25Nd2O3 + 25B2O3, along with their parent metal oxides, B2O3, MoO3 and Nd2O3. Softening of the atom-projected vibrational densities of states (apVDOSes) was observed for all constituent nuclei in the metal oxide systems, with respect to the ab initio harmonic lattice dynamics predictions. For the oxygen, the mode softening was attributed to force-constant disorder, and for the boron to the isotopic mass disorder. A universal scale of disorder in oxide glasses has been proposed. The scale relies on the assumption that the amount of disorder-induced phonon softening can be bracketed by two extreme situations: (i) a completely disordered system with no confining potential whose momentum distribution is described by the Maxwell-Boltzmann momentum, and (ii) the compositional average of harmonic lattice dynamics predictions for individual metal oxide systems. The highest degree of disorder on this scale was observed for the boron in the molybdate glasses with the highest amount of B2O3. The distributions of total (summed over all nuclei) effective force constants were found to be at least an order of magnitude wider than their counterparts calculated for the parent metal oxide systems, indicating a much greater degree of positional disorder-induced force constant disorder in the molybdate glasses. The sum of all mean effective forces acting on all constituent nuclei in the molybdates was found to be decreasing with the increasing amount of the glass-former B2O3, clearly showing a systematic softening of the structure of the glasses. The biggest contributions to the total average effective mean force in all three molybdates were found for the molybdenum and neodymium.
Export citation and abstract BibTeX RIS

Original content from this work may be used under the terms of the Creative Commons Attribution 4.0 licence. Any further distribution of this work must maintain attribution to the author(s) and the title of the work, journal citation and DOI.
1. Introduction
Rare-earth (RE) molybdates display diverse and exciting chemistry. Molybdate phases are known to exhibit a great variety of important physical properties, including high ion and electron conductivity [1–4], nonlinear optical response and luminescent properties [5–7], catalytic activity [8–11], and magnetism [12–15]. This plethora of properties renders molybdate glasses attractive for engineering towards tailored advanced multifunctional devices. In contrast to the most molybdates with relatively well-characterised crystalline and magnetic structures, the atomic structural information on amorphous molybdate systems is not well understood due to the lack of data of sufficient quality from spectroscopic and diffraction experiments [16–18]. The main reasons behind this difficulty are a high degree of chemical, positional and force-constant disorder on the one hand and quite a low number of experiments globally investigating the properties of these materials on the other [19].
The information content inferred from the studies of disordered systems can be improved by concurrently applying diffraction and spectroscopic methods and augmenting them with modelling to follow the dynamical and structural properties simultaneously [20–23]. To this end, we have recently performed neutron- and x-ray diffraction measurements combined with Reverse Monte Carlo modelling to calculate partial atomic pair correlation functions, nearest neighbour distances and coordination number distributions in many amorphous molybdate systems [19, 24–27].
The usual choice in materials characterisation by means of neutron spectroscopic tools is to resort to the inelastic neutron scattering (INS) spectroscopy, as a robust, selection rule-free tool for the vibrational mode assignment [28]. However, in systems where long-range order is absent (alloys, glasses), the prospects for performing precise phonon work may be very limited. In such systems, phonon dispersion curves are challenging to characterise due to the presence of positional, mass and force-constant disorder, leading to a substantial broadening of phonon dispersion relations, and consequently, the broadening of atom-projected partial vibrational densities of states (apVDOSes) [29]. In such cases, Neutron Compton scattering (NCS) may become an interesting alternative. Crucially, owing to the neutron energy and momentum transfer values that are two orders of magnitude larger than those used in the INS, NCS effectively probes nuclear quantum dynamics and nuclear binding potentials locally, at the scale of a fraction of an Angstrom [30–33], thereby naturally complementing the information about local structure inferred from diffraction augmented by the reverse Monte Carlo (RMC) analysis. Additionally, NCS can be termed as a mass-spectroscopic technique as it yields mass-resolved information about the distributions of the components of momenta of target nuclei along the direction of the neutron momentum transfer [30–33]. In an NCS spectrum, these momentum distributions manifest themselves as Doppler broadening of individual recoil peaks, each for every constituent isotopic species [30–33]. Theoretically, the amount of Doppler broadening of each peak can be related to the Boltzmann-population factor-weighted first-moment of its apVDOS [30–33]. Thus, the NCS technique not only provides a natural 'headcount' of different isotopic species, by integrating their respective peaks, but it can also account for the local environment-induced modifications of the apVDOSes in a mass-resolved manner, a feature indispensable in the investigation of disordered systems.
Concurrent employment of neutron diffraction (ND), INS and NCS has already led to a successful characterisation of dynamical and structural properties of Zr–Be binary alloys [23, 34]. Motivated by these recent developments, in the present work, we describe the results of diffraction, augmented by RMC modelling, and NCS measurements on molybdate glasses, as well as NCS measurements on their constituent metal oxides, B2O3, MoO3, and Nd2O3, augmented by ab initio modelling in the framework of the periodic-DFT. In doing so, we provide an additional element of control into the elucidation of structure-dynamics correlations by measuring and modelling the nuclear momentum distributions (NMDs) of oxygen, boron, molybdenum, and neodymium nuclei in the series of molybdates with systematically increasing content of the strongly glass-forming compound, the boron oxide, B2O3. Crucially for the assessment of disorder in both metal oxide systems and molybdates, and for the first time in the NCS literature, we provide a description of the procedure allowing for the direct isotope mass-selective extraction of the magnitudes of the average effective inter-atomic mean forces using values of the nuclear kinetic energies measured in an NCS experiment and the apVDOSes obtained from the ab initio modelling. Moreover, we set up a scale of disorder in oxide glasses based on their phonon properties. The lower end of this scale is set by the prediction of the model assuming no order or confining potential whatsoever, the Maxwell-Boltzmann nuclear momentum distributions for individual nuclei. The upper end of the scale is constructed as a compositional average of the ab initio predictions for the widths of nuclear momentum distributions in the parent metal oxide systems. The position of individual atomic species on the disorder scale is then correlated with the parameters characterising the distributions of the bond length and bond angles obtained from reverse Monte Carlo modelling of neutron diffraction data recorded for the molybdates. Such an approach allows us to relate the structural disorder to changes in nuclear dynamics of complicated micro-heterogenous disordered systems where direct ab initio modelling of nuclear quantum dynamics is beyond computational power of the state-of-the-art high-performance computing.
2. Experimental
2.1. Sample preparation
The parent metal oxide systems (B2O3, MoO3, Nd2O3) were prepared and measured in the form of powder samples. The molybdenum trioxide, MoO3, and neodymium trioxide Nd2O3, of purity of 85% were both obtained from Alfa Aesar, (CAS: 7782-91-4, LOT: 10197920 and CAS 1313-97-9, LOT: M20C022, respectively). The sample of boric oxide, B2O3, of 99% purity was obtained from Sigma-Aldrich (CAS 77704-22-4, LOT: MBBB6704V). In all three cases, the isotopic mass composition corresponded to the natural abundance of all isotopes.
The molybdate glass samples with the nominal compositions of 50MoO3 + 25Nd2O3 + 25B2O3, 40MoO3 + 30Nd2O3 + 30B2O3, 20MoO3 + 30Nd2O3 + 50B2O3 (hereafter referred as Mo50Nd25B25, Mo40Nd30B30 and Mo20Nd30B50) (mol%) were prepared from reagent grade powders (B2O3, MoO3, Nd2O3). The powders were melted in a platinum crucible, under atmospheric conditions at 1200 °C–1300 °C for 30 min. The melted mixture was kept at the melting temperature for two hours, during which the melt was periodically homogenised by mechanical stirring. The melt was quenched by pouring it on a stainless steel plate. B2O3 enriched with 11B isotope (99.6%) was used for all three molybdate glass samples in order to avoid the high neutron absorption cross-section of the 10B isotope and simplify the data analysis.
2.2. Neutron diffraction
Neutron diffraction measurements were performed at the PSD diffractometer (λ0 = 1.068 Å) [12] at the Budapest Neutron Centre and at the 7C2 diffractometer at the LLB-CEA-Saclay (λ0 = 0.726 Å) [35]. The experimental data were simulated by the RMC method using the software package RMC++ [36, 37]. A disordered atomic configuration was built up with a simulation box containing 10 000 atoms. In the calculations, density values of 0.0683, 0.0684 and 0.0692 atoms·Å−3 were used for the Mo50Nd25B25, Mo40Nd30B30 and Mo20Nd30B50 samples, respectively, and the corresponding RMC half-box lengths were 26.353, 26.340 and 26.238 Å. Details of the RMC calculations are presented in Refs. [25, 38]. Atomic configuration figures have been prepared by the 'Confplot' software, which is a part of the RMC++ program package.
2.3. Neutron Compton scattering
NCS experiments were performed at VESUVIO spectrometer at the ISIS neutron and muon spallation source at the STFC Rutherford Appleton Laboratory, Harwell, Oxfordshire, in the UK [39]. The measurements of all three metal oxides and all three molybdate glass samples were carried out at room temperature. The powder samples were placed into flat aluminium cells. The cells were assembled out of two flat (one front and one backside) walls, each of cross-section of 64 square centimetres, fully exposed to the incident VESUVIO neutron beam when placed perpendicular to its direction. The general setup of VESUVIO was described elsewhere [20, 31, 32, 40]. Thus here we will only limit ourselves to mention those few elements of the NCS data acquisition and treatment that are relevant to the systems measured in this work. The mass-resolved NCS spectra, recorded in the neutron time-of-flight (TOF) domain by detectors placed at scattering angles between 130 and 170 degrees (referred to as the backscattering regime), containing the recoil peaks of Mo, Nd, O and B as well as Al from the sample containers, were treated in a protocol detailed in section 1.1. in the Supplementary Material (SM) is available online at stacks.iop.org/JPCO/4/095027/mmedia. The NCS spectra were assumed to consist of recoil peaks with underlying purely Gaussian nuclear momentum distributions (NMDs) with standard deviations σ (hereinafter termed as the widths), as confirmed by the ab initio modelling described in section 2.4 and in section 1.2 of the SM. The number of peaks in each model employed to fit a TOF spectrum recorded at VESUVIO was validated by simulations (for details, see section 1 in the SM). Furthermore, in each case, an additional peak coming from neutrons scattering off an aluminium sample container was accounted for by fitting a separate peak with an underlying Gaussian momentum distribution. The width of the peak was fixed at the value corresponding to a nuclear momentum distribution of aluminium with a standard deviation of 13 Å−1, a value tabulated from a series of calibration experiments performed at VESUVIO for an empty aluminium container.
2.4. Modelling
A detailed account of the modelling procedure is given in section 2 of the SM, and thus here we will concentrate on the points crucial for the analysis of the disorder in the metal oxides considered. Let us start with the remark that NCS has been traditionally termed as a technique capable of measuring nuclear observables relating to the momentum [30–33]. However, it has also been demonstrated that NCS is capable of inferring information about the observables related to the position representation such as atomic root mean square displacements [23, 34, 41]. For any underlying form of the apVDOS of the nucleus under investigation, one can establish a constraint relating the variance of its position and momentum distributions at any temperature T,  and
and  respectively, which can be expressed as
  where
where  and
and  are the plus and minus-first moments of the Boltzmann distribution-weighted apVDOS (for details see equations (6), (12), and (13) in section 2 in the SM). Using this constraint one can calculate the value of an effective interatomic force constant,
  (expressed in units of eV Å−2) of a nucleus of mass M in a system at temperature T:

Equation (1) clearly demonstrates that NCS is capable of inferring the information about the magnitudes of the mean effective interatomic force constants, a feature that has so far been exclusively attributed to techniques yielding atomic root mean square displacements such as diffuse neutron scattering [42–45], Mossbauer spectroscopy [46] and EXAFS [47]. Of course, in a general case, a fair amount of ab initio modelling and experimental validation of the apVDOSes of all nuclei is required. Two important special cases are worth emphasising, however [41, 48–50], Einstein and Debye solid (for details see section 2 in the SM). In the former case, the magnitude of the force constant is rendered temperature independent. In the case of a Debye solid, one obtains an expression that does not have a closed analytical form but the numerical simulation (see figures 4(a)–(d) in the SM) clearly shows that, whereas the dependence on the thermodynamic temperature is very weak, the dependence of the mean force magnitude on the Debye temperature is quadratic. Thus, the magnitude of the mean force is strongly dependant on the high-frequency cut-off of any apVDOS as long as this apVDOS can be well approximated with a Debye model. This is the case of all three metal oxide systems under consideration (see figures 3(a)–(p) in the SM). The high-frequency bands in the apVDOSes of the metal oxide systems contain chiefly local modes of vibration (e.g. stretching modes), with effective masses equal to the masses of the individual nuclei. This observation has important ramifications for the simulation of the effects of isotopic mass disorder on the disorder of the force constants. Namely, one can simulate, within reasonable accuracy, the magnitude of a force constant for a nucleus with isotopic mass m' by performing an ab initio lattice dynamics simulation for a nucleus with mass m and scaling an apVDOS obtained for an isotopic mass m by the factor  as is the case for all local modes of vibration This has been the underlying assumption for the simulations of the NMD widths and magnitudes of force constants in metal oxide systems and molybdates described in subsequent sections of this work.
3. Results and discussion
3.1. Local structure of molybdate glasses from neutron diffraction
In order to set the scene for the discussion of correlations between the local structure and the phonon-related properties in the molybdate glasses under consideration, we present here the results of the RMC analysis of the neutron diffraction data. A good degree of convergence of the RMC simulation towards experimental data has been achieved, as illustrated in figure 1, showing the structure factors, S(Q), obtained from the RMC analysis.

Figure 1. Structure factors, S(Q), obtained from the neutron diffraction in molybdate glasses. Thin, black solid lines (hardly visible due to the overlap with the experimental data) show the RMC-calculated S(Q) curves, and colour symbols show experimental S(Q), for Mo20Nd30B50 (blue), Mo40Nd30B30 (green) and Mo50Nd25B25 (red) and residuals; all shifted vertically for clarity. See text for details.
Download figure:
Standard image High-resolution imageFor all the investigated samples, the Mo–O correlation functions show a sharp peak at an average distance of 1.75 ± 0.02 Å. Additionally, a significantly smaller peak appears at an average distance of 1.95 ± 0.05 Å. Moreover, with a decreasing Mo-content, the intensity of the first-neighbour peak decreases. The observed Mo–O distance is in good agreement with the 1.75(5) Å distance reported for the glassy 90MoO3-10Nd2O3 examined by the EXAFS technique [51]. However, it is lower than in silicate multi-component glasses [52] but shows similarity to the Mo–O 1.73–1.82 Å distances in the crystalline LaBMoO6 [53]. Following the literature, the characteristic peaks present in the Mo–O correlation functions can be attributed to the presence of the MoO4 and MoO6 units. For example, the formation of MoO6 units was observed in a study of glass-forming ability and structure of ZnO–MoO3–P2O5 glasses [54]. The presence of the isolated MoO6 octahedra was detected in the glass with 70 mol% of P2O5. Moreover, in the MoO3-rich and ZnO-rich region, the clustering of MoO6 octahedra was observed, but the formation of Mo–O–Mo bonds was found already in the P2O5-rich glasses containing 60 mol% of P2O5. Chowdari et al [55] in their studies of the Li2O–P2O5–MoO3 glasses came to the conclusion that in the 50P2O5–50MoO3 glass molybdenum forms MoO6 octahedra. Moreover, it was argued that with increasing additions of Li2O the MoO6 octahedra are partly converted into MoO4 tetrahedra [55]. Santagneli et al [56] obtained 95Mo NMR spectra for the investigation of molybdenum coordination in (100−x)NaPO3–xMoO3 glasses and on the basis of chemical shift trends concluded that both MoO6 and MoO4 units are present in these glasses. Based on the models presented in the literature and the analysis of the gMo-O(r) distribution obtained in this work, one can establish that the shorter Mo–O distance of 1.75 Å can be attributed to the MoO4 units, while the longer Mo–O distance of 1.9/2.0 Å to the MoO6 units.
The B–O first-neighbour distributions, obtained from neutron diffraction data in this work, are relatively broad with the average value of the B–O distance of 1.40 ± 0.02 Å and a half-width value of the B–O distance distribution peak of 0.25 Å (see figure 2(a)). Usually, the broad B–O first-neighbour distributions, present in molybdates, can be dissected into the two characteristic distance distributions, centred at ∼1.37 Å and ∼1.47 Å, corresponding to the BO3 and BO4 structural units, respectively [38, 57, 58]. In our case, the r-space resolution of the diffraction experiments is not high enough to resolve them (see figure 2(a)). Thus, in further discussion, a unimodal B–O distribution will be assumed. The B–O coordination number distributions (figure 2(b)) contain both 3- and 4-fold oxygen coordinated boron atoms (the small number of 2-neighbours is probably an artificial effect of the RMC calculations). The average coordination number slightly decreases from 3.3 to 3.1, with increasing boron content. The general observation is that, with increasing boron content, the relative number of BO3 units is increasing, while the number of BO4 is decreasing. However, one has to keep in mind that complex borate glasses cannot be viewed as a simple network built only from BO3 triangles and BO4 tetrahedrons. Usually, they consist of relatively large structural units, such as boroxol, pentaborate, triborate and diborate groups. Figure 3 presents the three-particle bond angle distributions revealed from the final atomic configuration generated by the RMC simulation. In agreement with the results of our work on the Si–Na–B–O system [59], the B–O–B angle distribution peaks at the value of 122 degrees which is close to the BO3 trigonal unit angles (see [23] and references therein) and the O–B–O angle distribution peaks at the value in the region 115–112 degrees which is closer to the ideal tetrahedral angle 109.5 degrees.

Figure 2. B–O characteristic distributions: (a.) partial pair correlations, (b.) coordination number distributions for Mo50Nd25B25 (red), Mo40Nd30B30 (green) and Mo20Nd30B50 (blue). See text for details.
Download figure:
Standard image High-resolution image
Figure 3. Bond-angle distributions for (a.) B–O–B, (b.) O–B–O, (c.) Mo–O–Mo, (d.) O–Mo–O, (e.) B–O–Mo and (f.) O–O–O, for the Mo20 (red), Mo40 (green) and Mo50 (blue) glasses. See text for details.
Download figure:
Standard image High-resolution imageThe Nd–O and the O–O first-neighbour distance distributions, obtained in this work from the pair-correlation functions, gNd-O(r) and gO-O(r), are less accurate than their Mo–O and B–O counterparts due to the fact that both aforementioned distributions partially overlap. In the case of the O–O distance distributions, the whole analysis is even more complicated. The molybdate glass structure is believed to consist of the linkages of the network former units, but all these units are connected via oxygen atoms. Therefore, a wide distribution of O–O distances is present with oxygen atoms of very different origins [25]. In this context, It is worth mentioning that the RMC analysis reveals the statistically most significant O–O distances from the average local structure to which it is sensitive. In this case, the analysis reveals the two O–O distance distributions centred at 2.3 and 2.8(2.9) Å, respectively. In the case of the Nd–O distance distributions, the Nd–O pair correlation function shows a characteristic first neighbour distance at 2.4 Å, and a next one at 2.8/2.9 Å. Here the interpretation is also complicated by the fact that Nd2O3, being not a network former, does not form its own structural units. Instead, the neodymium atoms are connected to the borons and Mo- units through an O atom [25, 60–62].
The Mo–O, B–O, Nd–O and the O–O first-neighbour distances obtained from the RMC analysis are shown in table 1. In order to reflect the fact that, unlike in the case of the B–O, the Mo–O, Nd–O, and O–O partial correlation functions contain both main and smaller secondary peaks, table 1 lists two sets of average first-neighbour atomic distances and their standard deviations for Mo–O, Nd–O, and O–O, and one set for B–O. Interestingly, whereas in the first sets of values, listed for Mo–O, Nd–O, and O–O, distances are constant as a function of the glass composition, the second sets of the distances exhibit changes. The M–O distances decrease as a function of increasing glass-former concentration, whereas the Nd–O and O–O distances increase.
Table 1. First neighbour atomic distances, rij (Å), as obtained from gij(r) calculated by RMC modelling. See text for details.
| rij (Å) | ||||
|---|---|---|---|---|
| Glassy samples | Mo–O (±0.02)/±0.05) | B–O (±0.02) | Nd–O (±0.1)/±0.05) | O–O (±0.1) ±0.05) |
| 50MoO3 + 25Nd2O3 + 25B2O3 | 1.75/2.00 | 1.43 | 2.4/2.8 | 2.3/2.8 |
| 40MoO3 + 30Nd2O3 + 30B2O3 | 1.75/1.90 | 1.40 | 2.4/2.9 | 2.3/2.8 |
| 20MoO3 + 30Nd2O3 + 50B2O3 | 1.75/1.92 | 1.40 | 2.4/2.9 | 2.3/3.0 |
On the whole, the RMC calculations suggest that the molybdate glasses under consideration have a heterogeneous structure at the nanoscale, with some domains enriched in rare-earth cations coexisting with BO3/BO4 domains. With increasing Mo concentration, the Mo atoms form continuous clusters which are most prominently present in the Mo50Nd25B25 sample.
3.2. Setting the scale of disorder in molybdate glasses from the analysis of vibrational and Compton spectra of their parent polycrystalline metal oxides
In order to set the scale of disorder in molybdate glasses which is spanned by the compostitional averages of the ab initio predictions for apVDOSes of their parent metal oxide systems, for B2O3, MoO3, and Nd2O3, one needs first to validate these ab initio predictions by contrasting them with the experimental Raman, INS an NCS spectra. In the first step of this procedure, figure 4 displays the results of the lattice-dynamics predictions (phonon dispersion relations and the related VDOSes and apVDOSes) for the trigonal Nd2O3 (a.), α-MoO3 (b.), and the α-B2O3 (c.) structures, contrasted with the experimental Raman and INS spectra. Such a procedure is necessary as the credibility of the DFT predictions is difficult to be verified solely based on the presented INS spectra. The INS spectrum of B2O3 has only been recorded for the vitreous phase at MARI direct-geometry spectrometer, at ISIS, in the UK [63]. Furthermore, both Nd2O3 and α-MoO3 were studied on the inverse-geometry spectrometers, TOSCA, ISIS, UK [64–68], and FDS, LANSCE, US [69], where the intensity of the fundamental transitions vanishes rapidly with increasing energy transfer, contrary to contributions from overtones and combination bands. Furthermore, the Nd2O3 spectrum reflects intense crystal-field excitations superimposed on the signal recorded due to phonon excitations. Namely, in accordance with INS spectrum of Nd2O3 measured by Sala et al at the direct geometry SEQUOIA spectrometer at T = 5 and 50 K [70], our spectrum measured at 15K (see figure 4(a), top panel, top trace) exhibits a series of flat modes which are potentially Nd crystal-field levels. In particular, two strong modes near 3 and 10 meV and two less intense modes near 30 and 60 meV are present, with the mode at 60 meV being quite close to an oxygen phonon mode at ca. 58 meV (see figure 3 in [70]). Other phonon modes have been identified at ≈13 and ≈23.5 meV [70]. The nature of those modes could only be fully examined on direct-geometry inelastic spectrometers with large neutron momentum transfer windows, enabling rebinning the strong modes near 3 and 10 meV, and two less intense modes near 30 and 60 meV, along constant momentum transfer trajectories. In such constant momentum transfer scans, a quadratic increase in intensity with increasing momentum transfer reveals a mechanical nature of an excitation, whereas a Lorentzian type of decrease with increasing momentum transfer is a signature of its magnetic origin [70].
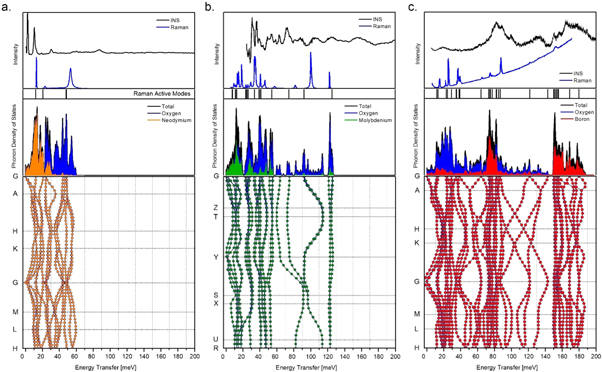
Figure 4. The results of the lattice-dynamics calculations (CASTEP/PW-DFT/GGA) performed at T = 0 K for: (a.) trigonal Nd2O3; (b.) orthorhombic α-MoO3 and (c.) trigonal α-B2O3. Phonon dispersion curves (bottom panels) are presented along with the phonon density of states projection [middle panels with the total (VDOS) and partial atomic (apVDOS) contributions]. The top panels display the room-temperature Raman spectra recorded for each crystal phase by: (a.) Nagai et al [71], (b.) Seguin et al [72] and (c.) Bronswijk et al [73]; along with low-temperature (<20 K) INS spectra recorded for each system with: (a.) TOSCA, ISIS, RAL, UK (present study); (b.) FDS, LANSCE, US [69] and (c.) MARI, ISIS, RAL, UK (the vitreous phase) [63]. The predicted frequencies of the Raman active modes are added for comparison (see the vertical black bars).
Download figure:
Standard image High-resolution imageThe problems with the interpretation of the INS spectra of B2O3, MoO3, and Nd2O3 can be partially avoided by resorting to Raman spectroscopy, where the quality of the Γ-point predictions can be easily verified. For this purpose, the high-quality Raman spectra [71–73] have been reproduced from the literature and presented in the top panels of figures 4(a)–(c) (lower traces). In the case of the highly-symmetric, bulk Nd2O3 (see figure 4(a)), one can clearly see the presence of three, well-separated Raman features observed at ca. 13 meV [Eg], 23.5 meV [A1g] and 53.5 meV [Eg and A1g] and predicted at 12.3 meV, 21.0 meV, 48.1 meV and 48.8 meV, respectively. This clearly illustrates that the GGA approximation describes very well the frequency distribution even in the case of the lanthanide, with the maximal deviation of ca. 5 meV for the higher-frequency stretching modes.
We note here that in the case of the trigonal Nd2O3 model, the Raman-active modes have been identified through the normal-mode projections since the symmetry has been lowered to the non-centrosymmetric antiferromagnetic configuration (P3m1 (156)).
Similar quality of ab initio prediction within the GGA approximation is observed in the case of the molybdenum oxide (see figure 4(b)). The α phase of MoO3 features double layers of linked and distorted MoO6 octahedra. The irreducible representation for the α-MoO3 (Pnma (62)) is given as:

where the Ag, B1g, B2g and B3g modes are Raman-active. The modelling in the framework of standard GGA approach predicts the frequencies distributed with an overall root-mean-square deviation (RMSD) of 4.0 meV. The upper VDOS limit refers to the stretching modes of dangling oxygen atoms in the interlayer space, ν(Mo=O), which are perfectly reproduced at 126 meV. The largest errors are associated with the stretching of the corner-shared oxygen atoms within the layers, ν(O–Mo–O), reaching 7.5 meV. These modes are spanned over the range of 60–120 meV, being subject to strong dispersion. The range below 60 meV is due to δ(O–Mo–O) deformations, being specific to the layered environment.
In the case of α-B2O3 (P31 (144)) all vibrations are Raman-active, with the normal modes distributed as:

Figure 4(c). superimposes the INS and Raman spectra recorded for the vitreous and crystalline phases, respectively. In analogy with the results presented for the caesium borates [63], one may expect that the upper limit of the VDOS for both vitreous and crystalline samples is very similar. The α-B2O3 phase is composed of ribbons formed by planar BO3 triangles, in principle less stable than the boroxol rings typical for the vitreous phase. The absence of the boroxol rings in the crystal phase is proven by the lack of the marker band observed with INS at ca. 100 meV. The predicted phonons undergo considerable dispersion, whereas the Γ-point frequencies match very well the peak positions observed with Raman spectroscopy. There is a very good agreement all across the spectral range with an overall RMSD error of 1.3 meV.
In order to set the scene for the validation of the ab initio predictions for B2O3, MoO3, and Nd2O3 by NCS, we note that the bandwidths of the simulated VDOSes decrease with increasing mass of the formula unit of a system, starting from ca. 190 meV for α-B2O3, through ca. 130 meV for α-MoO3, and down to ca. 60 meV for Nd2O3 (see figure 4). Moreover, in figure 4, the influence of the masses of the constituent metal oxide nuclei on the centres of gravity of the VDOSes and apVDOSes is clearly visible. Namely, with increasing nuclear mass and the mass of the formula unit of a system a clear decrease of the centre of gravity of the VDOS (CoG) and apVDOSes (CoGM) and the concomitant narrowing of the extent of the vibrational spectra is observed.
In order to further corroborate the trends visible in figure 4 fits were performed of the nuclear momentum distributions recorded at VESUVIO for the B, O, Mo and Nd nuclei in metal-oxide systems B2O3, MoO3, and Nd2O3. In fitting, the NMDs of all nuclei present in B2O3, MoO3, and Nd2O3 were approximated by Gaussian functions (see table 1 in the SM). The fits, together with data recorded at VESUVIO, are shown in figure 5. Due to negligible isotopic mass variance, in all metal oxide systems, the oxygen peak was modelled as coming from a single isotopic species with mass corresponding to the natural oxygen isotopic abundance. However, in the case of the boron in B2O3, VESUVIO was capable of resolving two boron isotopes, 10B and 11B and one oxygen peak (figure 5(a)). In the case of MoO3, and Nd2O3, VESUVIO was not capable of resolving more than one peak for each atomic species. Thus, two peaks per metal oxide system were assumed in fitting; one from the oxygen and one from the metal nucleus (Mo, Nd), both with average atomic masses (See section 1 in the SM). Such assumptions greatly simplified the NCS data analysis without limiting the discussion about the origins of isotopic mass and force constant disorder in all three metal oxide systems.
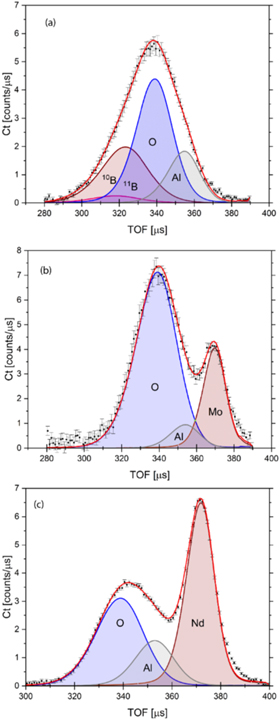
Figure 5. Fits of the TOF spectra recorded at VESUVIO for metal-oxide systems: (a). B2O3, (b). MoO3, and (c). Nd2O3. See text for details.
Download figure:
Standard image High-resolution imageAs shown in figure 5, VESUVIO demonstrates the same degree of isotopic mass resolution as predicted by simulations. Two peaks from two boron isotopes are clearly distinguishable. Both are centred at lower TOF values, to the
left of the oxygen recoil peak, placed at the centre. The oxygen peak is followed by the peak of the aluminium container at the high TOF value end of the recorded spectrum (figure 5(a)). Due to the fact that, in fitting, the values of the standard deviations of the momentum distributions of both resolved boron isotopes were practically identical within the experimental accuracy, only one fitted value will thereinafter be reported for the boron. In the case of the MoO3 and the Nd2O3 samples, three distinct peaks per spectrum are clearly visible; a peak of the oxygen to the left, and a peak of the metal to the right, both separated by the peak of the aluminium container (figures 5(b) and (c)).
The results of the fitting of the NMD profiles of the B, O, Mo and Nd nuclei in B2O3, MoO3, and Nd2O3 are listed (in parentheses) in table 2. This table also lists the results of the ab initio modelling (using formulas 3–7 in the SM) of the mean NMD widths, σ (top entries), and the nuclear kinetic energy, Ekin , (bottom entries) calculated at T = 300 K. Two trends are visible for the values of the NMD widths predicted by the ab initio modelling. The first one is the systematic increase of the NMD width with the increasing mass of the nucleus. This trend can be explained using a simple realisation that, as a nucleus becomes heavier it also usually becomes more 'classical', i.e., more localised in position space and thus more delocalised in momentum space (characterised by a wider NMD) [31, 32, 74, 75]. The second trend, clearly visible in the case of the oxygen, is a systematic decrease of the value of the NMD width with the increasing mass of the formula unit (with the increasing mass of the metal nucleus to which the oxygen is bound).
Table 2. The results of the ab initio modelling of the mean NMD widths (top entries), σ, (expressed in units of Å−1) and the nuclear kinetic energy (bottom entries), Ekin (expressed in units of meV) of the B, O, Mo and Nd nuclei in B2O3, MoO3, and Nd2O3. Additionally, the results of fitting of experimental NCS data of B2O3, MoO3, and Nd2O3 are listed in parentheses. See text for details.

|
Interestingly, the values obtained from NCS experiments for the oxygen seem to follow a slightly reverse trend to the one observed in the ab initio prediction, with the widths slightly increasing with an increasing molecular mass of the unit formula, from B2O3 towards Nd2O3. Also, in the case of B2O3 and MoO3, there is a degree of softening of the widths of momentum distributions of the boron and the molybdenum as compared to the ab initio predictions. There are three possible explanations for an experimental trend like this that need to be disentangled, mode softening due to thermal lattice expansion, isotope mass disorder, and force constant disorder. Mode softening due to thermal lattice expansion and isotopic mass disorder is not accounted for in our ab initio calculations, where the structure is optimised in the 0K temperature limit, and the temperature effect is accounted for only by the Boltzmann population factors (see equation (6) in the SM). Moreover, the most abundant oxygen isotope, 16O, makes up most of the naturally occurring oxygen (99.76%) and can, therefore, be considered isotopically pure. Thus, one can namely safely assume that the observed systematically lower, compared to ab initio predictions, oxygen kinetic energy values in all three compounds originate from phonon softening due to the combination of the lattice expansion and force constant disorder. Moreover, the degree of this softening decreases with increasing mass of the formula unit of the crystalline system, being the highest in B2O3 and the lowest (and practically non-existent) in Nd2O3.
Contrary to the oxygen, natural boron is made up of two stable isotopes, 10B and 11B with relative abundances of 19.9% and 80.1%, respectively. Similarly as in the case of the hexagonal boron nitride (h-BN) [76], one can assume that, given the relatively low mass of boron, its natural isotopic distribution in B2O3 introduces significant mass fluctuations in the B sublattice. The degree of mass fluctuation in the sublattice can be measured in terms of the mass variance, g, given by the expression, ![$g=\displaystyle {\sum }_{i}{C}_{i}{\left[1-\left({M}_{i}/M\right)\right]}^{2},$](https://content.cld.iop.org/journals/2399-6528/4/9/095027/revision4/jpcoabb8eeieqn8.gif) where Mi is the isotope mass, Ci its relative abundance, and M is the average mass [76]. For the case of B2O3, identically to BN [76], g = 1.354 × 10⁻³, and therefore strong isotopic-disorder effects should be expected. The mass fluctuations in the boron sublattice break the translational symmetry. In consequence, crystal momentum conservation is relaxed, allowing elastic scattering of phonons and leading to the frequency shift and broadening of the phonon spectrum [76, 77]. The analysis of the isotopic mass disorder-induced shifts of the phonon dispersion curves and changes of phonon lifetimes was performed for h-BN employing the perturbation theory of anharmonic decay [76]. The analysis revealed that the high energy optical modes exhibit a significant frequency shift (∼4.3 meV) over the whole Brillouin zone. In contrast, the isotopic shift was found to be reduced for the mid-energy optical modes and virtually inexistent for the low-energy acoustic modes. With the NCS method being most sensitive to the high-frequency phonon modes that carry the bulk of the kinetic energy of a nucleus, one is to expect a significant lowering of the value of the measured nuclear kinetic energy induced by the isotopic mass disorder. Additionally to the phonon shift, phonon broadening was observed for B in h-BN, whereby the observed high-energy excitation profile was skewed towards lower energies. However, the phonon broadening will most certainly contribute to the systematic lowering of the value of the nuclear kinetic energy of the boron to a much lesser extent than the overall shift observed. The magnitudes of the shift and the asymmetric broadening of the phonon excitations, jointly shifting the CoG's of the apVDOS of the boron towards the lower energy values, need to be contrasted with the magnitude of the temperature-induced phonon softening due to anharmonicity. In the case of h-BN, the reported contribution of the lattice expansion to the thermal shift of the phonon excitations was ca. 0.4 meV at 300K [76]. This contribution is a factor of ca. 5.4 lower than the anticipated isotopic mass disorder-induced lowering of the boron kinetic energy in h-BN being of the order of ca. 0.5 × 4.3 = 2.15 meV (using the harmonic approximation). Comparing h-BN to B2O3 one has to bear in mind that the systematic differences between the experimentally obtained values and the ab initio predictions for the nuclear kinetic energies at 300K for B in B2O3 are calculated within the harmonic approximation and assuming no isotopic mass disorder. The difference between the two values is in the order of 2-STD's of the uncertainty of the measurement and equals ca. 24 meV. One can assume that the ratio between the isotopic mass disorder-induced and thermally-induced phonon softening is approximately the same for B in h-BN and B in B2O3. Under this assumption, we obtain a value of ca. 3.8 meV for the thermal effect on phonon softening in the case of B in B2O3, with the remainder of ca. 20 meV that can be attributed to the isotopic mass disorder. This assessment can be contrasted with literature data on the effect of anharmonicity in B2O3 [78–84]. With most of the data reported in the literature being on vitreous B2O3 [78, 80–84], we will assume for the purpose of the argument that the glassy diboron trioxide provides an upper conservative bound for the amount of the anharmonicity in its crystalline counterpart. In glassy B2O3, the amount of anharmonicity has been quantified in the literature by the magnitudes of Gruneisen parameter, γ, inferred both from experimetnal data and theoretical treatment [78, 80–84]. The values of γ reported are below unity, signifying a low amount of anharmonicity, especially in the low-temperature region, below the glass transition temperature [78, 80–84]. A detailed analysis of the anharmonicity in glassy B2O3 was performed by Novikov [81]. Qualitatively, this analysis was shown to be in agreement with a rule of thumb stating that the stronger the glass former, the lower the anharmonicity [81]. With the diboron trioxide being a relatively strong glass-former, one can thus expect that the amount of anharmonicity in its crystalline counterpart should be negligible in the relatively low-temperature region investigated in this work. Amongst the literature studies on anharmonicity in B2O3, the only one dealing with the crystalline form, high-pressure phase of boron oxide, orthorhombic β- B2O3, reports Gruneisen parameters of all experimentally observed Raman bands, calculated based on the data on Raman shift as a function of pressure, combined with equation-of-state data [79]. The values of the Gruneisen parameter reported for the most of the observed Raman bands were between 0.5 and 1.8, with one exception being a value of 3.993 for the Raman B1 mode at 288.6 cm−1 [79]. Importantly, Gruneisen parameters of the high-frequency vibrational modes, to which the NCS technique is most sensitive, were reported to lie in the range between 0.6 and 0.8 [79], thereby corroborating the conclusion of negligible influence of anharmonicity on the softening of the widths of nuclear momentum distributions of the boron and the oxygen in the crystalline B2O3.
where Mi is the isotope mass, Ci its relative abundance, and M is the average mass [76]. For the case of B2O3, identically to BN [76], g = 1.354 × 10⁻³, and therefore strong isotopic-disorder effects should be expected. The mass fluctuations in the boron sublattice break the translational symmetry. In consequence, crystal momentum conservation is relaxed, allowing elastic scattering of phonons and leading to the frequency shift and broadening of the phonon spectrum [76, 77]. The analysis of the isotopic mass disorder-induced shifts of the phonon dispersion curves and changes of phonon lifetimes was performed for h-BN employing the perturbation theory of anharmonic decay [76]. The analysis revealed that the high energy optical modes exhibit a significant frequency shift (∼4.3 meV) over the whole Brillouin zone. In contrast, the isotopic shift was found to be reduced for the mid-energy optical modes and virtually inexistent for the low-energy acoustic modes. With the NCS method being most sensitive to the high-frequency phonon modes that carry the bulk of the kinetic energy of a nucleus, one is to expect a significant lowering of the value of the measured nuclear kinetic energy induced by the isotopic mass disorder. Additionally to the phonon shift, phonon broadening was observed for B in h-BN, whereby the observed high-energy excitation profile was skewed towards lower energies. However, the phonon broadening will most certainly contribute to the systematic lowering of the value of the nuclear kinetic energy of the boron to a much lesser extent than the overall shift observed. The magnitudes of the shift and the asymmetric broadening of the phonon excitations, jointly shifting the CoG's of the apVDOS of the boron towards the lower energy values, need to be contrasted with the magnitude of the temperature-induced phonon softening due to anharmonicity. In the case of h-BN, the reported contribution of the lattice expansion to the thermal shift of the phonon excitations was ca. 0.4 meV at 300K [76]. This contribution is a factor of ca. 5.4 lower than the anticipated isotopic mass disorder-induced lowering of the boron kinetic energy in h-BN being of the order of ca. 0.5 × 4.3 = 2.15 meV (using the harmonic approximation). Comparing h-BN to B2O3 one has to bear in mind that the systematic differences between the experimentally obtained values and the ab initio predictions for the nuclear kinetic energies at 300K for B in B2O3 are calculated within the harmonic approximation and assuming no isotopic mass disorder. The difference between the two values is in the order of 2-STD's of the uncertainty of the measurement and equals ca. 24 meV. One can assume that the ratio between the isotopic mass disorder-induced and thermally-induced phonon softening is approximately the same for B in h-BN and B in B2O3. Under this assumption, we obtain a value of ca. 3.8 meV for the thermal effect on phonon softening in the case of B in B2O3, with the remainder of ca. 20 meV that can be attributed to the isotopic mass disorder. This assessment can be contrasted with literature data on the effect of anharmonicity in B2O3 [78–84]. With most of the data reported in the literature being on vitreous B2O3 [78, 80–84], we will assume for the purpose of the argument that the glassy diboron trioxide provides an upper conservative bound for the amount of the anharmonicity in its crystalline counterpart. In glassy B2O3, the amount of anharmonicity has been quantified in the literature by the magnitudes of Gruneisen parameter, γ, inferred both from experimetnal data and theoretical treatment [78, 80–84]. The values of γ reported are below unity, signifying a low amount of anharmonicity, especially in the low-temperature region, below the glass transition temperature [78, 80–84]. A detailed analysis of the anharmonicity in glassy B2O3 was performed by Novikov [81]. Qualitatively, this analysis was shown to be in agreement with a rule of thumb stating that the stronger the glass former, the lower the anharmonicity [81]. With the diboron trioxide being a relatively strong glass-former, one can thus expect that the amount of anharmonicity in its crystalline counterpart should be negligible in the relatively low-temperature region investigated in this work. Amongst the literature studies on anharmonicity in B2O3, the only one dealing with the crystalline form, high-pressure phase of boron oxide, orthorhombic β- B2O3, reports Gruneisen parameters of all experimentally observed Raman bands, calculated based on the data on Raman shift as a function of pressure, combined with equation-of-state data [79]. The values of the Gruneisen parameter reported for the most of the observed Raman bands were between 0.5 and 1.8, with one exception being a value of 3.993 for the Raman B1 mode at 288.6 cm−1 [79]. Importantly, Gruneisen parameters of the high-frequency vibrational modes, to which the NCS technique is most sensitive, were reported to lie in the range between 0.6 and 0.8 [79], thereby corroborating the conclusion of negligible influence of anharmonicity on the softening of the widths of nuclear momentum distributions of the boron and the oxygen in the crystalline B2O3.
A similar assessment of the isotopic mass disorder and the thermal effect on phonon softening can be performed for Mo in MoO3, and Nd in Nd2O3. For Mo in MoO3 and Nd in Nd2O3 the mass variance, g, evaluates to 0.598 × 10⁻³ and 0.232 × 10⁻³, being two and six times lower than the value for B in B2O3, respectively. One can assume proportionality between the value of the mass variance and the magnitude of the isotopic mass disorder-induced phonon shift for all three metal oxide crystals. Under this assumption, the ratios between magnitudes of the mass disorder-induced and the thermally induced phonon softening are 5.4 ÷ 2 = 2.7 for Mo in MoO3, and 5.4 ÷ 6 = 0.9 for Nd in Nd2O3, respectively. In both cases the magnitudes of the differences between the predicted and experimental values of the nuclear kinetic energies at 300 K are much lower compared to the value of 24 meV for B in B2O3, i.e. 2.8 ± 1.7 meV and -4.6 ± 3.3 meV, for Mo in MoO3, and Nd in Nd2O3 respectively. Taken together, we obtain a value of ca. 2.0 meV due to the isotopic mass disorder for Mo in MoO3, with the remainder of ca. 0.8 meV that can be attributed to the thermal effect on phonon softening. The estimated magnitude of the thermal effect on phonon softening for Mo in MoO3 can be contrasted with the results of the analysis of far-infrared reflectivity spectra of a single crystal of MoO3 that were measured at 5K and 300K by Julien et al [85]. The authors observed a gradual broadening and softening of the infrared-active modes with temperature. The magnitude of mode softening observed by Julien et al 0.25–0.375 meV, is substantially below the upper conservative limit of 0.8 meV that was set in our analysis. Thus, the temperature behaviour of the vibrational modes observed in the infra-red absorption corroborates our assumption about the negligible mode softening effect due to anharmonicity.
In the case of Nd in Nd2O3 the relatively high experimental error does not allow to conclude whether one observes any degree of softening or hardening of the apVDOS of the neodymium. However, we can still assess the amount of thermally induced phonon softening due to anharmonicity in Nd2O3. The Raman mode Gruneisen parameters in Nd2O3 were calculated in an experimental study by Jiang et al [86]. Importantly in the context of the analysis of NCS data presented here, since the stretching modes are directly affected by the bond length, whereas the bending modes are influenced by more complex factors, analyses were focused on the two stretching modes, chiefly contributing to the magnitudes of nuclear kinetic energies of O and Nd in Nd2O3 [86]. The values of the Gruneisen parameters for all stretching modes under consideration were between 0.6 and 1.5 for the low-pressure region [86], thus similar to the values tabulated in literature for B2O3, thereby signalling small amount of anharmonicity.
On the whole, two conclusions are obtained from our analysis. Firstly, for both B in B2O3 and Mo in MoO3, the observed phonon softening may be largely attributed to the effect of isotopic mass disorder. Secondly, for Nd in Nd2O3, within the precision of the NCS method, one cannot unambiguously assume any degree of phonon softening neither due to the thermal effect nor due to the mass disorder. However, the anticipated effect of the anharmonicity should be negligible compared to the effect of the disorder in Nd2O3. Importantly, these results also validate the modelling strategy assumed for the metal oxide systems under consideration. Namely, in light of negligible amount of anharmonicity in all three metal oxide systems under consideration, the systematic differences between the values of the nuclear kinetic energies obtained from modelling and experiments can be well captured by contrasting the experimental values with the ab initio predictions based on the harmonic approximation solely.
The remaining question in our assessment is that of sources of possible phonon softening in the case of the oxygen present in all three oxide crystals. The observed differences between the predicted and experimental values of the nuclear kinetic energies of the oxygen at 300K are 22.6, 15.5 and 1.7 meV for O in B2O3, MoO3, and Nd2O3 respectively. These values are much higher than the value obtained for B in h-BN due to lattice expansion. One can thus expect that the bulk of phonon softening should come from the force-constant disorder. This conclusion is further corroborated by the observation that, contrary to the trend predicted by the ab initio calculation within the harmonic approximation and with no isotopic mass disorder, the value of the mean nuclear kinetic energy of the oxygen increases with increasing mass of the metal nucleus the oxygen is bound to. Such trend was observed for instance in Raman spectra of rare-earth nitrides [87], where it was related to the decreasing trend in lattice constant and hence increase in force constant rather than the mass of the rare-earth ion.
The force-constant fluctuations observed in the case of the oxygen in metal oxides can provide clues for the discussion of the disorder-induced changes in phonon properties of the molybdate glasses that are considered in the next section of this work. To set the ground for this discussion, let us assume that no other atomic species present in the molybdate glasses under consideration is subject to force constant fluctuation, an assumption that seems plausible in light of the discussion above. In the case of theoretical and experimental work concerning vibrational spectroscopy, the analysis of disorder-induced changes in phonon spectra usually involves fitting the phonon dispersion relations obtained from ab initio simulations by the Born-von Karman model [77, 87–102]. As the NCS technique does not resolve individual modes of vibration but rather the CoG values of apVDOSes of individual nuclei, we will use the distribution of the CoGs as a vehicle for the initial assessment. Within the harmonic approximation, one can use, instead of a distribution of force constants, an equivalent distribution of frequencies of vibration obtained using the Jacobian of the transformation between the two distributions. Assuming a normal distribution of frequencies (or energies) of vibrations, we can take the centre and the standard deviation of the distribution as the average and the standard deviation of the set of the predicted values of kinetic energies for O in B2O3, O in MoO3, and O in Nd2O3. This enables us to contrast the distribution calculated from ab initio predictions with the one obtained from kinetic energies of the oxygen in metal oxides obtained from NCS experiments. The results of these calculations are listed in table 3. It is clear that the distribution of the frequencies (or energies) of vibration, based on the ab initio calculation within the harmonic approximation with no isotopic mass disorder taken into account, undergoes a 'temperature narrowing' effect, where the widths of this distribution decrease by more than a factor of two between 0 K and 300 K. Additionally, there is a quite substantial degree of 'softening' of the value of the centre of the distribution of theoretically predicted values. As the ab initio calculation was performed with no isotope mass disorder accounted for, the observed narrowing effect can originate from two factors. The first one is the difference in bond lengths and thus force constants of the bonds between the oxygen and its nearest neighbour metal nucleus. The second one is the fact that in each metal oxide, the oxygen is bonded to a metal nucleus of a different mass, and thus the bond vibration frequency is different. In the case of the experimental result obtained at 300K, listed in table 3, both the width and the centre of the distribution are clearly lower in value than their ab initio counterparts. These two differences between the theoretical predictions and the values obtained from the NCS experiments can be explained as a failure of the total energy-based ab initio minimisation method to precisely account for the real structure and, in consequence, dynamics in B2O3, MoO3, and Nd2O3 crystals. Namely, the determination of bond lengths from the minima of the total energy is only an approximation since the nuclear kinetic vibration energy and vibrational entropy are neglected. The equilibrium interatomic distances should rather be determined from the minimum of the Helmholtz free energy [103, 104]. Theoretical studies of the isotope mass and the force-constant disorder in a crystal of isotopically mixed diamond [103], and silicon [104] have revealed that with increasing temperature, the distributions of force constants for bonds connecting different pairs of isotopes become narrower by as much as a factor of two [103]. Physically, such a narrowing of the force constant distribution, under the assumption of negligible anharmonicity, results from the isotopic mass disorder. In the case of the oxygen in the B2O3, MoO3, and Nd2O3 crystals, we have assumed no isotopic mass disorder in our ab initio lattice dynamics calculations. In reality, a single isotope of the oxygen is chemically bound to two boron isotopes in B2O3, seven molybdenum isotopes in MoO3, and seven neodymium isotopes in Nd2O3. Each of these isotopes has a different mass and different amount of the vibrational energy and entropy entering the expression for the Helmholtz free energy. If the equilibrium bond lengths are obtained as minima of the Helmholtz free energy the mass dependence of the bond length originates from the quantum-mechanical effect of the zero-temperature vibrational energy, which generally increases with decreasing isotope mass. As a result of this, a crystal composed of the heavier isotope has a smaller bond length (and thus a larger magnitude of interatomic force constant of the bond) than the one made of the lighter isotope [103, 104]. Bond lengths, and in consequence, bond strengths and the magnitudes of force constants for bonds connecting different pairs of isotopes, change differently with increasing temperature. It is thus quite plausible to assume that temperature acts as an agent effectively narrowing the distribution of bond lengths and force constants by differently changing the amounts of the vibrational energy and entropy for different isotopic species. Notwithstanding the above, in what follows, we will show that one can qualitatively reproduce such a 'temperature narrowing effect' of force constant distributions based on equation (1) and the ab initio harmonic lattice dynamics following the total energy minimisation scheme solely. We start by showing, in figures 6 and 7, the average effective mean force constants calculated from equation (1) using underlying apVDOSes obtained from the ab initio phonon calculations for different isotopic species of B in B2O3 (figure 6(a)), Mo in MoO3 (figure 6(b)), and Nd in Nd2O3 (figure 6(c)), as well as for O bound to different isotopic species of B in B2O3 (figure 7(a)), Mo in MoO3 (figure 7(b)), and Nd in Nd2O3 (figure 7(c)). A small degree of 'temperature narrowing of the average effective mean force constants is visible for isotopes of metals in figure 6, but inspection of figure 7 clearly reveals a large temperature narrowing effect for oxygen atoms bound to different isotopic species of metals in all three metal oxide systems. This effect is reproduced owing to the weighing with the Boltzmann population factors of the widths of the nuclear momentum distributions and the plus first and minus first moments of the apVDOSes. Table 4 lists the values of the average effective mean force constants,  for all nuclei in B2O3, MoO3, and Nd2O3 and table 5 the mean values and the standard deviations calculated based on values listed in table 4. It is clear that with increasing temperature, the values of the average effective mean forces are characterised by narrower distributions, especially in the case of O in B2O3, O in MoO3, and to a lesser extent in the case of Mo in MoO3 and Nd in Nd2O3. The values for the oxygen bound to neodymium and boron bound to the oxygen do not experience any marked degree of narrowing, which may be a sign of a mass disorder rather than force constant type of disorder in the case of B in B2O3 and O in Nd2O3.
Table 3. The values of the centre, ω0, and the standard deviation, Δω, of the normal distribution of vibrational kinetic energies of the oxygen obtained from the ab initio calculation at 0K and 300K and the normal distribution of experimental values obtained at 300K (in parentheses). See text for details.
| Temperature [K] |
![${\omega }_{0}\left[{\rm{meV}}\right]$](https://content.cld.iop.org/journals/2399-6528/4/9/095027/revision4/jpcoabb8eeieqn10.gif)
|
![${\rm{\Delta }}\omega \left[{\rm{meV}}\right]$](https://content.cld.iop.org/journals/2399-6528/4/9/095027/revision4/jpcoabb8eeieqn11.gif)
|
|---|---|---|
| 0 | 40.6 | 12.1 |
| 300 | 54.1(41 ± 4) | 6.9(5.6 ± 0.6) |

Figure 6. The values of average effective mean force constants calculated from underlying apVDOSes obtained from the ab initio phonon calculations for different isotopic species of B in B2O3 (a), Mo in MoO3 (b), and Nd in Nd2O3 (c). The insets show the plots of the effective mean force constants zoomed into the temperature region between 250 K and 300K. See text for details.
Download figure:
Standard image High-resolution image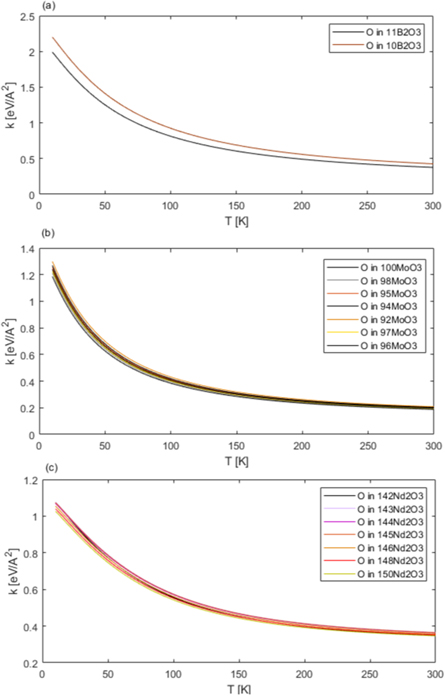
Figure 7. The values of average effective mean force constants calculated from underlying apVDOSes obtained from the ab initio phonon calculations for O bound to different isotopic species of B in (a). B2O3, (b). Mo in MoO3, and (c). Nd in Nd2O3. See text for details.
Download figure:
Standard image High-resolution imageTable 4. The values of average effective mean force constants, k, for individual nuclei in B2O3, O in MoO3, and O in Nd2O3 obtained using the apVDOSes obtained from the ab initio simulations at 0K and 300K. The values are listed according to entries labelled as iX-jY, where X and Y are B, O, Mo, and Nd, and the indices i and j number the isotopic species of atoms X and Y. See text for details.

|
Table 5. Mean values, k 0, and the standard deviations, Δk, of the normal distributions of effective force constants calculated from values listed in table 4 using isotopic abundancies as weigths. See text for details.
|
Mean force-constant data listed in the literature are obtained from the analyses of infra-red and/or Raman spectra. When comparing these values with the ones obtained from the analysis of the NCS data one has to bear in mind that in the case of the vibrational spectroscopy-based analyses the force constant values are obtained based on the analyses of isolated modes of vibration, in the case of NCS they are obtained as effective, high-frequency and Boltzmann factor-weighted at room temperature. Thus, any comparison of this sort makes sense mostly in the case of high-frequency stretching modes recorded at room temperature. Moreover and perhaps most importantly, whereas in this work the term 'average effective mean force constant' has been coined to describe magnitudes of forces obtained from Boltzmann-occupation and high-frequency weighted apVDOSes, in the literature a slightly different term is in circulation—'the average stretching force constant'. Although not identical, these two types of observables have a lot in common. Firstly, both are high- frequency weighted. Secondly, no directionality is assumed in both cases as the averaging produces mean scalar values of the force magnitudes. However, there is one crucial difference. Whereas, the average stretching force constant is not a nuclear isotope mass-resolved quantity, the average effective mean force constant obtained from NCS experiments is such an observable. The average stretching force constants are functions of underlying total VDOSes, and the mass-projected force constants obtained from NCS are functions of atom-projected VDOSes. As the NCS technique measures observables related directly to apVDOSes and the apVDOSes sum up directly to the resultant VDOSes, a direct summing up of the atom-projected force magnitudes in order to obtain an approximation for the total effective force seems quite plausible. Thus, in what follows, for both the molybdate glasses and their parent metal oxide systems, we will use both the values of the individual, mass-projected force constants and their sums when comparing with the values of the average stretching force constants tabulated in the literature.
In work by Takada et al [105], interatomic potentials for both low and high-pressure crystal forms of B2O3 were derived by fitting to ab initio energy surfaces derived from both periodic boundary conditions and molecular calculations, to which the restraints produced by the observed crystal structures were added. In order to express the directional properties of covalent bonding, a three-body simple- harmonic, bond-bending was term was used [105]. Fitted potentials based on low-pressure crystal form of B2O3 and ab initio data contained force constant magnitudes ranging from 1.66 to 8.08 eV Å−2 [105]. These values compare favourably to the average magnitudes of the force constants for B and O in B2O3 reported in tables 4 and 5. Their sum is equal to 5.7 ± 0.1 eV Å−2 in the limit of T = 0 K and softens quite considerably to the value of ca 1.0 ± 0.01 eV Å−2 at room temperature.
Raman study of cubic RE2O3 (RE = Nd, Gd, Dy, Tm, and Lu) by Ubaldini et al [106] yielded force constant values for Nd2O3 around 5.6 eV Å−2 and the study of vibrational spectra of Nd2O3 by Denning et al [107] values ranging from 0.25 to 7.6 eV Å−2, thus overlapping with the range of force constant values and their sums listed in tables 4 and 5. In work by Cotton et al [108], force-constant values were obtained for Mo–O bonds on the basis of structural and infrared data. It was found that for MOn groups, where n > 1, a positive M–O to M–O stretching interaction constant in the ranged from 1.25 to 4.375 eV Å−2. For the antisymmetric Mo-O-Mo stretching mode, the analysis revealed that the magnitudes of force constants range from 2.75 to 40 eV Å−2. Thus, also in the case of this analysis the range of force constant values overlaps with data obtained in this work.
3.3. Disorder-induced phonon softening in molybdate glasses
Fits of the TOF spectra recorded at VESUVIO for molybdate glasses are shown in figure 8. The detailed account for the NCS data analysis procedure is given in section 1 of the SM. Thus, here we will only note a few details important for further discussion. Unlike in the case of the fits of the TOF spectra recorded at VESUVIO for metal oxide systems, here only the boron 11 isotope was present. All peaks present in the TOF NCS spectra were modelled as Gaussians. A justification for adopting such a model is as follows. Firstly, it is worth emphasizing that, according to the ab initio simulation results presented in section 2 of the SM, the nuclear momentum distributions of all parent metal-oxide systems can be very well approximated as Gaussians. Secondly, taking into account that the measured nuclear momentum distributions of all nuclei present in the molybdate glasses result from averaging over many different local environments, one can safely assume that the effective number of vibrational degrees of freedom contributing to these averaged momentum distributions is large enough for the Central Limit Theorem (CLT) to be valid. As mentioned by Sears [109], in such a case the CLT leads to the observation of isotropic local potentials and thus Gaussian nuclear momentum distributions. All of the recoil peaks present in the TOFspectra of molybdate samples but the peak of the boron-11 were constrained to be centred at TOF values corresponding to nuclear masses given by average atomic masses. Moreover, stoichiometric fixing was applied in fitting for all masses with the exception of the aluminium. Such an approach resulted in good quality fits with clearly resolved responses from individual atomic species. Typically for an inverse-geometry neutron Compton spectrometer, the peaks of atomic species with increasing masses show up in the TOF spectra centred at increasing values of the time of flight; starting from the boron peak on the left, through the oxygen peak and the peak of the aluminium containers in the middle, towards the peak of the molybdenum, followed by the neodymium peak on the right of the TOF spectrum for each molybdate sample.

Figure 8. Fits of the TOF spectra recorded at VESUVIO for molybdate glasses: (a). 20MoO3 + 30Nd2O3 + 50B2O3, (b). 40MoO3 + 30Nd2O3 + 30B2O3, and (c). 50MoO3 + 25Nd2O3 + 25B2O3. See text for details.
Download figure:
Standard image High-resolution imageTable 6 lists the results of fitting of experimental NCS data, the mean NMD widths, σ, and the nuclear kinetic energy, Ekin, of the boron, oxygen, molybdenum and neodymium in molybdate glasses. For atomic species whose different isotopes were present in the samples, the average atomic masses were assumed in the fitting. In the case of the boron, no isotopic mass disorder was present as the samples were enriched with the 11B isotope. For the amount of the strong glass former B2O3 varying between 50 mol% and 30 mol%, the NMD widths of the boron-11 and the oxygen are constant within the accuracy of the NCS measurements. However, both widths soften upon decreasing the amount of B2O3, from 30 mol% to 25 mol%. Moreover, both the boron-11 and the oxygen NMD widths in all molybdates are lower than the NMD width of the boron and the oxygen at natural abundance present in the α- crystal phase of B2O3. Encouraged by the results of the simulations of the force-constant disorder in metal oxide systems, performed in the first part of this work, one can work under the assumption that, in the presence of a minimal degree of isotopic mass disorder and the temperature narrowing effect, the force-constant disorder will also be minimised in the molybdate glasses. Thus, the trends observed for the NMD widths of the boron-11 and the oxygen in the molybdate glasses must be caused by the presence of the strong glass former, the diboron trioxide.
Table 6. The results of fitting of experimental NCS data in molybdates. The top entries in each cell refer to the values of the widths of momentum distributions. In the bottom entries of each table cell the values of the nuclear kinetic energy are listed. See text for details.
| σ (Å−1) | |||
|---|---|---|---|
| Ekin (meV) | |||
| Nucleus | 20MoO3 + 30Nd2O3 + 50B2O3 | 40MoO3 + 30Nd2O3 + 30B2O3 | 50MoO3 + 25Nd2O3 + 25B2O3 |
| 11B | 9.8 ± 0.5 | 10.0 ± 0.5 | 9.3 ± 0.5 |
| 54.7 ± 5.6 | 57.0 ± 5.7 | 49.2 ± 5.3 | |
| O | 11.3 ± 0.8 | 11.2 ± 0.7 | 10.4 ± 0.6 |
| 50.0 ± 7.1 | 49.1 ± 6.1 | 42.4 ± 4.9 | |
| Mo | 25.2 ± 0.8 | 24.4 ± 0.8 | 26.4 ± 0.8 |
| 41.5 ± 2.6 | 38.9 ± 2.6 | 45.5 ± 2.8 | |
| Nd | 30.3 ± 0.8 | 30.3 ± 0.8 | 30.3 ± 0.8 |
| 39.9 ± 2.1 | 39.9 ± 2.1 | 39.9 ± 2.1 | |
A trend whereby the average kinetic energy of a nucleus grows with an increased amount of the positional disorder has already been observed in Raman spectra of disordered polycrystalline systems at ambient temperature [110]. In such systems, one observes the appearance of a larger number of internal modes than predicted by group theory, which can be understood if one invokes the existence of misoriented configurations. For instance, in zirconium tungstate, some fraction of the tetrahedra are misoriented with respect to crystallographically permitted orientation/configuration at random sites which increases the number of high-frequency Raman modes [110]. Another example is potassium alum, where dynamic disorder has also been observed to increase the density of high-energy phonon states [111, 112]. Of course, in the case of glassy structures, a different, more local mechanism of disorder must be taken into account. Namely, in the disturbed configuration, the bond lengths can get slightly altered, leading to new mode frequencies (disorder peaks) of the symmetric stretching modes [110]. Such local bond-length altering could still be reconciled with the observation that in the molybdate glass with the highest amount of B2O3 the NMD width of the boron-11 is within 1-STD equal to the NMD width obtained in the NCS experiment for the natural abundance boron in the crystalline B2O3 and 3-STD above the ab initio prediction for the crystalline form of diboron trioxide, α-B2O3. The ab initio modelling of the apVDOSes, described in section 3.2, was performed under the assumption that the crystalline phase, α-B2O3, is trigonal and thus exclusively composed of BO3 domains. In the molybdate glasses, the RMC analysis, described in section 3.1, has revealed that with the increasing amount of B2O3, there is an increase in the amount of the BO3 domains and a concomitant decrease in the amount of the BO4 domains. Thus, from the point of view of the local structure around the boron atom (as characterised by the average B–O bond length, B–O–B and O–B–O bond angle and B coordination distributions revealed by the RMC analysis) the molybdate glass, 20MoO3 + 30Nd2O3 + 50B2O3, resembles the crystalline low-pressure trigonal α phase of B2O3 [113] the most and the high-pressure orthorhombic β phase of B2O3 [114] the least. Interestingly, a boron-11 NMR study of the structure of B2O3 glass at high pressure has revealed that while all borons are tri-coordinated at 1 atm, the fraction of tetra-coordinated boron increases with pressure, being about 5% and 27% in the B2O3 glass quenched from melts at 2 and 6 GPa, respectively. Moreover, the fraction of boroxol ring species was observed to increase with pressure up to 2 GPa and decrease with further compression up to 6 GPa [115]. Two densification mechanisms related to boroxol ring formation were put forward. In the lower pressure regime (below 2 GPa), the mechanism would involve the reduction of bond angle with pressure and thus the subsequent formation of ring component (smaller B–O–B angle) from the non-ring component (larger bond angle), which decreases the free volume and leads to an increase in the coordination number of borons with pressure from 3 to 4 [115]. At higher pressures, above 6 GPa, the mechanism would involve a decrease in boroxol ring concentration with pressure and the concomitant increase in the non-ring concentration and 4-coordinated boron [115]. Inspired by the boron-11 NMR study described above, one can propose that upon the progressive addition of glass-forming B2O3 to molybdates the effective volume around oxygen-coordinated boron atoms in the glass increases, thereby effectively acting as decreased pressure and decreasing the coordination number of borons from 4 to 3. Moreover, in a reverse trend to that proposed by the boron-11 NMR study, with increasing effective volume, the boroxol ring component concentration should decrease as indicated by the increasing B–O–B angle (see figure 3). Indeed, as the amount of glass-forming B2O3 increases in the series of three molybdate glasses under consideration the average B–O distance, as revealed from the RMC analysis, decreases from 1.43 to 1.40 Å (see table 1 in section 3.1) and the average coordination of the boron increases from 3.15 to 3.30 (see figure 2 in section 3.1). Moreover, as clearly visible in figure 3(a), the B–O–B angle distribution shifts from 122 degrees towards 138 degrees with increasing concentration of the B2O3 glass former in the molybdates, which would suggest a decreased concentration of the boroxol rings. These values need to be contrasted with average B–O bond distances for the low-pressure trigonal α phase of B2O3 [113] and high-pressure orthorhombic β phase of B2O3 [114], being 1.373 and 1.475 Å respectively. Using Zachariasen's bond-length-to-bond-strength correlation table [114], the B—O bond strength in the β phase is less than in the α phase of B2O3. In consequence, the stretching frequency of the B–O bond in a local structure that is closer to the trigonal BO3 domain (both in the α phase of B2O3 and molybdate glass) will be higher than in a local structure resembling closer a BO4 domain. With the stretching mode kinetic energy dominating the average kinetic energy of the boron in both α phase of B2O3 and any molybdate glass, the trend visible in the first row of table 6 is thus quite plausibly explained.
To sum up, the average kinetic energy of the boron in the α phase of B2O3 at natural abundance is lower than the ab initio prediction for this phase with no isotopic disorder assumed but slightly higher than the average kinetic energy of isotopically pure (11B) boron in all molybdate glasses under consideration. Moreover, the difference between the average
boron kinetic energy in the α phase of B2O3 and in molybdate glasses decreases systematically with the increasing amount of the glass-forming B2O3. This means that the isotopic mass disorder (and the force-constant disorder coupled to it) of the boron in the relatively undistorted local structure of a trigonal BO3 domain in the crystalline structure of the α phase of B2O3 induces slightly less phonon softening than the positional disorder of the boron in a relatively more distorted trigonal BO3 domain within the structure of a molybdate glass. Moreover, this positional disorder-induced phonon softening is increased by the increased amount of the glass forming B2O3 present in a molybdate glass.
There are reasons to believe that the trends observed for the boron in molybdate glasses, described above, are not entirely correlated with the trends observed for the oxygen. To start with, let us note an obvious difference between the two nuclides: the average atomic mass of the oxygen is 50 per cent higher than the one of the boron. In consequence, the oxygen should be relatively less sensitive (by a factor of  ) to any disorder-induced changes in the apVDOS that would originate from modifications of the high-frequency local modes. The second difference between the oxygen and the boron is in the way the NCS technique measures their neutronic responses in the molybdate glasses. Whereas in the case of the boron the NCS response stems from boron present only in B2O3, the oxygen peak in the molybdate NCS spectra is a combination of neutronic responses coming from at least three different oxygen environments in three metal oxides, B2O3, MoO3 and Nd2O3. As the amount of strongly glass-forming B2O3 increases in the molybdates, the contribution of the signal stemming from the strong B–O bonds also increases and thus the CoG of the oxygen apVDOS should shift progressively towards the higher energies thus increasing the NMD width of the oxygen. Indeed, such a trend is visible in the second row of table 6. Most likely, however, the increase of the NMD width of the oxygen is a result of two or more opposite trends superimposed on each other. From the RMC analysis, we obtain a slightly decreasing Mo–O bond length, from 2.0 to 1.92 Å, (see table 1) as a function of a decreasing amount of MoO3 in the molybdates. Thus, from the analysis of the Mo–O bond length alone, one should expect a slightly increasing NMD width of the oxygen bound to the molybdenum. The value of the O–Mo–O angle, inferred from the RMC analysis, decreases from 90 degrees to 80 degrees with the increasing amount of the B2O3 (see figure 3). If we treat the O–Mo–O fragment in the molybdate structure as an isolated triatomic C2V
molecule with the structure T-A-T (terminal, apical, terminal), then we should expect the frequency of the symmetric (
) to any disorder-induced changes in the apVDOS that would originate from modifications of the high-frequency local modes. The second difference between the oxygen and the boron is in the way the NCS technique measures their neutronic responses in the molybdate glasses. Whereas in the case of the boron the NCS response stems from boron present only in B2O3, the oxygen peak in the molybdate NCS spectra is a combination of neutronic responses coming from at least three different oxygen environments in three metal oxides, B2O3, MoO3 and Nd2O3. As the amount of strongly glass-forming B2O3 increases in the molybdates, the contribution of the signal stemming from the strong B–O bonds also increases and thus the CoG of the oxygen apVDOS should shift progressively towards the higher energies thus increasing the NMD width of the oxygen. Indeed, such a trend is visible in the second row of table 6. Most likely, however, the increase of the NMD width of the oxygen is a result of two or more opposite trends superimposed on each other. From the RMC analysis, we obtain a slightly decreasing Mo–O bond length, from 2.0 to 1.92 Å, (see table 1) as a function of a decreasing amount of MoO3 in the molybdates. Thus, from the analysis of the Mo–O bond length alone, one should expect a slightly increasing NMD width of the oxygen bound to the molybdenum. The value of the O–Mo–O angle, inferred from the RMC analysis, decreases from 90 degrees to 80 degrees with the increasing amount of the B2O3 (see figure 3). If we treat the O–Mo–O fragment in the molybdate structure as an isolated triatomic C2V
molecule with the structure T-A-T (terminal, apical, terminal), then we should expect the frequency of the symmetric ( ) and the antisymmetric (
 ) stretching mode to be proportional to the square root of the expression,
  respectively, where
  and
and  are the masses of the terminal (oxygen) and apex (molybdenum) atoms, respectively, and α is the O–Mo–O bond angle [116]. Thus, with a decrease of the O–Mo–O angle from 90 degrees to 80 degrees, the frequency of the
  mode should decrease and that of the
  mode should increase. Assuming that the effective force constants of both modes are similar, the net effect should be a very slight increase in the ratio of
  to
to  from 1 at 90 degrees to ca. 1.025 at 80 degrees with the concomitant very slight (of the order of two per cent) increase of the CoG of the apVDOS of the oxygen. Moreover, the RMC analysis reveals that Nd–O distance slightly increases, from 2.8 to 2.9 Å, with the increasing amount of B2O3 (see table 1) which may account for a slight decrease of the NMD width of the oxygen bound to the neodymium.
Unlike in the case of the boron and the oxygen, where the trends are quite strongly pronounced, the NMD widths of Mo and Nd are, within 1-STD, almost constant as a function of the increasing amount of the glass-forming B2O3. In fact, the RMC analysis reveals that Mo–O distance is actually decreasing with the increasing amount of B2O3 and thus an increase of the NMD width of the molybdenum should rather be expected. There is, however, still a lot of correlations contained in trends connecting the O–Mo–O, Mo–O–Mo, and B–O–Mo angles and the kinetic energy of the molybdenum that may account for the lowering of the kinetic energy of the molybdenum with the increasing amount of the B2O3. As discussed above in the case of the oxygen, the O–Mo–O angle, inferred from the RMC analysis, decreases from 90 degrees to 80 degrees with the increasing amount of the B2O3, and this should lead to a slight (of the order of two per cent) increase in the kinetic energy of the stretching vibrations in this pyramidal assembly of the oxygen and molybdenum atoms. Similar reasoning would have lead to an increase in the kinetic energy of the stretching mode in Mo–O–Mo pyramidal assembly of the O and Mo atoms, and this increase would have been even higher due to the fact that the terminal and apical atoms in this configuration are swapped with respect to the O–Mo–O. However, as revealed by the RMC analysis (see figure 2), Mo–O–Mo angle remains approximately constant (147 degrees) as a function of the amount of the B2O3 glass-former. Finally, the B–O–Mo angle decreases from 137 to 124 degrees with the increasing amount of the B2O3 glass-former, as revealed by the RMC analysis (see figure 3). Thus, if the B–O–Mo angle represents a real bonding scenario an asymmetric molecular fragment of this type would experience a degree of variation of the kinetic energies of the boron, oxygen and molybdenum with the decreasing B–O–Mo angle. On the whole, the NCS method reveals correlations between the kinetic energy of the molybdenum and the local-structure disorder in the molybdate glasses that are only partially captured by the RMC analysis.
Also in the case of the neodymium, the constancy of the width of the momentum distribution as a function of the amount of the glass-forming B2O3 is also most likely a result of multiple trends concerning the bond angle and distances in which the neodymium is involved. However, similarly, as in the case of the molybdenum, only one trend is revealed by the RMC analysis, the increase of the average Nd–O distance from 2.8 to 2.9 Å (see table 1) with the increasing amount of B2O3 which should lead to the concomitant decrease in the NMD width of the neodymium.
Equipped with the basic knowledge about the correlations between the parameters quantifying the local disorder obtained from the RMC analysis and the NMDs obtained from the NCS experiments, we can set up a scale of disorder in the molybdate glasses based on the assumption that the NMDs of the nuclei can be placed on a scale spanned by two theoretical predictions describing two extreme situations. The first of them is described by the Maxwell-Boltzmann momentum distribution for a completely disordered system. In this case, there is no confining potential, the potential energy is zero, and the nuclear kinetic energy,  is equal to the total energy of gas of non-interacting particles,
  and thus
  The other extreme situation is under the assumption that no recrystallisation takes place after melting the mixture of the crystalline parent metal oxides and can be described as a compositional average of NMDs of nuclei with widths predicted by the harmonic lattice dynamics ab initio simulations for B2O3, MoO3, and Nd2O3. Importantly, for setting up both scales, the average atomic masses of the nuclei will be used. The results of this procedure for the molybdate glasses are shown in figure 9. To start with, let us remark that in the case of the neodymium, there is not much change, in terms of its position on the scale, as a function of the amount of the glass-forming B2O3. It is placed firmly between the Maxwell-Boltzmann and ab initio prediction. This result is a reflection of the fact that the neodymium, being the heaviest nucleus under consideration, behaves nearly as a classical particle with the extent of space and momentum delocalisation dominated by the true thermodynamic temperature solely, not by the nuclear quantum dynamics in the presence of any underlying local effective potential. Thus, changes in the shape of the local binding potential dictated by the changing local environment around the neodymium are not much reflected in its NMD.

Figure 9. The disorder scale for the molybdate glasses based on the amount of the softening of the NMD widths of their constituent nuclei: (a). 20MoO3 + 30Nd2O3 + 50B2O3, (b). 40MoO3 + 30Nd2O3 + 30B2O3, and (c). 50MoO3 + 25Nd2O3 + 25B2O3. The charts for each nucleus are composed of three bars. The NMD width measured in an NCS experiment (pink bar) is placed between the upper limit of the NMD scale set by the ab initio prediction (white bar) and the lower limit of the scale based on the Maxwell-Boltzmann distribution (blue bar). See text for details.
Download figure:
Standard image High-resolution image
The second heaviest nucleus, the molybdenum, is subject to a non-monotonic trend. According to the scale, it is most disordered in the case of the molybdate glass with the medium amount of the glass-forming B2O3, and least disordered in the molybdate glass with the smallest amount of the glass-forming B2O3. For the oxygen, also the most disordered state is achieved in the case of the smallest amount of the glass former added to the molybdate glasses. However, the lightest nucleus, the boron exhibits the highest degree of disorder for the highest amount of the glass former B2O3 present in the molybdate glass 20MoO3 + 30Nd2O3 + 50B2O3. These complicated trends, some of which related to the softening, and others to the hardening of the NMD width, are not an isolated case. In the recent theoretical study on 5-component body-centred cubic random refractory high-entropy alloys (HEAs) [29], ab initio calculations were employed in order to systematically study the impact of force constant and mass fluctuations on the phonon spectral functions. The set of studied alloys included MoTa, MoTaNb, MoTaNbW, MoTaNbWV, VW, VWNb, VWTa, VWNbTa, VTaNbTi, VWNbTaTi, HfZrNb, and HfMoTaTiZr. It was found that, in order to reproduce the phonon-related properties of these technologically relevant materials, it is crucial to include both mass and force constant fluctuations. Mass fluctuations were found to dominate the phonon broadening. However, the neglect of force constant fluctuations created artificial predictions of phonon band gaps. Moreover, in all of the considered alloys, the force-constant fluctuations were found to counteract the mass disorder-induced fluctuations, a feature which could be understood by noting that the considered elements form the early transition metal series. In such a series, increasing the band filling by going from left to right in the periodic table increases both the atomic masses and the interatomic bonds, and in consequence, the force constants [29]. Importantly in the context of the NCS measurements presented in this work, the chief quantitative result of the study on HEAs was the strong phonon broadening observed in the range of mid-to-high frequencies (above ̃ 4 THz) [29]. Such broadening, if present in molybdate glasses along with mode softening, may affect different modes differently, with some of them being symmetrically, and others asymmetrically broadened. Symmetric and asymmetric broadening of components of the apVDOSes affects the NMD widths differently, thereby providing a qualitative explanation for complicated trends observed in this work.
Based on the initial assessment of the disorder-induced modification of the apVDOSes of B, O, Mo, and Nd in molybdate glasses, we can compare the force-constant magnitude distributions obtained for the molybdate glasses and their parent metal oxides. In the first step of this comparative analysis, we assume that one can represent the apVDOSes of all constituent nuclei with effective Einstein models. One can then solve numerically the formula relating the NMD width, measured in an NCS experiment at temperature T, for an effective Einstein energy  using
using ![${{\sigma }_{E,M}}^{2}\left(T\right)=\tfrac{2M}{3{\hslash }^{2}}{\omega }_{0}\left[\coth \left(\tfrac{{\omega }_{0}}{2{k}_{B}T}\right)\right].$](https://content.cld.iop.org/journals/2399-6528/4/9/095027/revision4/jpcoabb8eeieqn26.gif) Having the solution,
Having the solution,  we finally get the magnitude of the effective force,
  As the solution,
  is obtained numerically, instead of analytical error propagation, we use a Monte Carlo procedure to obtain the errors of
  from errors of
  In this procedure, we assume that the distribution of
  is normal. Interestingly, this assumption does not automatically lead to the conclusion that the distribution of the values of
  will also be normal. In fact, we tested eight different probability distributions (Half-normal, Kernel, Nakagami, Normal, Rayleigh, Rician, tLocationScale, and Weibull) using a bespoke piece of software written in Matlab. All of these distributions provide fairly good fits to the histograms of
  data generated in the Monte Carlo procedure, providing slightly different values of the mean and the standard deviation values, however. Thus, in order to avoid ambiguity related to the choice of the distribution of the force-constant values, the values of the mean and the standard deviation were calculated numerically, directly from the generated histograms of
Knowing the force-constant distributions calculated for boron-11 and average atomic masses of all other constituent nuclei, one can assess the force-constant disorder induced by the isotopic mass disorder. Bearing in mind that the values of the widths of momentum distributions are most sensitive to local high-frequency modes of vibration, for which the effective masses are equal to the masses of the isolated nuclei, and assuming harmonic approximation, the NMD widths can be assumed to scale with the mass of the nuclei according to the formula, ![${\sigma }_{E,M}\left(T\right)/{\sigma }_{E,M^{\prime} }\left(T\right)=\sqrt[4]{M/M^{\prime} }.$](https://content.cld.iop.org/journals/2399-6528/4/9/095027/revision4/jpcoabb8eeieqn36.gif) In other words, knowing the value of the width of an NMD for the average atomic mass M one can calculate the value for a nuclear isotope of mass
In other words, knowing the value of the width of an NMD for the average atomic mass M one can calculate the value for a nuclear isotope of mass  The values of
  and their standard deviations
  are then calculated using the same Monte Carlo procedure as their counterparts calculated based on natural isotopic mass abundancies. Finally, the isotopic mass disorder-induced force-constant disorder in molybdate glasses is quantified in terms of average values
  and their standard deviations
  calculated as weighted (over abundancies of individual isotopes) values from sets of force-constant magnitudes
  at T = 300 K. The average values of
  and their standard deviations
  are shown in table 7.
Table 7. The average values of  and their standard deviations
  in molybdate glasses at T = 300K for the boron-11 isotope and the average atomic masses of the oxygen, molybdenum and neodymium. The sum of
  and its standard deviation are given in the last row. See text for details.
 (eV Å−2) (eV Å−2) | |||
|---|---|---|---|
| Nucleus | 20MoO3 + 30Nd2O3 + 50B2O3 | 40MoO3 + 30Nd2O3 + 30B2O3 | 50MoO3 + 25Nd2O3 + 25B2O3 |
| B | 1.1 ± 0.2 | 1.3 ± 0.2 | 0.7 ± 0.2 |
| O | 1.5 ± 0.4 | 1.2 ± 0.3 | 0.6 ± 0.3 |
| Mo | 8.2 ± 0.4 | 6.6 ± 0.4 | 13.2 ± 0.4 |
| Nd | 10.6 ± 0.4 | 10.6 ± 0.4 | 10.6 ± 0.4 |
| total | 21.4 ± 0.7 | 21.0 ± 0.7 | 25.1 ± 0.7 |
Weighted (over the abundancies of respective isotopes) average values  and their standard deviations
  turn out to be identical, within the precision limits of the NCS method, to their counterparts listed in table 7. There are several reasons for this. Firstly, the isotopic mass disorder for the oxygen is negligible, and one can safely assume that its isotopic mass is identical to the average atomic mass. Secondly, all molybdate samples under consideration were enriched with boron-11 isotope. As the natural abundance of the boron-11 isotope is eighty per cent, the weighted average has a value dominated by the values obtained for this isotope. Furthermore, in the case of the molybdenum and neodymium, the mass variance, g, is 0.598 × 10⁻³ and 0.232 × 10⁻³, being two and six times lower than the value for the boron, respectively.
Table 7 contains some important results. Firstly, the inspection of the sum of all the forces clearly shows a systematic softening of the structure with the increasing amount of the glass-modifier B2O3. Secondly, the values of the standard deviations of the force constant distributions of all nuclei in all three molybdate glasses are at least one order of magnitude higher than their counterparts calculated for the nuclei present in the parent metal oxide systems, clearly indicating a greater degree of disorder in glasses. Finally, the biggest contributions to the total average effective mean force in all three molybdates are from the mean effective forces acting on the molybdenum and neodymium, with the forces listed for the boron and the oxygen almost an order of magnitude lower. This result clearly demonstrates the potential of the NCS method to elucidate mean forces in complicated heterogeneous materials and to dissect them in a mass-resolved manner. One could namely envisage a systematic optimisation protocol, whereby series of NCS measurements are performed for a series of amorphous materials with systematically changing amounts of modifiers or glass formers. In such a protocol, the crucial isotopic species that shape material properties could be much easier identified owing to the mass-selective nature of the NCS. Clearly, such a novel protocol would open up new ways of engineering and optimisation of functional materials.
The values of the average effective mean force-constants and their sums obtained in this work for the three molybdate glasses compare favourably against values tabulated in the literature for other oxide glasses [117–124] but a study that mostly resembles our work has been performed by Bridge and Patel [125]. The authors presented a detailed analysis of ultrasonic relaxation in the entire vitreous range of the glass system MoO3-P2O5 (0 to 83mo1% of MoO3). The shape of the relaxation spectra was found to be strongly composition-sensitive and correlated with the elastic properties of the glass system and the magnitudes of the assumed mean cation-anion stretching force constant. The authors assumed that a relationship exists for multicomponent oxide glasses (assumed to be three-dimensional networks) with the force-constant magnitude being averaged over many bond types. The average force constant, representing the entire Mo–P–O glass network, was composed of the mean force constants for the respective types of network bond,  for the P-O network bonds and
  for the Mo–O network bonds. The value of the force constant adopted in the study by Bridge and Patel for
  was 13.38 eV Å−2, which is a value very similar to 13.2 ± 0.4 eV Å−2, obtained in our work for the molybdate glass with the smallest amount of the glass-forming B2O3. Moreover, the average force constant magnitudes obtained by Bridge and Patel for MoO3-P2O5 glasses with the MoO3 content of 29.2, 37.5 and 47.4 mol% were 23.8, 22.6, and 21.1 eV Å−2, respectively. Extrapolating the values by Bridge and Patel by fitting a linear trend, we get 25.2, 22.2, and 20.8 eV Å−2, for MoO3-P2O5 glasses with 20, 40 and 50 mol% of MoO3 respectively. Comparing these values to values obtained in this work, being 21.4 ± 0.7, 21.0 ± 0.7 and 25.1 ± 0.7 eV Å−2 for the molybdate glasses with of 20, 40 and 50 mol% of MoO3 respectively, one can see that the trends are reversed. Namely, whereas in the MoO3-P2O5 glasses the average force constant magnitude softens, in the MoO3-Nd2O3-B2O3 glasses it hardens with an increasing amount of MoO3. Both P2O5 and B2O3 are considered to be strong glass formers [126]. The role of a network modifier in the MoO3-Nd2O3-B2O3 glasses is played by Nd2O3 [25]. In light of these facts, the contrasting trends observed for the average force constant values as a function of the MoO3 content in both types of oxide glasses seem to be yet another manifestation of the fact that molybdenum oxide can act both as a very strong network modifier and a non-traditional network co-former, depending on its molar concentration and the composition of the glass [126].
4. Conclusions and outlook
A global approach, consisting of concurrent application of neutron Compton scattering, neutron diffraction and ab initio modelling, has been applied for the characterisation of the positional, isotopic mass and force-constant disorder of molybdate glasses and their parent metal oxides systems. Three molybdate glass systems composed from the same parent metal oxides with an increasing amount of glass-forming B2O3 have been chosen, in order to facilitate the analysis of disorder-induced modifications of phonon-related material properties.
Benchmarking of the ab initio simulated VDOSes and apVDOSes against the results obtained from NCS, and vibrational spectroscopy was performed for all three metal oxide systems. Mode softening was observed for all constituent nuclei in B2O3, MoO3, and Nd2O3, with the values of the widths of nuclear momentum distributions obtained from NCS experiments being consistently below the ab initio predictions. Due to the fact that isotopic mass variance of the oxygen is the smallest amongst all the nuclei, the observed softening of the momentum distributions was attributed to force-constant disorder. Contrary to the oxygen, in the case of the boron and, to some extent, the molybdenum, the softening most likely was caused by the isotopic mass disorder, due to their relatively large isotopic mass variance values. For Nd in Nd2O3, the anticipated magnitude of the thermal effect on softening of the nuclear momentum distribution was concluded to be negligible compared to the effect of the disorder. Importantly, these results also validated the modelling strategy assumed for the metal oxide systems under consideration, rendering the application of the quasi-harmonic approximation unnecessary in light of negligible anharmonicity in all three metal oxide systems under consideration.
The nuclear momentum distribution softening, observed for all nuclei in all three metal oxide systems provided inspiration for the establishment of a protocol for the calculation of the magnitudes of the average effective mean force constants of individual nuclei based on the atom-projected vibrational densities of states predicted by ab initio harmonic lattice dynamics. The simulations predicted two main effects. The first was the softening of the magnitudes of force constants with increasing temperature. The second effect observed was the 'temperature narrowing' of the distributions of the magnitudes of force constants of different isotopes belonging to the same atomic species. The source of this effect was identified as the Boltzmann population factor, differently weighting the expressions for the effective force constants for different isotopic species. The effect was strongest for oxygen atoms bound to different isotopic species of metals. The values of the mean effective force constants predicted from the ab initio simulations compared favourably against the values of average stretching force constants obtained from the analyses of Raman and infrared spectra and tabulated in the literature.
The comparison of the results gathered for the diboron trioxide and molybdate glasses revealed that the isotopic mass disorder of the boron in the relatively undistorted local structure of a trigonal BO3 domain in the crystalline structure of the α phase of B2O3 induces slightly less phonon softening than the positional disorder of the boron in a relatively more distorted trigonal BO3 domain within the structure of a molybdate glass. Moreover, this positional disorder-induced phonon softening is increased by the increased amount of the glass forming B2O3 present in a molybdate glass.
Unlike in the case of the boron, where one clear trend was observed, in the case of the oxygen, at least three separate trends could be identified. From the RMC analysis, it was found that the Mo–O bond length and the O–Mo–O angle are decreasing with the decreasing amount of MoO3 in the molybdates. Whereas the first trend was shown to increase the magnitude of the momentum distribution widths, and thus the effective force constant of the oxygen, the second trend was shown to act in the opposite direction. Moreover, a third trend was identified by the RMC analysis of neutron diffraction data, revealing that the Nd–O distance slightly increases with the increasing amount of B2O3 which may account for a slight decrease of the NMD width and thus a decrease of the effective force constant of the oxygen bound to the neodymium.
In the case of the molybdenum and neodymium, the NCS and RMC analyses revealed a plethora of complicated trends, whose average action is to maintain the width of their nuclear momentum distributions nearly constant as a function of the amount of the strong-glass former B2O3 in the molybdate glasses.
Based on the gathered results, a scale of disorder in the molybdate glasses was set up. It relies on the assumption that for any disordered system, the amount of disorder-induced phonon softening can be bracketed by two extreme situations marking the two ends of the scale. The lower end of the scale corresponds to a completely disordered system with no confining potential whose momentum distribution is described by the Maxwell-Boltzmann momentum. The other end of the scale corresponds to the other extreme situation where, under the assumption that no recrystallisation takes place after melting the mixture of crystalline parent metal oxides, the nuclear kinetic energies correspond to the compositional averages of harmonic lattice dynamics predictions for individual metal oxide systems. Different constituent nuclei of the respective molybdate glasses are placed differently on this scale of the disorder. In the case of the neodymium, there is not much change, in terms of its position on the scale, as a function of the amount of the glass-forming B2O3 added to the molybdate glasses; a reflection of the fact that the neodymium, being the heaviest nucleus under consideration, behaves nearly as a classical particle with the extent of space and momentum delocalisation dominated by the true thermodynamic temperature. The molybdenum and the oxygen are most disordered in the case of the molybdate glass with the medium amount of the glass-forming B2O3, and least disordered in the molybdate glass with the smallest amount of the glass-forming B2O3. However, the boron exhibits the highest degree of disorder for the highest amount of the glass former B2O3 present in the molybdate glass 20MoO3 + 30Nd2O3 + 50B2O3. The scale of disorder established in this work can also be used to characterise other amorphous systems provided two conditions are met. Firstly, an amorphous system must be synthesised by melting a mixture of crystalline precursors. Secondly, no recrystallisation should take place upon melting the mixture of the precursors.
In a further step of the analysis, force-constant magnitude distributions were computed with the aim of comparing them with their counterparts obtained for the metal oxide systems. The sum (over all constituent nuclei) of all mean effective forces was found to be decreasing with an increasing amount of the glass-modifier B2O3 added, clearly showing a systematic softening of the structure of the glasses. Secondly, the values of the standard deviations of the force constant distributions of all nuclei in all three molybdate glasses were found to be at least one order of magnitude higher than their metal oxide counterparts, clearly indicating a greater degree of disorder in glasses. Finally, the biggest contributions to the total average effective mean force in all three molybdates were found to be from the mean effective forces acting on the molybdenum and neodymium, and the forces for the boron and the oxygen are almost an order of magnitude lower. This result clearly demonstrates the potential of the NCS method to elucidate mean forces in complicated heterogeneous materials and to dissect them in a mass-resolved manner. Clearly, this feature of the NCS technique opens up ways for diagnostics and engineering of functional materials by specifically targeting those nuclei that influence the total mean force the most. Finally, the obtained values of the total effective force constants compared favourably with the values of the effective stretching force-constants tabulated for a variety of glasses in the literature.
Taken together, both the experimental results reported and methodological advances envisaged here, pave the way towards more global characterisation and engineering of disordered functional materials in ways completely unprecedented and manners much more efficient than research conducted in the confinement of individual techniques.
Acknowledgments
The authors gratefully acknowledge the financial support from the UK Science and Technologies Facilities Council (STFC) granting the beamtime allocated to this experimental proposal (RB1890223). This work has benefited from the use of 7C2 beamline at Laboratoire Léon Brillouin (proposal No. 11479). This work was supported by PL-Grid Infrastructure and the PROMETHEUS high-performance computing facility (Grant ID: letticedynamics). The authors also acknowledge the computing resources provided by the STFC Scientific Computing Department's SCARF cluster.