Abstract
Myocardial perfusion imaging (MPI) using single-photon emission computed tomography (SPECT) gamma camera has been widely utilized for diagnosis and risk stratification of ischemic heart disease. Objective; The purpose of this study is to evaluate the effect of different correction methods on image resolution of MPI using the SPECT/CT hybrid system. Materials and Method; A total of 114 patients, 43 females and 71 males, patient’s raw data were processed and analyzed using Attenuation correction (AC), Scatter correction (SC), Both attenuation and scatter correction together (ACSC) and no-correction (NC). The short axis (coronal) slices resulted from the raw data reconstruction were chosen to draw the curve profile to identify the line spread function on the image to create the FWHM curve. Profile statistics were calculated to obtain the value of FWHM. Statistical analysis was made for the calculated FWHM values for AC, SC, ACSC, and NC to determine the best image resolution. Results; It turns out that applying the SC alone yields better FWHM value (8.13), compared to AC (8.77), and ACSC (8.72). Both AC and ACSC had better FWHM compared to NC (8.91). Conclusion; The study indicates that the intercomparison between the four avaliable correction conditions the image resolution has been significantly improved by using scatter correction, attenuation correction, and both methods together when compared with the non-corrected image. Also it was found that the scatter correction condition is superior in the image resolution than the other correction condition in the reconstruction of SPECT/CT myocardial perfusion images.

Original content from this work may be used under the terms of the Creative Commons Attribution 4.0 licence. Any further distribution of this work must maintain attribution to the author(s) and the title of the work, journal citation and DOI.
1. Introduction
The incidence and prevalence of cardiovascular disease (CVD), of which ischemic heart disease (IHD) accounts for the vast majority of cases, is increasing tremendously worldwide, regardless of the level of development. CVD is now the leading cause of death worldwide, responsible for more than five million deaths per year in the developing world. It is very important to obtain reliable diagnostic and prognostic tools for early and better evaluation of CVD [1–3]. Myocardial perfusion imaging (MPI) using single photon emission computed tomography (SPECT) gamma camera has been widely utilized for the diagnosis and risk stratification of IHD [4]. However, the attenuation of gamma rays by the patient’s body negatively affects the scintigraphic images in SPECT and produces inhomogeneous defects that decrease the accuracy of the test [5]. One of the main problems in SPECT imaging is the containment of scattered photons within the photopeak energy window used for projection images acquisition, which may occur either as coherent scatter or Compton scatter. Because of the low energy resolution of the NaI(Tl) scintillation crystal used in the imaging system (about 9%–10% full width at half maximum (FWHM) at 140 keV), it is unavoidable to detect some scattered photons in the photopeak window. The changed direction of Compton-scattered photons leads to inaccurate spatial information and reduces image quality. Thereby, applying scatter correction is essential to improve the image quality and enhance the diagnostic accuracy [6]. Tissue attenuation causes artifacts during the interpretation of myocardial perfusion imaging studies and lead to predominant increase of false positive studies [7]. Using computed tomography (CT) as a source of applying attenuation correction and scattering correction techniques increases the quality of the image by enhancing the image resolution [8].
Attenuation correction techniques have improved image quality and enhanced the sensitivity and specificity of myocardial perfusion imaging by decresing the effect of soft tissue attenuation. CT based attenuation maps obtained with current generation SPECT/CT hybrid systems represent a substantial improvement over traditional attenuation correction methods based on line source transmission as 153Gd as a source of transimission data.
Spatial resolution is a performance characteristic of scintillation cameras that describes its ability to resolve two separate point or line sources of radiation as separate entities. Spatial resolution is conventionally quantified either as the full width at half maximum (FWHM) of the response to a thin line source perpendicular to the long axis of the source or as the minimum separation of two sources that can just be distinguished from each other. Thus, a small width or separation corresponds to good or high spatial resolution [9]. Tomographic resolution is defined here in terms of the FWHM of the response function of the source, after reconstruction of a transaxial slice. It is measured in the reconstructed image. Tomographic resolution determines the sharpness of the image, as in all types of imaging [9]. The aim of this study was to evaluate the effect of different correction methods on image resolution of MPI from hybrid SPECT/CT system using FWHM as the main evaluation criterion.
2. Materials and methods
2.1. Patients
This retrospective study was approved by the local Institutional Review Board. Inclusion criteria were age ≥ 40 years, male or female, and BMI < 30 kg m−2. All patients underwent myocardial perfusion imaging (MPI) using SPECT/CT hybrid system (GE Discovery NM/CT 670).
2.2. SPECT/CT acquisition protocol
Patients were well-instructed prior to performing the test. They were asked to fast 4 h and advised to stop caffeine containing drinking tea, coffee and cola drinks as well as avoid chocolate at least 12 h before study. They discontinue beta-blockers for 72 h and calcium channel blockers for 48 h before the study. All patients were injected with 20–30 mCi Tc-99m tetrofosmin (Myoview, GE Healthcare AS; Oslo, Norway).
An interval of 20–45 min was allowed between injection and imaging. Patients were asked to lie down in the supine position with arms over their heads. SPECT acquisition parameters included: 30 frames, 20 s/each, body contouring orbital motion with step-and-shoot acquisitions and 180 rotation arcs (90 degrees for each head) from right anterior oblique (RAO) 45’ to left posterior oblique (LPO) 135’. The SPECT study was followed immediately by low-dose CT for AC and anatomical localization. CT is performed (110 kVp, 15 mAs) to obtain an attenuation map.
2.3. SPECT/CT reconstruction
After acquiring the raw data, images were checked for co-registration accuracy and applying re-registration if required. All images processed and reconstructed using Butterworth filter with cutoff value of 0.5. Also, the order, which is another parameter used to control the slope of the frequency curve can be specified for Butterworth filters to equal 10.0. Processing was performed on a Xeleris Workstation using Myovation cardiac software (GE Healthcare). Four different correction schemes with ordered subset expectation maximization (OSEM) with 5 iterations and 10 subsets were applied: attenuation correction (AC), Scatter correction (SC), Attenuation and Scatter Correction combined (ACSC) and No-Correction (NC).
2.4. Scatter correction
Dual-energy window (DEW) method was our choice for scatter correction, as it was considered the most appropriate as well as the main supported correction technique [6]. Jaszczak et al proposed this method for scatter correction. In which, an additional energy window below the photo-peak window is used to observe the number of scatter counts distort the total count within the photopeak window [10].
This method measures the scatter in an energy window immediately below the main energy peak window, then performing correction by subtracting the scatter image from the main peak image. The subtraction, which is a pixel-by-pixel operation, uses a weighting factor, which depends on the width of the main peak and scatter energy windows used.
2.5. Attenuation correction
The CT data was used for the correction of tissue attenuation in the SPECT scans on a slice-by-slice basis. Because the CT information is acquired in a higher resolution than the SPECT information, it is substantial to decrease the resolution of the CT data to match that of SPECT. In other words, the CT information is blurred to match the SPECT data. From the attenuation coefficient data acquired from CT, correction factors were determined, which can then be used to correct the SPECT data for attenuation, yielding the attenuation-corrected images.
2.6. Calculation of FWHM
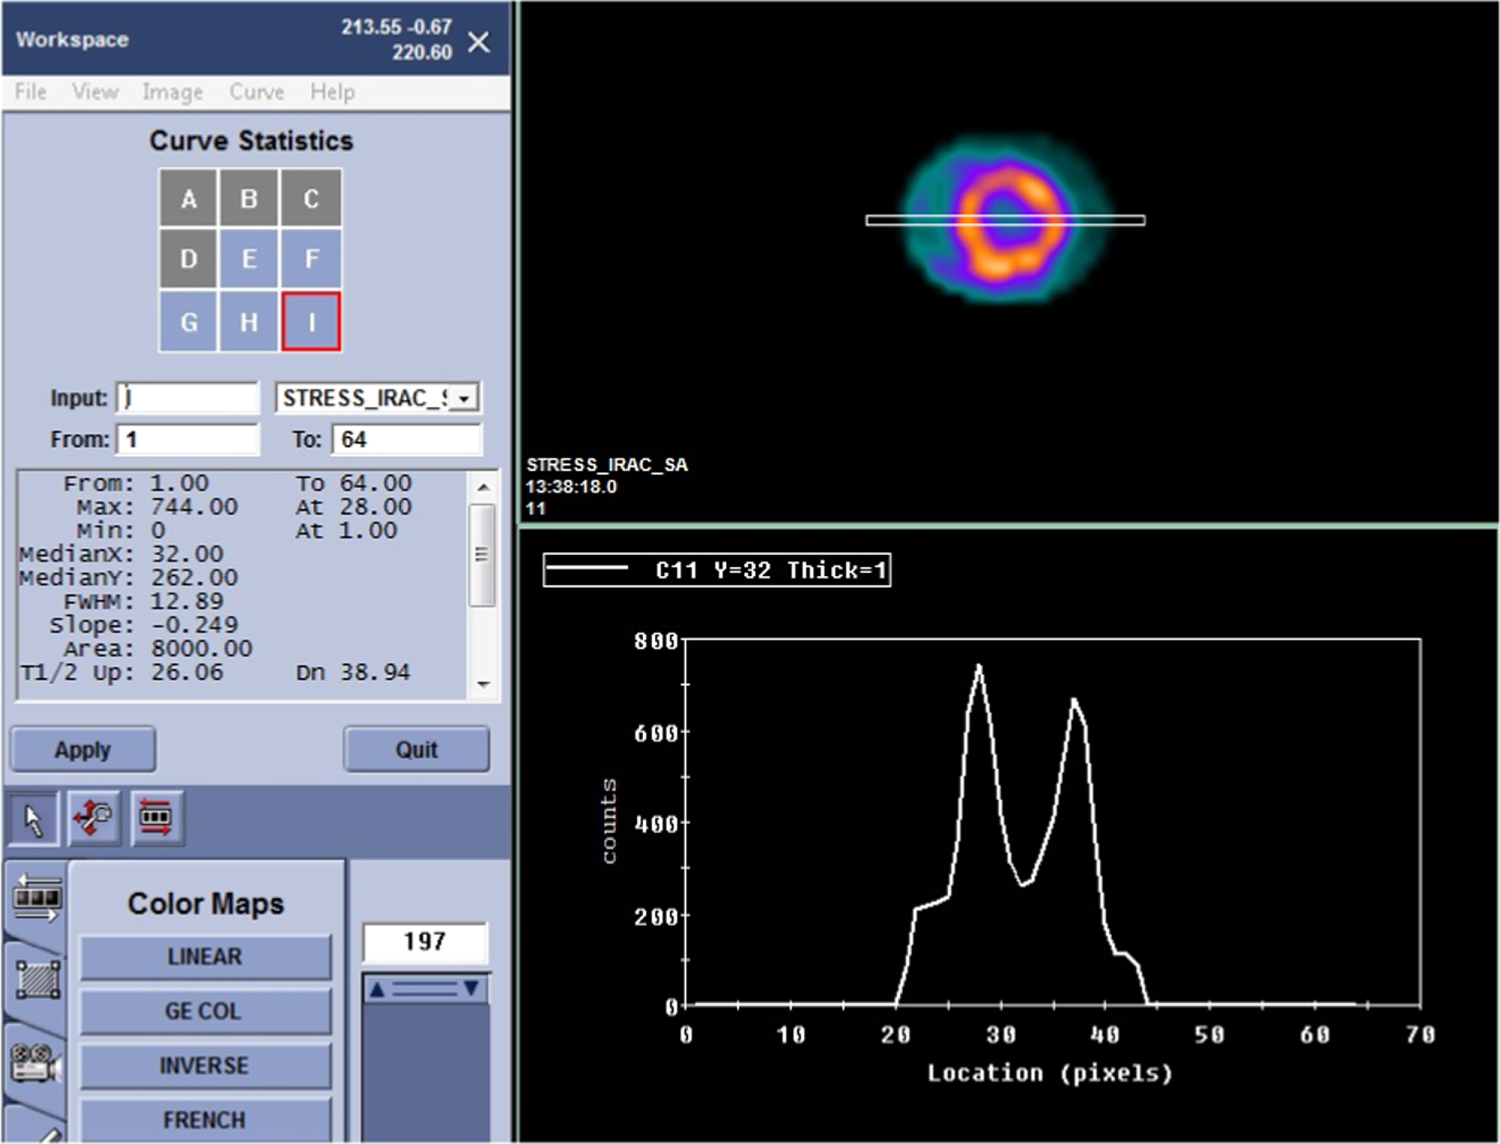
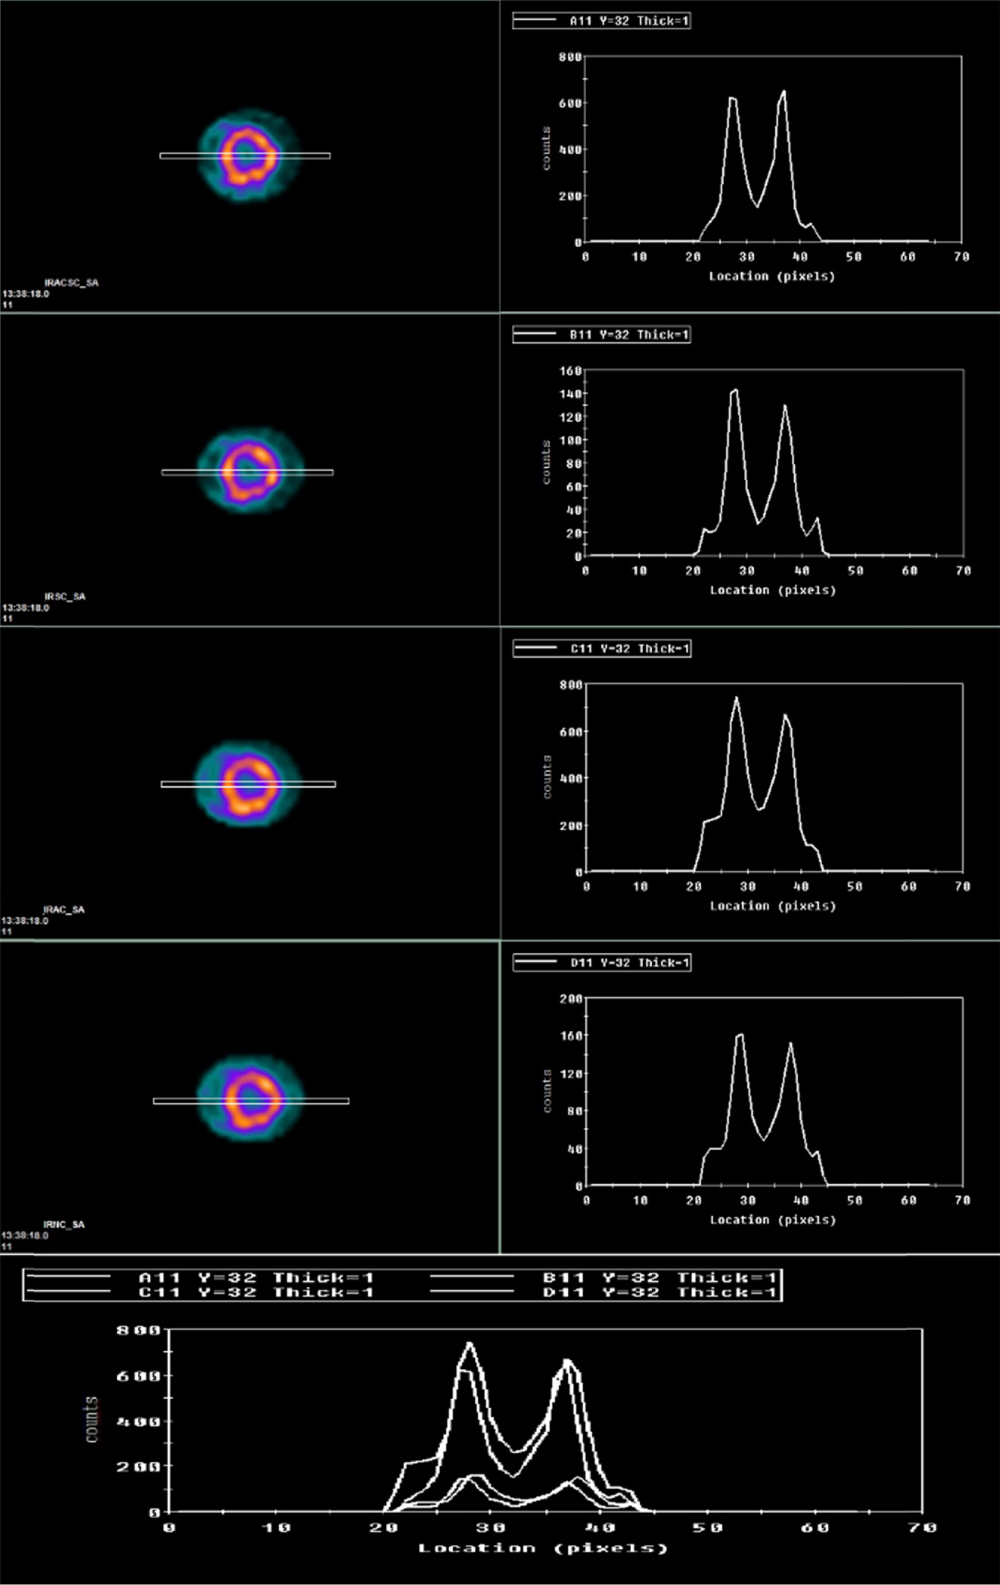
The spectral resolution of a peak is the width of that peak measured at half of the peak height. This is known as the FWHM (full width half maximum) resolution. Reconstruction resulted in vertical long axis (sagittal), horizontal long axis (transverse), and short axis (coronal) slices. The latter (short axis slices) for all methods were used to draw the curve profile (double lines) on the image and create the FWHM curve as shown in (figure 1) according to the counts denisty. Profile statistics were calculated to obtain the value of FWHM for all correction condition.
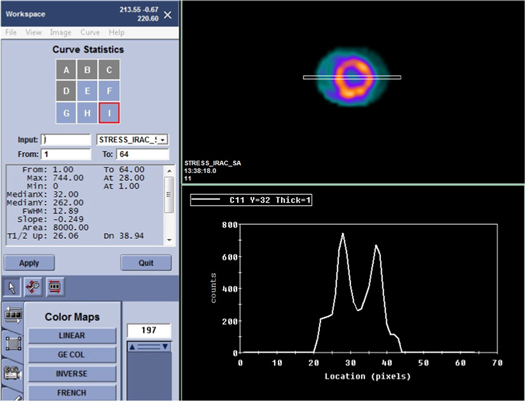
Figure 1. An example for FWHM measurment for attenuation correction.
Download figure:
Standard image High-resolution imageTo account for potential bias, three different independent nuclear medicine specialists, with 12-, 13- and 19-year, experience processed the raw data images and calculated the FWHM values for each correction method (figure 2). Their results were then received by a blinded statistician for data analysis.
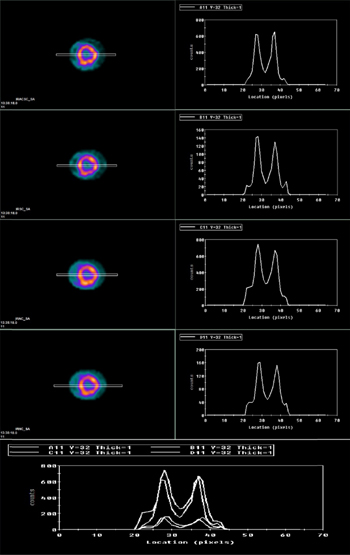
Figure 2. FWHM values for attenuation correction, scatter correction, both corrections together and no-correction.
Download figure:
Standard image High-resolution image2.7. Statistical analysis
Data were analysed with the Statistical Package for Social Science 23.0 (SPSS, IBM Corp, Armonk, NY). Descriptive statistics were run for frequencies, mean, median, standard deviations, and normality. The intraclass correlation coefficient (ICC) was used for assessing the closeness between the three nuclear medicine specialists FWHM measurements. Demographic data associations with our study outcome were examined using non-parametric tests. Since the data were not normally distributed, non-parametric tests were used. Freidman test was used, as alternative to the one-way ANOVA, with repeated measures to test for differences between groups. Predefined post hoc comparisons of FWHM between different correction methods were preformed when a significant difference was identified with Freidman test using the Wilcoxon signed rank test.
Based on our literature review, power analysis was conducted in G Power. Running a power analysis on repeated measures with four different correction techniques, a power of 0.80, an alpha level of 0.05, and a medium effect size (f = 0.20), the minimum required total sample size was 100 [11].
3. Results
A total of 114 patients (71 men and 43 women) with a mean body mass index (BMI) of 26.1 Kg m−2 (± 2.41) were included in our study (table 1). All patients were injected with 99mTc-tetrofosmin, the dose ranges were 20–30 mCi. AC, SC, ACSC and NC techniques were applied during processing and FWHM values were calculated for each method. Three different readings were obtained from each nuclear medicine specialists for each FWHM value. The average scores from the three nuclear medicine specialists were highly reliable (ICC = 0.990, 95% CI of 0.987–0.993, p-value < 0.0001).
Table 1. Patients’ baseline characteristics.
| Number | Percentage | |
|---|---|---|
| Male | 71 | 62.3 |
| Female | 43 | 37.7 |
| mean | SD | |
| Age, years | 53.5 | 6.32 |
| BMI, Kg/m2 | 26.1 | 2.41 |
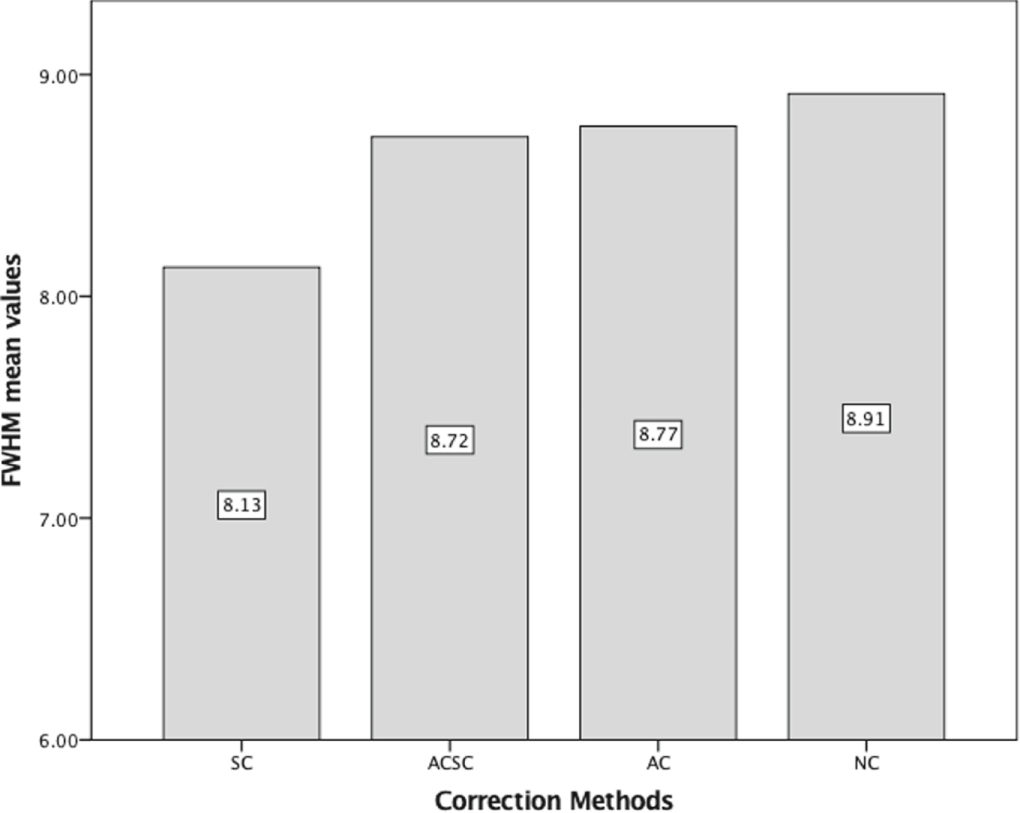
Table 2 illustrates the mean values for the studied correction methods as measured by each nuclear medicine specialists. The combined FWHM mean values and standard deviation (SD) for the studied four correction methods were AC (8.77, SD = 4.33), SC (8.13, SD = 4.22), ACSC (8.72, SD = 4.30) and NC (8.91, SD = 4.18) (figure 3). We did not record any significant associations between either gender or BMI and FWHM values for our correction methods table 3.
Table 2. Full width at half maximum (FWHM) mean values and their standard deviations.
| Correction method | Specialist 1a | Specialist 2a | Specialist 3a | Combinedb |
|---|---|---|---|---|
| ACSC,mean (SD) | 8.70 (0.42) | 8.81 (0.41) | 8.72 (0.4) | 8.72 (0.43) |
| AC, mean (SD) | 8.74 (0.42) | 8.86 (0.39) | 8.69 (0.45) | 8.77 (0.43) |
| SC, mean (SD) | 8.11 (0.44) | 8.22 (0.49) | 8.06 (0.41) | 8.13 (0.42) |
| NC, mean (SD) | 8.90 (0.48) | 8.89 (0.4) | 8.94 (0.47) | 8.91 (0.41) |
ACSC = Attenuation and Scatter correction combined.AC = Attenuation correction.SC = Scatter correction.NC = No correction. aNuclear medicine specialist. bAverage FWHM scores from the three independent nuclear medicine specialists.
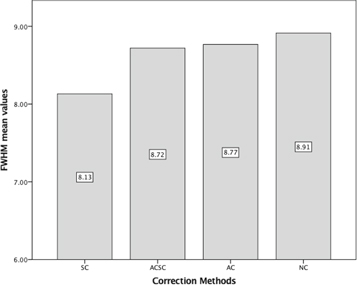
Figure 3. Bar chart illustrating FWHM mean values for the studied correction methods. AC = Attenuation correction, ACSC = Attenuation and Scatter correction combined, SC = Scatter correction, NC = No correction.
Download figure:
Standard image High-resolution imageTable 3. Full width at half maximum (FWHM) mean values and their standard deviations according to patient gender.
| Correction method | Female | Male | P-Value |
|---|---|---|---|
| ACSC, mean (SD) | 9.13 (0.43) | 8.47 (0.43) | Not significant |
| AC, mean (SD) | 9.19 (0.43) | 8.51 (0.44) | Not significant |
| SC, mean (SD) | 8.53 (0.41) | 7.89 (0.43) | Not significant |
| NC, mean (SD) | 9.1 (0.43) | 8.38 (0.44) | Not significant |
Friedman’s test for repeated measures showed a significant difference between the studied correction methods in terms of FWHM values (chi-square = 199.63, df = 3, p-value < 0.0001). Then, a non-parametric post-hoc test was conducted, in which we examined further the difference between each two groups. Based on positive ranks, a Wilcoxon Signed-Ranks test indicated that the SC technique achieved a significant lower FWHM values than ACSC (Z = −8.941, p-value < 0.0001), AC (Z = −9.269, p-value < 0.0001) and NC (Z = −9.270, p-value < 0.0001) methods. Moreover, FWHM values using ACSC technique were significantly lower compered to AC (Z = −2.204, p-value = 0.028) and NC (Z = −2.032, p-value = 0.041). Finally, when compared between AC technique and NC technique, FWHM values using AC technique were significantly lower (Z = −1.925, p-value = 0.045).
4. Discussion
Image resolution is a major physical parameter for evaluating the image quality. Improving image resolution yields better image quality which can significantly impact subsequent diagnosis and treatment strategies. Despite recent advances in dedicated instrumentation for cardiac imaging, myocardial perfusion using SPECT techniques remains a cornerstone in the management of ischemic heart disease. Improvements in SPECT hardware and software introduced significant corrections to the reconstructed images with the goal of improving image quality [12, 13].
Many methods for scatter correction of SPECT images has been proposed, some of them rely on a spectral analysis that is performed by additional energy windows in the 99 mTc spectrum, and others are based on a spatial analysis that is implemented by convolution and deconvolution procedures.
Also, the effect of attenuation not only leads to reduction of the uptake activity, it also causes inhomogeneous activity distribution due to the different paths of attenuation from the emission source to the detector. Some major artifacts such as increased activity in the lung and skin regions or tracer concentrations negatively in mediastinal part can be seen in uncorrected images. These artifacts have been overcome by applying attenuation correction by chang method, external transmission source or by CT [14].
Another study assessing the attenuation, resolution and scatter corrections on Cardiac SPECT images using a 3-headed SPECT system fitted with a 153Gd as an external transmission line source was used to acquire simultaneously emission and transmission data. They found that OSEM with AC + SC + RC outperforms FBP reconstructions and improve the accuracy of detection of CAD with cardiac perfusion SPECT reconstructions [15].
This results doesn’t match our results as it used an external line source for attenuation correction while in our study we use CT for attenuation correction in SPECT/CT hybrid system. Also we found that SC alone enhance the MPI resolution more than ACSC together. Other than that this study aimed at comparing OSEM reconstruction technique with FBP, while in our study we made an intercomparision between different correction method within OSEM reconstruction technique.
Although, CTAC significantly increases specificity of MPI [16], however, it may itself introduce new artefacts that can degrade the image quality and cause false positive results especially in the anterior wall of the heart [17], especially when the an¬atomic and scintigraphic images are misregistered, even minimally, in the process [18, 19]. For example, Huang et al reported 8 patients with false-positive CT-AC results and true-negative NC results in the anterior wall. They attributed these findings to either misregistration or normalization effect, such that attenuation correction produced an increase in the count density in the inferior wall (the region showing the greatest activity) and a relative decrease in other segments [16].
Till now, it is not clear which correction method, alone or in combination, is superior in improving image resolution (FWHM) for MPI.
In this work, we compared image resolution generated from 4 different correction methods of myocardial perfusion SPECT/CT studies. We demonstrated that scatter correction, alone, generated significantly smaller FWHM compared to either non-corrected images, or attenuation correction alone or in combination with scatter correction.
A finding that can partially explain these results is that the counts from AC are increased during normalization (figure 1) for both the target and background regions, which in turn affect the curve profile and decrease the image resolution by elevating FWHM values.
Several studies have shown that AC is beneficial in both obese and non-obese patients, and that the benefit is greater in patients with high BMI [20–22]. In this work, we included only patients with low BMI < 30 kg m−2 to avoid obese patients and eliminate extra soft tissue fat attenuation and artifacts as well as reduce any motion defects resulting from difficult breathing [23]. It was found that AC alone improved the image resolution when compared with non-corrected image.
Tamam M, found that AC with OSEM iterative reconstruction significantly improves the diagnostic accuracy of stress-only SPECT MPI in patients, but the improvement is significantly greater in obese patients [24]. These result matches with our results regardless the obesity because applying attenuation correction during image reconstruction enhances the image resolution by decreasing the value of FWHM in patient with BMI <30 kg m−2.
Other studies that applied both scatter and attenuation compensation showed a better image resolution with a mean increase of 25% compared to the uncorrected images allowing a better delineation of the lesions in the scatter and attenuation-compensated images [25]. More accurate and quantitative reconstructed tomographic slices were obtained and the capability for combining this information with correlative imaging, both anatomic and functional, from other modalities is also expected to improve [26].
Our study has some limitations, including, the assessment of only one physical parameter, which is the image resolution, without measuring the effect of corrections on other physical parameters of image quality. Also, we did not evaluate the interaction of these correction techniques with the clinical data and reporting accuracy.
On the other hand, the novelty of our study included, large sample size, acquired on the same machine model and processed uniformly using the same protocol. The clinical images have been used to determine and calculate a physical quantitative parameter for measurment of the image resolution (FWHM) as well as it was verified by involving three independent observers for calculating FWHM to avoid bias.
5. Conclusion
The study indicates that the intercomparison between the four avaliable correction conditions the image resolution has been significantly improved by using scatter correction, attenuation correction, and both methods together when compared with the non-corrected image. Also it was found that the scatter correction condition is superior in the image resolution than the other correction condition in the reconstruction of SPECT/CT myocardial perfusion images.