
Abstract
Expulsion refers to the widespread behavior of expelling intruders from the owners' territories, which has not been considered in current models on the evolutionary dynamics of cooperation so far. In the context of prisoner's dilemma, we present a simple game-theoretical model of expulsion in which punishing cooperators (i.e. expellers) are able to banish defectors from their own neighborhoods. In the mean-field limit, our theoretical analysis of prisoner's dilemma with expellers shows that the increment of either vacant sites ratio or time scale parameter between pairwise interaction process and strategy updating process can slow down evolutionary speed though defection is the only stable fixed point anyway. In more realistic spatial settings, we provide both analytical and numerical results for the limiting case where pairwise interaction dynamics proceeds much faster than strategy updating dynamics. Using the extended pair approximation methods and Monte Carlo simulations, we show that the introduction of expellers not only promotes coevolution of expulsion and cooperation by means of both direct and indirect domain competition but also opens the gate to rich dynamical behaviors even if expulsion is costly. Phase diagrams reveal the occurrence of frozen as well as dynamical stationary states, between which continuous or discontinuous phase transition may happen. For intermediate ranges, we investigate numerically the coupled interplay between pairwise interaction dynamics and strategy updating dynamics, and show that the validity of main results for the limiting case can be extended to this general case. Interestingly, there exists an optimal value of time scale parameter that results in the maximum fraction of altruistic players, which resembles the coherence resonance phenomenon in dynamical systems. Our results may provide insights into understanding coevolutionary dynamics of expulsive and cooperative behavior in social dilemma situations.
Export citation and abstract BibTeX RIS

Original content from this work may be used under the terms of the Creative Commons Attribution 3.0 licence. Any further distribution of this work must maintain attribution to the author(s) and the title of the work, journal citation and DOI.
1. Introduction
In pairwise social dilemma games, two players have to simultaneously choose between two strategies, i.e. cooperation (C) and defection (D). Mutual cooperation leads to a reward R, whereas mutual defection results in a punishment value P for each individual (R > P). If one player cooperates and the other one defects, then the cooperator obtains a payoff S, i.e. the sucker's payoff, whereas the defector gets a payoff T, which is often described as the temptation to defect (T > S). In the presence of social dilemmas, mutual cooperation should be preferred over unilateral cooperation (i.e. R > S) and over an equal probability of unilateral cooperation and defection (i.e. 2R > T + S). If T > R > P > S is further satisfied, we obtain the famous prisoner's dilemma [1], which is the most challenging pairwise social dilemma game for the evolution of cooperation [2]. Obviously, it is best for a rational individual to defect regardless of the coplayer's decision when facing such a dilemma. Indeed, defection is the only strict Nash equilibrium [3], and also the evolutionarily stable strategy [2, 4, 5] in the one-short prisoner's dilemma. However, if both players choose defection then their individual income is lower than that obtained for mutual cooperation when maximum overall payoff is shared equally. Meanwhile, we observe that cooperation is ubiquitous in nature as well as human society [6–8]. The evolutionary puzzle here arising is how natural selection can lead to cooperation [9].
Until now, five fundamental rules, i.e. kin selection [10, 11], direct reciprocity [12], indirect reciprocity [13], network reciprocity [14–16] and group selection [17, 18], are reported to be able to enforce the evolution of cooperation in different contexts [19]. Of the five mechanisms for the evolution of cooperation, considerable attention from physics community has been paid to network reciprocity [20–22]. In evolutionary games on graphs, players occupy the vertices of a graph. The edges determine who interacts and competes with whom. Following the pioneering work of Nowak and May [14], evolutionary prisoner's dilemma has been explored on various spatial networks [23–25] and different social graphs [26–33]. Nowak and May show that spatial prisoner's dilemma with best-take-over rule (deterministic evolutionary rule) and synchronous updating pattern (discrete-time evolution) can generate chaotically changing patterns by which cooperators are able to coexist with defectors indefinitely [14]. Szabó and Tőke subsequently extend spatial prisoner's dilemma with Fermi-function-style rule (stochastic evolutionary rule) and asynchronous updating pattern (continuous-time evolution) [23], and observe that such stochasticity just simplifies the evolutionary dynamics, but does not alter the basic finding that cooperators and defectors can persist permanently in spatial networks. Masuda and Aihara find that small-world topology realizes rapid convergence to the equilibrium with slightly suboptimal level of cooperation in comparison with spatial networks [27]. Moreover, Santos and Pacheco reveal that scale-free networks provide the most favorable conditions for the evolution of cooperation [28]. Recently, Gómez-Gardeñes et al show that multiplex networks enlarge the coexistence regions of cooperators and defectors: Cooperation is promoted in parameter regions where it cannot survive in the monoplex scenario at the expense of a moderate decrease of cooperation in those where it can dominate [31]. On the whole, the survival or prevalence of cooperators on graphs is mainly due to the formation of network clusters by which cooperators are able to protect themselves against invasion of defectors. Meanwhile, a large amount of works dedicate to studying cooperation dynamics by the interplay between network reciprocity and other additional mechanisms [34–45]. For instance, Perc et al discuss how the annealed [34] and quenched [35] randomness of payoff affects the evolution of cooperation in spatial prisoner's dilemma. They find that the annealed randomness of payoff can be beneficial for the evolution of cooperation in a way similar to coherence resonance within the framework of noise-driven dynamical systems [46], while the quenched one promotes the evolution of cooperation owing to social diversity: high-ranking wealthy players can form robust cooperative clusters with low-ranking obedient neighbors. Szolnoki and Perc investigate the spatiotemporal dynamics of cooperation in spatial networks with multiple populations, and find the sustenance of cooperation under adverse conditions that could never be bridged by network reciprocity alone as well as the spontaneous emergence of cyclic dominance, where defectors of one population become prey of cooperators in another population, and vice versa [45]. In recent years, there has also been a growing interest in evolutionary games on dynamic networks [47–52]. In this framework, individuals are able to not only change their strategies but also adjust their social ties in response to game outcomes. The main finding from these studies is that the coevolutionary dynamics of individual strategies and network structures can lead to robust cooperation in social networks. Besides the five fundamental mechanisms, voluntary participation [53, 54], costly punishment [55, 56] and destruction effects [57] are also reported to support the evolution of cooperation in different situations.
On the other hand, expulsion behavior is frequently observed in amphibians, reptiles and mammals mainly for the purpose of resource occupation [58]. For example, the red-backed salamanders, Plethodon cinereus, use pheromonal markers, visual aggressive displays, and bites in expulsion of intruders from areas in which the residents occur [59–61]. The mountain spiny lizards, Sceloporus jarrovi, use aggression to defend their territories from conspecifics by expressing a series of behaviors with increasing intensity: pushups, fullshows, shudders, approaches, face-offs and charges which are usually accompanied by bites [62–64]. The Mongolian gerbils (Meriones unguiculatus) trigger the expulsion of their family members with the highest reproductive capacity to compete for reproduction within the groups [65, 66]. Other examples include parasite expulsion (e.g. the nematode Trichinella spiralis are expelled from gastrointestinal tract by immune system due to the contribution of both mucosal mast and goblet cells, and the mediators they produce [67]), social ostracism (e.g. three-spined sticklebacks prevent other sticklebacks if those individuals emit cues, which indicates that they have been infested by parasites, from joining their social groups [68]), and so on. In fact, expulsion behavior is common in not only nonhuman animal groups but also human society [69–76].
Despite the availability of such abundant empirical data of expulsion behavior, we are still unclear its evolutionary origin as well as its significance for the cooperation among individuals in the presence of social dilemmas. In the following, we construct a simple evolutionary game theoretical model of prisoner's dilemma with expellers. The expellers not only cooperate with coplayers in the game, but also 'punish' defectors by excluding them from future reciprocal relationships. This is motivated by the observation that individuals prefer neighborhoods with better quality, and are often willing to expel cheaters who accept benefits but do not reciprocate in order to avoid exploitation. Remarkably, it is found that expulsion and cooperation can coevolve in the spatial prisoner's dilemma with expellers as long as population has a sparse structure, though defection is the only evolutionarily stable strategy in the mean-field prisoner's dilemma with expellers.
The paper is organized as follows. Section 2 describes the evolutionary game theoretical model of prisoner's dilemma with expellers in detail. Section 3 presents the main results, including analysis of mean-field dynamics (section 3.1) as well as spatial dynamics (section 3.2). Section 4 gives summarizations and discussions on our findings.
2. Prisoner's dilemma with expellers
Consider a population of size N structured by an undirected and unweighted graph  where the set of vertices V represents the sites, and the set of edges E denotes the possible pairwise symmetric interactions between individuals. The vertex vi represents the ith site which can be either occupied by an individual or just empty, while the edge eij denotes the possible pairwise partnership between the individual at site vi and that at site vj.
Initially, a fraction pϕ ( ) of sites are set to be vacant, and the remaining sties are occupied by either an expeller (E, denoted by a three-dimensional unit vector
 ![$s={\left[1,0,0\right]}^{T}$](https://content.cld.iop.org/journals/2399-6528/3/1/015011/revision2/jpcoaafe57ieqn3.gif) ) or a cooperator (C,
) or a cooperator (C, ![$s={\left[0,1,0\right]}^{T}$](https://content.cld.iop.org/journals/2399-6528/3/1/015011/revision2/jpcoaafe57ieqn4.gif) ) or a defector (D,
) or a defector (D, ![$s={\left[0,0,1\right]}^{T}$](https://content.cld.iop.org/journals/2399-6528/3/1/015011/revision2/jpcoaafe57ieqn5.gif) ). In each time step (e.g. t), pairwise interaction dynamics happens with probability 1−w, whereas strategy updating dynamics occurs with probability w.
). In each time step (e.g. t), pairwise interaction dynamics happens with probability 1−w, whereas strategy updating dynamics occurs with probability w.
2.1. Pairwise interaction dynamics
A pair of sites linked by an edge, e.g. eij, is randomly picked up from the graph. If both sites are occupied by individuals, they play the one-shot prisoner's dilemma with each other; otherwise, the current time step ends. The payoff Pij of the individual at site vi and the payoff Pji of the individual at site vj resulted from such an interaction can be respectively expressed as

where the 3 × 3 payoff matrix M is given by

which represents the donor-recipient version of prisoner's dilemma with a single rescaled parameter: the cost-to-benefit ratio r (0 < r < 1). Here the cost-to-benefit ratio r measures the strength of dilemma confronted by individuals [77, 78]. Note that, in our model, expellers act as cooperators to play the prisoner's dilemma with their coplayers. But different from cooperators, we assume that expellers will unilaterally exclude defectors at a cost c from their current sites into any other vacant sites in the population after they are exploited by defectors in the prisoner's dilemma.
The payoff of each individual, e.g. the payoff Pi of the individual at site vi, is accumulated during the pairwise interaction process. Because of the randomness in selecting pairs of individuals, the rounds that each individual participates in vary from each other. To decouple the effect of this heterogeneity, the accumulative payoff of each individual, e.g. the one at site vi, is finally normalized according to

where z represents the frequency with which the individual at site vi is chosen for interaction with other ones during the pairwise interaction process.
2.2. Strategy updating dynamics
Individuals experience strategy updating phase in a synchronous manner. Specifically, each individual at site vi imitates a randomly selected neighbor at site vj, if any, with probability given by the Fermi function [20]:

where the noise K is the measure of stochastic uncertainties allowing irrational choices. Otherwise, the player at site vi does not change its strategy.
Obviously, the parameter w controls time scale between pairwise interaction process and strategy updating process: When w → 0, pairwise interaction dynamics proceeds much faster than strategy updating dynamics. Therefore, the equilibrium of pairwise interaction dynamics determines the local configurations as well as the average payoffs of individuals on a graph (see an analytical method for regular graphs in appendix B). This means that the consequent strategy evolution proceeds as on a graph with no mobility of individuals induced by expulsion events (see a theoretical method for regular graphs in supplementary material available online at stacks.iop.org/JPCO/3/015011/mmedia); when w → 1, one can expect neutral evolution on a graph depending on the initial strategy configuration; whenever 0 < w < 1, evolution is driven by a detailed interplay between these two dynamical processes.
3. Results
3.1. Mean-field dynamics
Now let us consider the deterministic dynamics of prisoner's dilemma with expellers in the mean-field setting, where the state is characterized by density p of players (i.e. pE of expellers, pC of cooperators and pD = 1 − pE − pC − pϕ of defectors) (see appendix A). In the limit w → 0, the expected values  of average payoffs
  (X ∈ E, C, D) for expellers, cooperators and defectors are respectively given by

According to the replicator-like equation set describing motion for the concentration of each type of players (equation (A.5)), pE and pC tend to zero for arbitrary value of pϕ and K as  . The increment of pϕ or K merely leads to the slowdown of evolutionary speed (figure 1), but cannot change evolutionary direction of the population as
  for any composition of the population (equation (5)). In short, expellers and cooperators become extinct in the mean-field limit for w → 0 (figure 2(a)). In the opposite limit w → 1, pairwise interaction dynamics almost never occurs. In this case, one can obtain
  . Then natural selection will not change the composition of the population. Any mixture of expellers, cooperators and defectors in the simplex S3 is an unstable equilibrium (figure 2(b)).
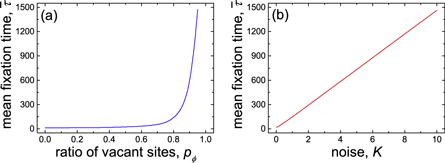
Figure 1. Mean time to achieve absorption state (i.e. the pure D state) ![$\bar{\tau }={\sum }_{i=0}^{T-1}{\sum }_{j=0}^{T-i-1}2{\tau }^{i,j}/[T(T+1)]$](https://content.cld.iop.org/journals/2399-6528/3/1/015011/revision2/jpcoaafe57ieqn11.gif) as a function of (a) ratio of vacant sites pϕ when noise K = 0.1 and (b) noise K when ratio of vacant sites pϕ = 0.5. The time to reach stable fixed point τi, j is determined by equations (5) and (A.5) the initial condition of which is given by
as a function of (a) ratio of vacant sites pϕ when noise K = 0.1 and (b) noise K when ratio of vacant sites pϕ = 0.5. The time to reach stable fixed point τi, j is determined by equations (5) and (A.5) the initial condition of which is given by  ,
,  and
and  where the integer i ∈ [0, T − 1] and j ∈ [0, T − i − 1]. Parameter settings: cost-to-benefit ratio r = 0.5, cost of expulsion c = 0.5 and T = 100.
Download figure:
Standard image High-resolution image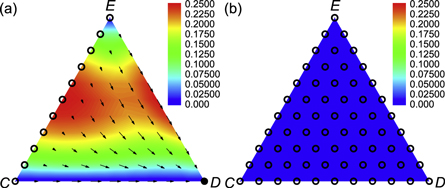
Figure 2. Deterministic dynamics of the mean-field system with expellers, cooperators and defectors in the simplex S3 (equations (5) and (A.5)). The arrows indicate the direction of deterministic flows in the simplex, while solid (hollow) points denote stable (unstable) fixed points. Red corresponds to fast dynamics and blue to slow dynamics close to the fixed points of the system. (a) For w → 0, there is only one stable fixed point in the defector corner, and any state alone the line EC in the simplex is an unstable fixed point. (b) For w → 1, there is no stable fixed point, and any state of the dynamical system is an unstable fixed point. Parameter settings: cost-to-benefit ratio r = 0.5, ratio of vacant sites pϕ = 0, cost of expulsion c = 0.5 and noise K = 0.1.
Download figure:
Standard image High-resolution imageIn the general case of 0 < w < 1, we cannot give analytical predictions on the evolutionary outcome of the population since the expressions of  ,
,  and
and  cannot be further simplified (equations (A.1)–(A.3)). Nevertheless, in the mean-field limit, the prisoner's dilemma with expellers can be described by the following transformed 3 × 3 payoff matrix M':

according to equations (A.1)–(A.3) From the above payoff matrix, we can see that the strategy D is completely dominant over C and E, and has a basin of attraction extended to the whole domain of the system. Based on this fact, we predict that the variation of w does not alter the evolutionary outcome that defectors will eventually wipe out expellers and cooperators irrespective of the initial composition of the population. To confirm this prediction, we present phase diagrams of prisoner's dilemma with expellers for w = 0.2, w = 0.4, w = 0.6 and w = 0.8 in figure 3. It can be seen that all evolutionary trajectories end up in the pure state of defectors irrespective of the values of w. In sum, defectors are advantageous over expellers as well as cooperators, and can take over the whole population in the mean-field limit.
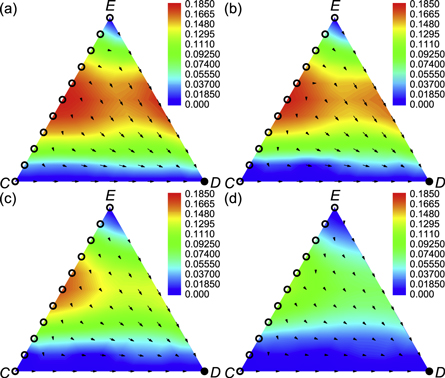
Figure 3. Phase portraits and stability diagram of prisoner's dilemma with expellers for (a) w = 0.2, (b) w = 0.4, (c) w = 0.6 and (d) w = 0.8 (equations (A.1)–(A.3) and (A.5)). The arrows indicate the direction of deterministic flows in the simplex, while solid (hollow) points denote stable (unstable) fixed points. Red corresponds to fast dynamics and blue to slow dynamics close to the fixed points of the system. Parameter settings: cost-to-benefit ratio r = 0.5, ratio of vacant sites pϕ = 0.1, cost of expulsion c = 0.5 and noise K = 0.1.
Download figure:
Standard image High-resolution image3.2. Spatial dynamics
In realistic populations, unlike the mean-field model, individuals do not interact with all other ones. Let us therefore consider a structured population with individuals arranged on a square lattice with von Neumann neighborhood (i.e. including connections between nearest neighbors) and periodic boundary conditions. Despite their difference from actual social networks [79], lattices provide a convenient entry point for exploring the impacts of network structures on evolutionary dynamics [14, 20, 80]. Furthermore, the interaction and competition between species in realistic systems, especially in biology and ecology, can be represented adequately by means of lattices [81–84]. Therefore, we aim to study the evolutionary dynamics of prisoner's dilemma with expellers on spatial networks.
In our computer simulations, each efficient time step (te) gives exactly one chance for every individual to change its strategy. Initially, an equal number of expellers, cooperators and defectors are randomly placed on a square lattice of size N, such that the fraction of occupied sites is 1 − pϕ. The stationary densities of expellers (pE), cooperators (pC) and defectors (pD) on square lattices are evaluated over sufficiently long sampling times after the system enters into the equilibrium state. To ensure proper accuracy, final results (i.e. the mean densities of expellers  , cooperators
  and defectors
  ) are averaged over up to 50 independent runs for each set of parameter values.
3.2.1. The limiting case  and
and


For convenience of comparison, we start by presenting the evolutionary outcomes of spatial prisoner's dilemma when the parameter of time scale w → 0 in figure 4. It is shown that the mean fraction of cooperators  decreases with the cost-to-benefit ratio r when ratio of vacant sites pϕ is low (figures 4(a) and (b)). In this case, cooperators are able to survive in the population by forming compact clusters as long as the cost-to-benefit ratio r is sufficiently low [23]. However, the mean fraction of cooperators
  becomes almost invariant with the cost-to-benefit ratio r when ratio of vacant sites pϕ is high (figures 4(c) and (d)). In this case, the clusters of cooperators become sparse. Cooperators are vulnerable to the invasion of defectors irrespective of the values of cost-to-benefit ratio r. Therefore, only cooperators isolated from the spatial domain of defectors remain in the population [85].

Figure 4. Mean fraction of players, i.e. cooperators ( : •) and defectors (
 :
:  ), in dependence on the cost-to-benefit ratio r for different ratios of vacant sites pϕ ((a) pϕ = 0, (b) pϕ = 0.2, (c) pϕ = 0.4 and (d) pϕ = 0.8) in the spatial prisoner's dilemma. Initially, each individual is designated as either a cooperator with probability 2/3 or a defector with the remaining probability. The solid lines show the theoretical results predicted by extended pair approximation methods (for details see Supplementary Material). Parameter settings: parameter of time scale w = 5 × 10⁻⁷, noise K = 0.1 and size of system N = 104.
Download figure:
Standard image High-resolution imageLet us now study the spatial prisoner's dilemma with expellers when the parameter of time scale w → 0. In comparison with those in figure 4, results reported in figure 5 demonstrate that expulsion is able to promote the evolution of cooperation irrespective of the values of cost-to-benefit ratio r, ratio of vacant sites pϕ and cost of expulsion c. On saturated square lattices (i.e. pϕ = 0), there is no vacant sites available for expellers to banish their defective neighbors. Expellers, like cooperators, persist in the population solely by virtue of network reciprocity. If cost of expulsion c = 0, expellers and cooperators become equivalent. Hence the mean fraction of expellers  is identical to that of cooperators
  for any value of cost-to-benefit ratio r (figure 5(a)). However, if cost of expulsion c > 0, the evolutionary performance of expellers becomes inferior to that of cooperators (figures 5(e), (i) and (m)). In contrast, on diluted square lattices (i.e. pϕ > 0), expellers perform better than cooperators and can persist (or even prevail) in the population across the whole applicable range of cost-to-benefit ratio r and cost of expulsion c (figure 5). In short, expulsion can coevolve with cooperation in the spatial prisoner's dilemma with expellers in contrast to the evolutionary outcomes in the mean-field limit.
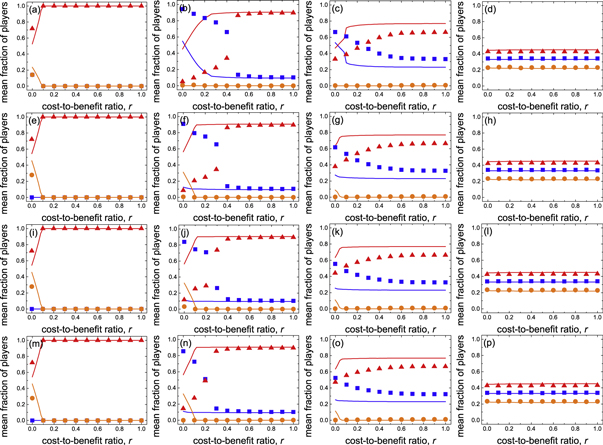
Figure 5. Mean fraction of players, i.e. expellers ( :
:  ), cooperators (
 : •) and defectors (
 :
:  ), as a function of cost-to-benefit ratio r for different combinations of ratio of vacant sites pϕ ((a), (e), (i), (m) pϕ = 0, (b), (f), (j), (n) pϕ = 0.2, (c), (g), (k), (o) pϕ = 0.4 and (d), (h), (l), (p) pϕ = 0.8) and cost of expulsion c ((a), (b), (c), (d) c = 0, (e), (f), (g), (h) c = 1, (i), (j), (k), (l) c = 2 and (m), (n), (o), (p) c = 3) in the spatial prisoner's dilemma with expellers. The solid lines show the theoretical results predicted by extended pair approximation methods (for details see appendix B and supplementary material). Parameter settings: parameter of time scale w = 5 × 10⁻⁷, noise K = 0.1 and size of system N = 104.
Download figure:
Standard image High-resolution imageTo systematically investigate the effects of cost of expulsion c and ratio of vacant sites pϕ, we move to study phase diagrams for two representative values of cost-to-benefit ratio r in the spatial prisoner's dilemma with expellers. In the absence of expellers, cooperators survive only if r < 0.006, and they are able to defeat defectors completely for r < 0 on the saturated square lattice. Taking these thresholds as benchmark values, we focus on r = 0.005 and r = 0.5. For r = 0.005, cooperators are able to coexist with defectors solely on the basis of network reciprocity. This value of r thus yields lenient conditions for the evolution of cooperation. For r = 0.5, on the other hand, cooperators are unable to survive. This value of r thus yields adverse conditions for cooperative behavior to emerge. In close vicinity of transition points, we here enlarge the size of system from N = 104 (figures 4 and 5) to 9 × 10⁴ (figure 7) to determine boundaries and types of phase transitions with a higher accuracy. Meanwhile, the parameter of time scale w should be covariant with the size of system N to ensure invariance of the ratio of time scale between pairwise interaction dynamics and strategy updating dynamics. Namely,

where wN denotes the parameter of time scale associated with a system of size N. Figure 6 shows the dynamical behaviors of two systems with different sizes (i.e. N = 104 and N = 9 × 10⁴) but the same ratio of time scale (i.e. Nw/(1 − w) = 5 × 10⁻³). Clearly, evolutionary trajectories for both systems are largely coincident with each other. Due to the finite-size effects, the current fractions of expellers  , cooperators
  and defectors
  fluctuate around an equilibrium after initial transient times, wherein fluctuations are smaller in the lattice with larger size (figure 6).
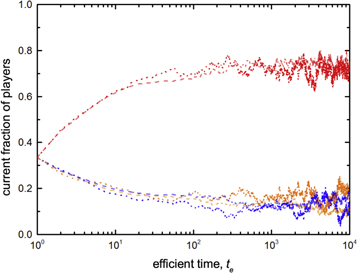
Figure 6. Examples of dynamical behaviors. Symbols (N = 104: dotted lines; N = 9 × 10⁴: dashed lines) depict current fractions of expellers (pE(te)/(1 − pϕ): blue), cooperators (pC(te)/(1 − pϕ): orange) and defectors (pD(te)/(1 − pϕ): red) on a spatial grid. The ratio of time scale for both systems is set to Nw/(1−w) = 5 × 10⁻³ (equation (7)). By N = 104 and N = 9 × 10⁴, the fluctuations of values around an equilibrium are smaller for the lattice with larger size. Indeed, if initial 5 × 10³ values are discarded, the standard deviations σ of current fractions with respect to mean fractions are smaller for N = 9 × 10⁴ in comparison with that for N = 104 ( ≈ 0.034,
  and
and  for N = 104;
  ,
,  and
and  for N = 9 × 10⁴). Parameter settings: cost-to-benefit ratio r = 0, ratio of vacant sites pϕ = 0, cost of expulsion c = 0 and noise K = 0.1.
Download figure:
Standard image High-resolution imageThe phase diagram for r = 0.005 presented in figure 7(c) together with figure 5 suggests that at such a low value of r, expellers rather than cooperators represent the more effective players to outperform defectors except if cost of expulsion c > 0 and ratio of vacant sites pϕ = 0. The mixed and dynamical (C + D)D phase in the bottom line of the c − pϕ plane first gives way to the mixed and dynamical (E + C + D)D phase, subsequently to the mixed and frozen (E + D)F phase and finally to the mixed and frozen (E + C + D)F phase as the ratio of vacant sites pϕ increases. Here a mixed state is further classified as a frozen or dynamical sub-state. A sub-state is called to be frozen provided two or more of the second order heterogeneous variables (i.e. pEC, pED or pCD) of the system are equal to zero in the stationary state. Otherwise, the sub-state is defined to be dynamical. While majority of phase transitions is continuous, the  phase transition is discontinuous because of an indirect territorial competition between expellers and cooperators (for details see main text below) [86, 87]. Only if the ratio of vacant sites pϕ is either negligible or large, are cooperators able to survive. When the ratio of vacant sites pϕ is sufficiently small (e.g. pϕ = 0.005), the clusters of cooperators are compact enough to fight against defectors (figure 8(a)). Accordingly, cooperators are able to coexist alongside expellers and defectors in a dynamical manner (see the mixed and dynamical (E + C + D)D phase in lower part of figure 7(c)). When the ratio of vacant sites pϕ is large (e.g. pϕ = 0.8), the clusters of cooperators are sparse and thus are easily invaded by their defective neighbors. In this case, only cooperators that are isolated from defectors can persist in the system (figure 8(b)). Therefore, cooperators coexist with expellers and defectors in a frozen manner (see the mixed and frozen (E + C + D)F phase in top part of figure 7(c)).
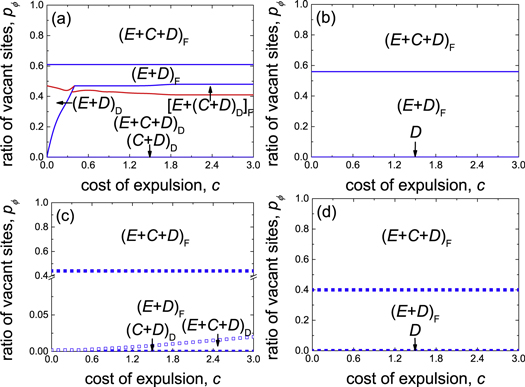
Figure 7. Full c − pϕ phase diagram for prisoner's dilemma with expellers on a square lattice with von Neumann neighborhood and periodic boundary conditions obtained via both extended pair approximation methods ((a), (b); see appendix B and supplementary material) and Monte Carlo simulations ((c), (d); see main text) for (a), (c) r = 0.005 and (b), (d) r = 0.5, respectively. In upper (bottom) panels, solid lines (closed symbols) denote continuous phase transitions, while dashed lines (hollow symbols) denote discontinuous phase transitions. In addition, blue lines (blue squares) represent the phase boundaries between different states (i.e. pure or mixed stationary states), while red lines (red bullets) represent the phase borders between different sub-states (i.e. dynamical or frozen stationary state; see definition in main text). Parameter settings: parameter of time scale w = 5.6 × 10⁻⁸, noise K = 0.1 and size of system N = 9 × 10⁴.
Download figure:
Standard image High-resolution image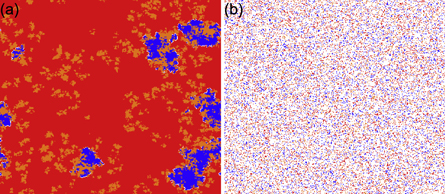
Figure 8. Characteristic spatial patterns emerging for ratio of vacant sites (a) pϕ = 0.005 and (b) pϕ = 0.8 when cost-to-benefit ratio r = 0.005. Strategies E, C, and D are depicted in blue, orange and red, respectively; vacant sites are described in white. Parameter settings: cost of expulsion c = 2, parameter of time scale w = 5.6 × 10⁻⁸, noise K = 0.1 and size of system N = 9 × 10⁴.
Download figure:
Standard image High-resolution imageInterestingly, when the ratio of vacant sites pϕ is moderate (e.g. pϕ = 0.1), cooperators become extinct, and expellers and defectors are frozenly coexistent in the system (see the mixed and frozen (E + D)F phase in middle part of figure 7(c)). To understand why expellers can outperform cooperators despite additional costs of expulsion, it is important to analyze spatiotemporal dynamics of spatial prisoner's dilemma with expellers. Let  denote the transition probability of X's changing into Y's at efficient time step te. Defining
  , we get the following equation set [20]:

where  represents the current inflow of Y's transitioning from X's at efficient time step te. In our analysis, both
  and
and  are obtained from computer simulations. Starting from a random strategy distribution (figure 9(e)), the imitation of better performing neighbors generates clusters of individuals with the same strategies: expellers and cooperators form tiny clusters in a sea of defectors (figure 9(f)). In this most early stage of evolutionary process (i.e.
 ![${t}_{e}\in \left[1,8\right]$](https://content.cld.iop.org/journals/2399-6528/3/1/015011/revision2/jpcoaafe57ieqn50.gif) ), the description of mean-field is applicable, and the current fraction of expellers
), the description of mean-field is applicable, and the current fraction of expellers  decreases with the efficient time te in an exponential way due to the advantage of defectors and cooperators in payoff (figures 9(a) and (i)). In comparison, the current fraction of cooperators
  does not vary sharply with the efficient time te: it first increases mildly and then decreases slowly. Although exploited by defectors at this stage, cooperators are compensated at the expense of expellers (e.g. at te = 1, the net inflow of cooperators changing from defectors
  the net inflow of cooperators changing from expellers
  the overall net inflow of cooperators
  figure 9(i)). The further development is determined by a local equilibrium where strategy updating only occurs at the interfaces between clusters of different strategies (i.e.
  figures 9(f)–(h)). In the presence of defectors, the evolutionary fate of expellers is decided not only by a direct competition with cooperators, but also by the success of both cooperative strategies against invasion attempts by defectors (the accumulated net inflow of expellers by the manner of direct domain competition with cooperators
  the accumulated net inflow of expellers through the manner of indirect domain competition with cooperators
  , where
  denotes the current net inflow of Z's from X's via Y's at efficient time step te; figure 9(d)). If ratio of vacant sites pϕ is moderate, the clusters of cooperators are not compact enough to defend against defectors in their neighborhood. Furthermore, the spatial configurations of cooperators are constantly subjected to additional destruction due to the attack of migratory defectors induced by the expulsion of expellers (figures 9(f) and (g)). In contrast, expellers are able to continuously banish defectors in their neighborhood, and thus reduce frequency of interaction with defective players (figures 9(f) and (g)). Consequently, the evolutionary performance of cooperators become inferior to that of expellers, which explains the advantage of expellers over cooperators in the direct domain competition (e.g. at te = 8, the net inflow of expellers changing from cooperators
  at te = 166, the net inflow of expellers changing from cooperators
  figures 9(j) and (k)). Figures 9(b) and (c) demonstrate the excellent competitiveness of expellers against defectors in their evolutionary race. Except extremely few efficient time steps, the current net inflow of expellers changing from defectors is always no less than that of defectors changing from expellers after the self-organization process of initial clusters (e.g. at te = 8, the net inflow of expellers changing from defectors
  at te = 166, the net inflow of expellers changing from defectors
  figures 9(j) and (k)). Indeed, expellers are able to accumulate more payoffs than defectors in the pairwise interaction process, due to evolutionary mechanisms of network reciprocity as well as expulsion. Interestingly, expellers can spread successfully in the presence of defectors that spatial domains lost by cooperators are finally occupied by expellers (figures 9(f)–(h)), which elaborates the advantage of expellers over cooperators in the indirect domain competition. The synergetic combination of direct and indirect territorial competitions ultimately leads to the eventual extinction of cooperators and the final downfall of defectors (figure 9(a)). The evolutionary competition between expellers and defectors terminates when they are completely separated from each other (figures 9(h) and (l)).

Figure 9. Spatiotemporal dynamics of spatial prisoner's dilemma with expellers for the mixed and frozen state (E + D)F phase occurring at ratio of vacant sites pϕ = 0.1 when cost-to-benefit ratio r = 0.005. Time courses depicting evolutionary process (top row): (a) time evolution of current fractions of players, i.e. expellers (pE(te)/(1 − pϕ):  ), cooperators (pC(te)/(1 − pϕ):
  ) and defectors (pD(te)/(1 − pϕ):
  ). (b) time evolution of current net inflow of expellers transitioning from defectors GDE(te) − GED(te) =pD(te) TrDE(te)/(1 − pϕ) − pE(te) TrED(te)/(1 − pϕ). The vertical green line shows when current net inflow GDE(te) − GED(te) starts to be positive (i.e. te = 8), while the horizonal green line marks the border at GDE(te) − GED(te) = 0. (c) Enlargement of the dashed rectangle area in figure 9(b): with very few exceptions, the current net inflow of expellers transitioning from defectors GDE(te) −GED(te) stays to be not smaller than zero during the whole evolutionary process. (d) Accumulated net flow between players (equation (8)), i.e. expellers (pE/(1 − pϕ)), cooperators (pC/(1 − pϕ)) and defectors (pD/(1 − pϕ)), during the whole evolutionary process: the bold arrows indicate the directions of accumulated net flows between players, while the numbers inside bold arrows denote the values of accumulated net flows between players. Moreover, the slim arrows show two manners by which the net inflow of expellers transitioning from cooperators is accumulated: direct (solid arrow) and indirect (dashed arrow) domain competition. Formation of spatial patterns (middle row): the snapshots were taken at efficient times (e) te = 1, (f) te = 8, (g) te = 166 and (h) te = 5 × 10⁴ (see green lines in figure 9(a) marking when snapshots of spatial distributions were recorded). Strategies E, C, and D are depicted in blue, orange and red, respectively; vacant sites are described in white. Current net flow between players (equation (8)), i.e. expellers (pE(te)/(1 − pϕ)), cooperators (pC(te)/(1 − pϕ)) and defectors (pD(te)/(1 − pϕ)) (bottom row) at efficient times (i) te = 1, (j) te = 8, (k) te = 166 and (l) te = 5 × 10⁴ (see green lines in figure 9(a) showing when current net flow between players were recorded): The bold arrows indicate the directions of current net flows between players, while the numbers inside bold arrows denote the values of current net flows between players. Furthermore, the slim arrows represent the directions of current flows between players, while the numbers near slim arrows show the values of current flows between players. See main text for definition of
  . Parameter settings: cost of expulsion c = 2, parameter of time scale w = 5.6 × 10⁻⁸, noise K = 0.1 and size of system N = 9 × 10⁴.
Download figure:
Standard image High-resolution imageMoreover, if ratio of vacant sites  is negligible, the increment of cost of expulsion c can lead to phase transition from the mixed and frozen (E + D)F phase to the mixed and dynamical (E + C + D)D phase (figure 7(c)). Here the emergence of cooperation is due to the increasing cost of expulsion c, which lends more support for cooperators to compete with expellers. The more specific nature of the phase diagram for r = 0.005 is illustrated quantitatively in figures 10(a) and (b), which shows a cross section across the ratio of vacant sites pϕ for cost of expulsion c = 2 and that across the cost of expulsion c for ratio of vacant sites pϕ = 0.02, respectively. Interestingly, it can be observed in figure 10(a) that there exists an optimal ratio of vacant sites
  leading to the maximal overall fraction of altruistic individuals (i.e. expellers and cooperators) in the system. Note that the optimal ratio of vacant sites
  in present study does not relate to percolation threshold of the host graph, in contrast to the findings in either prisoner's dilemma [85] or public goods game [88]. Here the evolutionary fate of altruistic individuals is determined by both direct and indirect territorial competition between expellers and cooperators. Neither too large nor too small but moderate ratios of vacant sites
  maximize the positive impact of territorial competition.
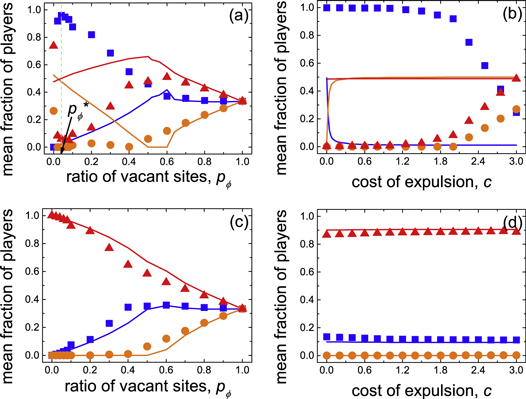
Figure 10. Representative cross sections of the phase diagram depicted in figure 7, as obtained for cost-to-benefit ratio r = 0.005 ((a): c = 2 and (b): pϕ = 0.02) and r = 0.5 ((c): c = 2 and (d): pϕ = 0.2). Depicted are mean fractions of players, i.e. expellers ( :
:  ), cooperators (
 : •) and defectors (
 :
:  ), in dependence on ratio of vacant sites
  (a), (c) and cost of expulsion c (b), (d). Note that the green dashed line in figure 10(a) marks the optimal ratio of vacant sites
  , at which the mean fraction of altruistic players
  reaches its maximal value. The solid lines show the theoretical results predicted by extended pair approximation methods (see appendix B and supplementary material). Parameter settings: parameter of time scale w = 5 × 10⁻⁷, noise K = 0.1 and size of system N = 1 × 10⁴.
Download figure:
Standard image High-resolution imageIf the conditions for the evolution of cooperation become harsh, as is the case for r = 0.5, the phase diagram changes qualitatively (figure 7(d)). It is shown that the mixed and dynamical (C + D)D phase at ratio of vacant sites pϕ = 0 as well as the mixed and dynamical (E + C + D)D phase at low ratio of vacant sites pϕ transforms into the pure D phase and the mixed and frozen (E + D)F phase, respectively. Here, cooperators vanish because of the increasing cost of cooperation. In addition, the parameter region where expellers, cooperators and defectors can frozenly coexist (i.e. the mixed and frozen (E + C + D)F phase) extends to lower part of the c − pϕ parameter plane (compare figures 7(d) with (c)). When the cost-to-benefit ratio r is large (e.g. r = 0.5), expellers and cooperators can survive only if they are separated from defectors. If the ratio of vacant sites pϕ is small (e.g. pϕ = 0.1), cooperators would not have enough space to escape from the exploitation by defectors. Thus expellers coexist with defectors in a frozen manner (figure 11(a)). If the ratio of vacant sites pϕ is large (e.g. pϕ = 0.8), as is the case for r = 0.005, cooperators are able to frozenly coexist with expellers and defectors in the system (figure 11(b)). Figures 10(c) and (d) feature two characteristic cross sections of the phase diagram presented in figure 7(d), which span across the ratio of vacant sites pϕ for cost of expulsion c = 2 and the cost of expulsion c for ratio of vacant sites pϕ = 0.2, respectively. Interestingly, it can be seen from figure 10(d) that the impacts of cost of expulsion c become saturated when it is increased: the mean fractions of players are invariant with the cost of expulsion c.

Figure 11. Typical spatial patterns appearing for ratio of vacant sites (a) pϕ = 0.1 and (b) pϕ = 0.8 when cost-to-benefit ratio r = 0.5. Strategies E, C, and D are depicted in blue, orange and red, respectively; vacant sites are described in white. Parameter settings: cost of expulsion c = 2, parameter of time scale w = 5.6 × 10⁻⁸, noise K = 0.1 and size of system N = 9 × 10⁴.
Download figure:
Standard image High-resolution imageGenerally, the results obtained from Monte Carlo simulations have been confirmed by using the extended technique of pair approximation (see appendix B and supplementary material; figures 4, 5, 7 and 10). In terms of equilibrium frequencies of strategies, the extended pair approximation methods correctly predict the trends of simulation data in variation with relevant parameters (figures 4, 5 and 10). However, predictions by the extended pair approximation approaches are less accurate in the vicinity of phase transition points where long-range correlations and fluctuations play a dominant role (compare bottom row with top row of figure 7) [89]. In principle, more reliable predictions can be made by enlarging the basic cluster from two-point (used by pair approximation or two-point approximation) to n-point (n > 2; used by n-point approximation) [20].
In the opposite limit w → 1, the system will stay in the strategy updating process but rarely enter into the pairwise interaction process. In such a case, the whole population is governed by random drift because the payoffs of expellers, cooperators and defectors are approximately equal to zero. In terms of game results, there is no role difference between expellers, cooperators and defectors. Hence, expulsion plays neither positive nor negative role in the evolution of cooperation.
3.2.2. The general case

To explore impacts of parameter of time scale w on the evolutionary outcome of spatial prisoner's dilemma with expellers in detail, we present the contour plots of mean fraction of expellers  , cooperators
  and defectors
  as a function of cost-to-benefit ratio r and parameter of time scale w for different values of ratio of vacant sites pϕ in figure 12. On saturated square lattices (i.e. pϕ = 0), cooperators are able to survive only if cost-to-benefit ratio r and parameter of time scale w are sufficient small (figure 12(b)). Otherwise, defectors dominate expellers as well as cooperators completely (see top row of figure 12). However, on diluted square lattices (i.e. pϕ > 0), expellers can coexist with defectors on the full r − w parameter plane (see middle and bottom rows of figure 12). For relatively low ratio of vacant sites pϕ (e.g. pϕ = 0.4), expellers perform best when cost-to-benefit ratio r and parameter of time scale w are negligible (figure 12(e)). Meanwhile, cooperators are able to survive only if the parameter of time scale w is moderate (figure 12(f)). Interestingly, the mean fraction of cooperators
  is largely invariant with cost-to-benefit ratio r. For relatively high ratio of vacant sites pϕ (e.g. pϕ = 0.8), the evolutionary fate of expellers is unaffected by cost-to-benefit ratio r as well as parameter of time scale w (figure 12(i)).As for cooperators, both cost-to-benefit ratio r and parameter of time scale w have similar effects as they have in the case of relatively low ratio of vacant sites pϕ (compare figures 12(f) with (j)). Intriguingly, it is shown that there exists an optimal as well as a worst value of time scale parameter w+ and w−that leads to the highest and lowest level of expulsion and cooperation, respectively (figures 12(c), (g) and (k)). In present study, pairs of individuals are stochastically chosen to play prisoner's dilemma with expellers in the pairwise interaction process. The randomness of this process can be adjusted by the parameter of time scale w. In one limit w → 0, the pairwise interaction dynamics is deterministic. In the other limit w → 1, the pairwise interaction dynamics becomes stochastic to the largest extend. Whenever 0 < w < 1, the pairwise interaction dynamics falls somewhere between these limits. Therefore, the existence of such an optimal phenomenon can attribute to the coherence resonance scenario trigged by the parameter of time scale w which may be considered as the constructive noise [90, 91]. In this case, the increment of mean fraction of altruistic players (i.e. expellers and cooperators)
  is regarded as an constructive effect, as widespread altruistic players yield a higher total population payoff in comparison with dominant defectors, and thus is favourable for the population. The mean fraction of altruistic players
  determines the constructive effects of noise on the system and thus has the same meaning as the signal-to-noise ratio in classical coherence resonance phenomena observed in dynamical systems [46]. On the other hand, the appearance of the worst value of time scale parameter w−near w = 1 is due to the unbalanced interplay between pairwise interaction dynamics and strategy updating dynamics. Figure 13 shows the optimal and worst parameter of time scale w+ and w−as a function of ratio of vacant sites pϕ. Both the optimal and worst parameters of time scale w+ and w−are increased with the ratio of vacant sites pϕ. This result indicates that with increasing vacancy rate the optimal as well as worst trade-offs between pairwise interaction dynamics and strategy updating dynamics translate from deterministic to stochastic manner.
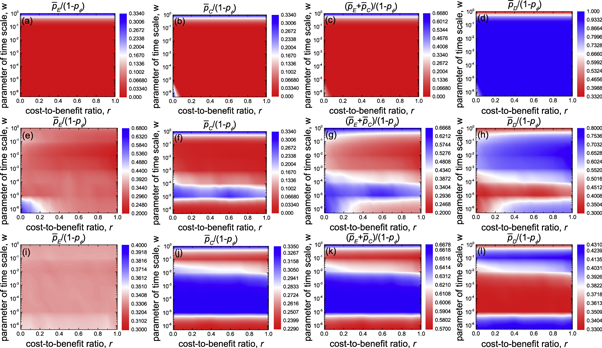
Figure 12. Color maps depicting the mean fraction of players ( : (a), (e), (i);
  : (b), (f), (j);
  : (c), (g), (k);
  : (d), (h), (l)) on two-dimensional r − w parameter planes, as obtained for vacancy rate pϕ = 0 (top row), pϕ = 0.4 (middle row) and pϕ = 0.8 (bottom row) in the spatial prisoner's dilemma with expellers. Parameter settings: cost of expulsion c = 1, noise K = 0.1 and size of system N = 104.
Download figure:
Standard image High-resolution image
Figure 13. Optimal (w+:  )
)  worst (w−: •) parameter of time scale, marking the maximal
  minimal mean fraction of expellers and cooperators, in dependence on ratio of vacant sites pϕ. Parameter settings: cost of expulsion c = 1, noise K = 0.1 and size of system N = 104.
Download figure:
Standard image High-resolution image4. Summary and discussion
The purpose of the present paper is to study the evolutionary dynamics of prisoner's dilemma with expellers, and to determine whether expulsion can provide evolutionary advantages for altruistic individuals (i.e. expellers and cooperators) to compete with defectors in prisoner's dilemma. In the mean-field limit, we have shown that defection is the only evolutionarily stable strategy in prisoner's dilemma with expellers. The increment of either vacant sites ratio or time scale parameter between pairwise interaction dynamics and strategy updating dynamics merely leads to the extension of mean time to reach the stable equilibrium. However, expulsion is, in general, effective in deterring defection in spatial prisoner's dilemma with expellers as long as the population has a sparse structure. In one limit of time scale parameter w → 0, the introduction of expellers can dramatically change the system behavior, wherein we do not find the dominance of defectors as it is in spatial prisoner's dilemma, but do find the maintenance or even prevalence of expellers (compare figures 4 with 5). In the presence of defectors, expellers can take advantages over cooperators by a combination of direct and indirect domain competition. By the evolutionary mechanism of expulsion, expellers are able to decrease frequency of interaction with defectors while increase frequency of interaction between cooperators and defectors (see appendix B). The former factor lowers down the payoffs of defectors in expellers' neighborhood, which helps expellers to reach a superiority over defectors who in turn diminish cooperators: a manner of indirect territorial competition. On the other hand, both factors assist expellers to defeat cooperators in the direct territorial competition. Although there exists a rather constrained and unrealistic parameter region (i.e. cost-to-benefit ratio r → 0, ratio of vacant sites pϕ = 0 and cost of expulsion c > 0; figure 5) where cooperators can outperform expellers, these advantages are highly impossible to play a role in reality. The spatial prisoner's dilemma with expellers gives rise to a rich variety of possible dynamics and a number of continuous or discontinuous transitions between qualitatively different system behaviors (figure 7). For low cost-to-benefit ratio r, we have observed several types of strategy coexistence: (1) the mixed and dynamical state  , (2) the mixed and dynamical state
  , (3) the mixed and frozen state
  and (4) the mixed and frozen state
  . Each kind of these states is sustained in a particular way by means of which a portion of altruistic individuals can survive in the presence of defectors. To be specific, cooperators can dynamically coexist with defectors by spatial aggregation in
  phase. In
  phase, expellers can dynamically coexist with cooperators and defectors by direct and indirect territorial competition, the latter of which also leads to the discontinuous phase transition between
  and
and  phase. In both
  and
and  phases, altruistic individuals can coexist with defectors by spatial isolation in a frozen manner. For high cost-to-benefit ratio r, we have observed more simplified evolutionary outcomes: (1) the pure state D, (2) the mixed and frozen state
  and (3) the mixed and frozen state
  .
.
Note that our principal discoveries are not expected to change for relaxing parameter of time scale from the limiting case w → 0 to the general case 0 < w < 1 (figure 12). Interestingly, we have found that there exist not only an optimal but also a worst value of time scale parameter w+ and w−that results in the highest and lowest level of expulsion and cooperation, respectively. By interpreting parameter of time scale w as constructive noise, we can attribute the optimal phenomenon to coherence resonance reported previously in temporal and spatially extended dynamical systems [46, 90, 91]. On the other hand, the existence of worst time scale parameter w−is due to the unbalanced interplay between pairwise interaction dynamics and strategy updating dynamics. Furthermore, it is well known that mutation weakens the benefits of network reciprocity to cooperation in social dilemma games [92]. Therefore it is worth investigating how the coevolution of expulsion and cooperation affected by mutation. The preliminary simulation results show that the beneficial effects of expulsive behavior on the evolution of cooperation are fairly robust against the variation of mutation. This indicates that the evolutionary mechanism of expulsion on spatial networks is different from network reciprocity, which deserves additional research to clarify.
It was previously found that punishment represents a typical behavior that is able to promote cooperation in certain situations [93, 94]. Particularly, costly punishment refers to the special kind of punishment that is manipulated by imposing some fine on defectors but at a cost to punishers [86, 95–101]. In fact, this kind of costly punishment can be classified as an active one. In this sense, the expulsive behavior in our model can be considered as a kind of passive punishment: expellers tend to 'punish' defectors in a way that they terminates future interactions between them. On the other hand, expulsion is very similar to ostracism, in which defectors lose all their present partners [102, 103]. In addition, the evolutionary mechanism that assists expellers to fight against the exploitation of defectors share a similarity with that in optional games of social dilemma: reduction of interaction frequency between cooperative strategies and defective strategies [104]. Nevertheless, different from the loner in optional games, expellers in our model can also win over cooperators via enhancing frequency of interaction between cooperators and defectors though it requires additional supports from network reciprocity as well as dilution of graph. This is the reason that leads to different dynamics between games with loners and games with expellers. Still, spatial prisoners dilemma with expellers can also be considered as a kind of coevolutionary model between individual strategies and network structures as the neighborhoods of individuals are also coevolved with strategies in our model [22]. Recently, the impact of social exclusion on the evolution of cooperation governed by group interaction has been extensively studied in infinite populations, finite populations and spatial networks, respectively [105–107]. In their works, excluders are able to deny the rights of defectors to enjoy the benefits of public goods at some cost. In this case, excluders can defeat defectors as long as the net gain of excluders from the public goods game is greater than the cost of exclusion. Thus social exclusion is a very powerful mechanism for the evolution of cooperation even in infinite populations. In contrast, expellers in our model are able to recognize the types of coplayers only after they play games with each other. In other words, expellers need to pay a cost r, which is the cost-to-benefit ratio, to make identification as well as another cost c to execute expulsion so as to expel defectors from their neighborhoods. This is the reason why expellers perform inferior to both cooperators and defectors in the mean-field limit. Finally, cooperators in our model play the role of second-order free riders. To explain this, suppose that there are no defectors in the population. In this case, natural selection cannot distinguish between the players that cooperate and banish defectors (i.e. expellers) and the players that cooperate but do not expel defectors (i.e. cooperators). There is no requirement to expel, so there is no second-order free rider problem. If defectors are present in the population, however, the players that eject defectors must do so at a personal cost. Natural selection will now favor the players that cooperate but do not expel defectors. As a result, cooperators rise at the expense of expellers and eventually introduce the invasion of defectors. However, we have shown that the coevolution of expulsion and cooperation can be promoted even in such an adverse condition.
Acknowledgments
We thank two anonymous referees for their constructive and insightful comments. XFW is supported by Donghua University Startup Funds for Young Faculty. XFW and WJK gratefully acknowledge financial support from the Fundamental Research Funds for the Central Universities (Grants No. 2232018G-09). WJK is also supported by the National Natural Science Foundation of China (Grants No. 61603088). This research is supported in part by Hong Kong Research Grant Council (Grants No. 15206915 and Grants No. 15208418).
Appendix A.: Mean-field dynamics of prisoner's dilemma with expellers
In the mean-field theory, the state of a system is characterized by the density of players. In this situation, the expected values  of average payoffs
  (X ∈ E, C, D) for expellers, cooperators and defectors in prisoner's dilemma with expellers are respectively given by

and
where I represents the frequency of randomly chosen pairs of individuals to endure pairwise interaction dynamics between strategy updating events. iXY denotes the number of XY pairs satisfying  . Herein, X and Y stand for the state of a site, which is occupied by either an expeller or a cooperator, or a defector.
Since the present dynamical rule has the form of Fermi function (equation (4)), the motion for concentrations of expellers, cooperators and defectors can be given by the following equation set:

Defining  (X ∈ E, C, D), we obtain
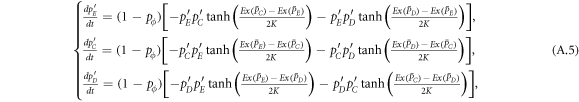
which is the master equations governing the evolution of the whole system.
Appendix B.: Pairwise interaction dynamics of spatial prisoner's dilemma with expellers
In this appendix, we would like to present an extended pair approximation method for describing pairwise interaction dynamics of prisoner's dilemma with expellers on regular graphs. Let pE, pC, pD and pϕ denote the density of expellers, cooperators, defectors and vacant sites in a population, respectively. Let pEE, pEC, pCE, pCC, pED, pDE, pDD, pEϕ, pϕE, pϕϕ, pCD, pDC, pCϕ, pϕC, pDϕ and pϕD represent the density of EE, EC, CE, CC, ED, DE, DD, Eϕ, ϕE, ϕϕ, CD, DC, Cϕ, ϕC, Dϕ and ϕD pairs, respectively. Then  specifies the conditional probability that the neighboring site of a site of state Y is in state X. Herein, X and Y stand for the state of a site, which is occupied by either an expeller or a cooperator or a defector, or just vacant. For pair approximation method [15, 108–112], only frequencies of state pairs pXY are tracked. The probabilities of larger configurations are expressed and approximated by the frequencies of pair configurations. Based on the symmetry condition pXY = pYX, the compatibility condition
  , and the closure conditions, the whole system can be described by the following eight variables in pair approximation: pE, pC, pEE, pEC, pED, pCC, pCD and pDD.
During the pairwise interaction process, the configuration frequencies do not change except if a defector is ejected by an expeller after they play games with each other. Let us now consider the case that an ED pair is randomly selected for interaction from the population. The expulsion of the chosen expeller to the chosen defector from its current site to another vacant site in the population may lead to the variation of pED, pCD and pDD. The expelled defector has kE expellers, kC cooperators, kD defectors and kϕ = k − 1 − kE − kC − kD vacant sites among the k − 1 remaining neighbors on a regular graph with connectivity k. The frequency of such a configuration is
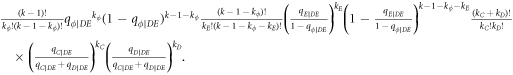
The frequency of the configuration, in which a vacant site has  expellers,
  cooperators,
  defectors and
  vacant sites, is
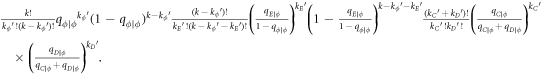
Therefore, the number of ED pairs increases by  , and thus pED increases by
  with probability
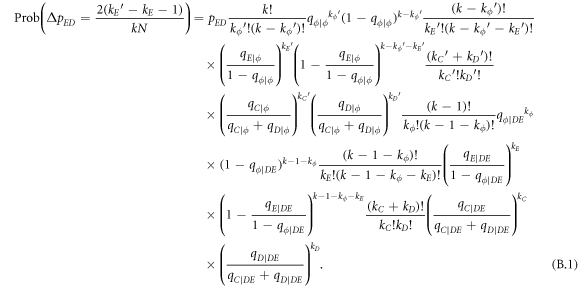
The number of CD pairs increases by  , and thus pCD increases by
  with probability
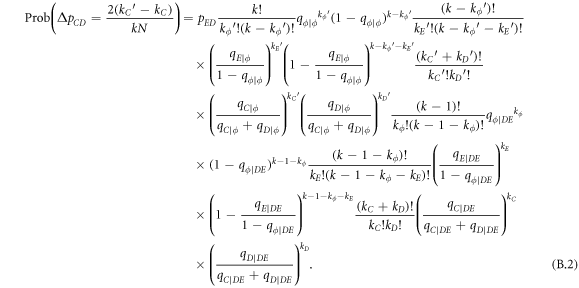
Similarly, the number of DD pairs increases by  , and thus pDD increases by
  with probability

In the limit of large site sizes  , we obtain the following differential equation set:
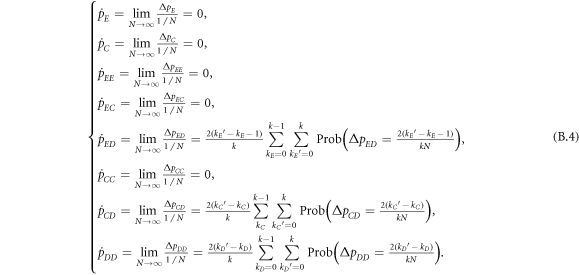
After some algebra, equation (B.4) can be simplified to
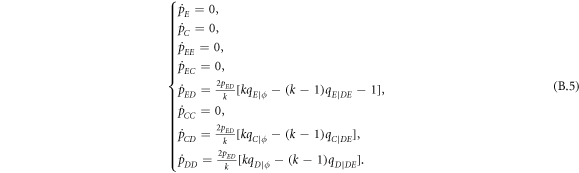
The above equation set requires a 'moment closure' by approximating  . This means that only first order pair correlations are taken into account and hence the name 'pair approximation'. Thus from equation (B.5), we have
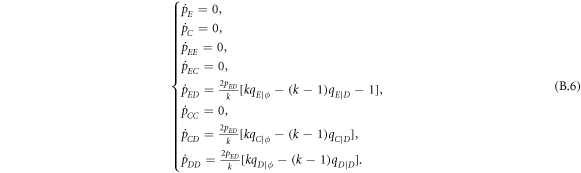
Further rearranging equation (B.6), we obtain
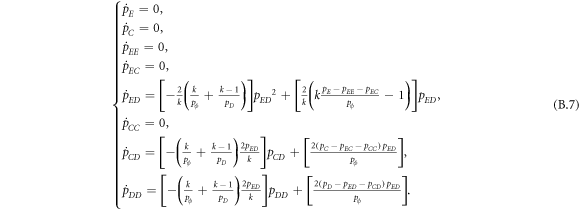
From equation (B.7), we can see that the ordinary differential equation of  has the form of Bernoulli's equation. Dividing throughout by
  , one gets

Multiplying throughout by ![${e}^{\int \left[\tfrac{2}{k}\left(k\tfrac{{p}_{E}-{p}_{{EE}}-{p}_{{EC}}}{{p}_{\phi }}-1\right)\right]{dt}}$](https://content.cld.iop.org/journals/2399-6528/3/1/015011/revision2/jpcoaafe57ieqn126.gif) , equation (B.8) is transformed into
, equation (B.8) is transformed into

which leads to a general solution

where C is a constant. Multiplying ![${e}^{\int -\left[\tfrac{2}{k}\left(k\tfrac{{p}_{E}-{p}_{{EE}}-{p}_{{EC}}}{{p}_{\phi }}-1\right)\right]{dt}}$](https://content.cld.iop.org/journals/2399-6528/3/1/015011/revision2/jpcoaafe57ieqn127.gif) solves for
solves for  :
:

Therefore, we obtain

Assuming that at the beginning of each pairwise interaction stage, expellers with a fraction  , cooperators with a fraction
  and defectors with a fraction
  are distributed on a regular graph with the vacancy rate
  . Thus
  is given by:

Similarly,  and
and  can be respectively expressed by
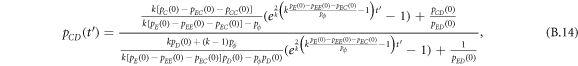
and
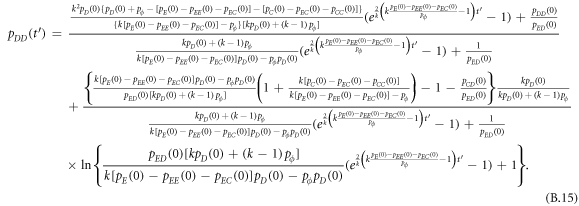
For rest of equations in equation (B.7), the current densities of players and the current pair densities can be simply solved as  and
and  , respectively.
From equations (B.13)–(B.15) we can observe that there exists a critical fraction of vacant sites

depending on which the equilibrium state of the population at the end of pairwise interaction stage can be summarized into the following three generic cases:
- (i)If, the stationary state is given by
- (ii)If, the stationary state is given by
- (iii)If, the stationary state is given by

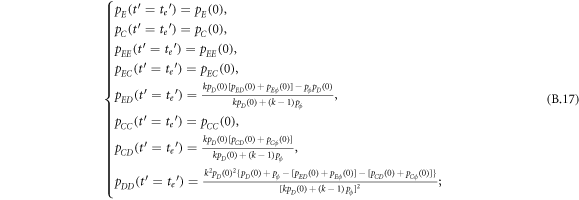


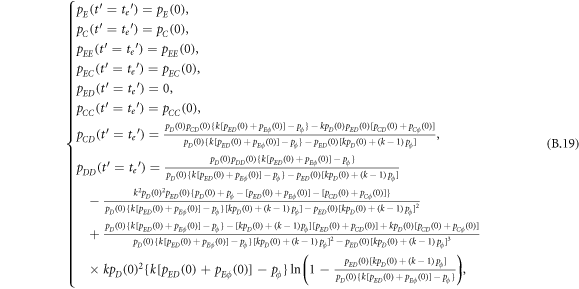
where  represents the ending time of pairwise interaction stage. Obviously, as w → 0, the time interval
  of pairwise interaction stage becomes much longer than the time that is required for the whole system enters into the equilibrium state in the pairwise interaction stage.
To demonstrate the predictive power of the extended pair approximation method for describing pairwise interaction dynamics of spatial prisoner's dilemma with expellers, we now consider a typical class of initial conditions: at the start of pairwise interaction process, a fraction of pϕ random sites of a regular graph with degree k are set to be vacant, and the remaining sites are occupied by either expellers, cooperators or defectors with equal probability. In this case, the initial values of local densities can be estimated as  (X ∈ E, C, D and Y ∈ E, C, D, ϕ) and
  (Y ∈ E, C, D, ϕ). Thus the solutions of
  ,
,  and
and  becomes

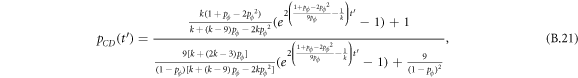
and
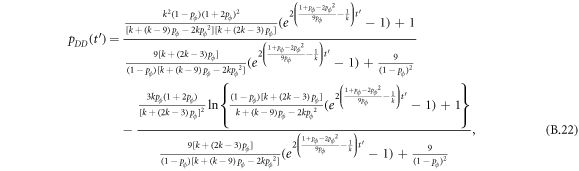
respectively. While the current densities of players and the current pair densities can be respectively solved as  and
and  .
.
According to equations (B.20)–(B.22) the critical ratio of vacant sites can be given as

by solving  . Still, the stationary state of the system at the end of pairwise interaction process can be classified into the following three generic cases:
- (i)If, the equilibrium state becomes
- (ii)If, the equilibrium state becomes
- (iii)If, the equilibrium state becomes

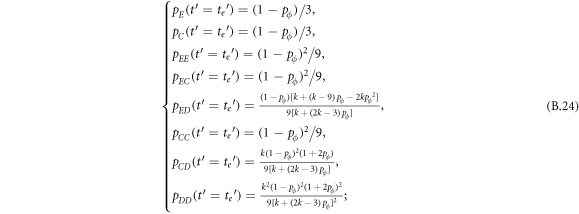


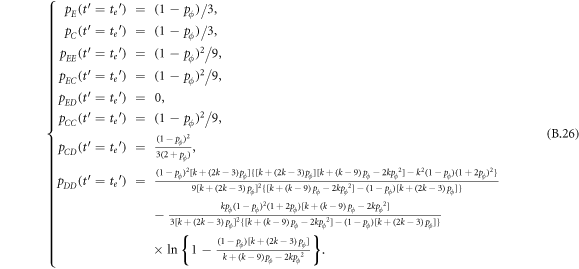
Figures B1 and B2 show that simulation and analytical results almost perfectly coincide with each other both in steady state and during evolutionary process of pairwise interaction dynamics, and thus confirm the validity of our method. Besides, from equations (B.20) and (B.21) we can obtain

and

Here, the overall impacts of pairwise interaction dynamics on strategy distribution are to decrease interaction frequency between expellers and defectors while increase interaction frequency between cooperators and defectors if only  (figures B1 and B2), which reveals the origin of evolutionary advantages of expellers over cooperators as well as defectors. For
  , the current local densities become invariant with time step
  during the whole pairwise interaction process.

Figure B1. Stationary local densities  (X = E:
  X = C:
  ; X = D:
  X = ϕ:
  ) associated with steady-state configurations reached via pairwise interaction dynamics in dependence on ratio of vacant sites pϕ (top row): (a) Y = E; (b) Y = C; (c) Y = D; (d) Y = ϕ. Densities of players (i.e. (e) expellers: pE; (f) cooperators: pC; (g) defectors: pD) and (h) vacant sites: pϕ in dependence on ratio of vacant sites pϕ (bottom row). In present experiments, a fraction of pϕ random sites of a square lattice of size N = 104 with von Neumann neighborhood and periodic boundary conditions are set to be vacant, and the remaining sites are occupied by either expellers, cooperators or defectors with equal probability at the start of pairwise interaction stage. Herein each data point obtained by Monte Carlo simulations is averaged over up to 50 independent runs in order to ensure proper accuracy. The solid lines show the theoretical results predicted by the extended pair approximation method for describing equilibrium state of pairwise interaction dynamics (equations (B.24)–(B.26)). The green dashed lines in top row of figure B1 mark the critical ratio of vacant sites
  with degree k = 4, which separates pairwise interaction dynamics into three distinct patterns (equations (B.23)–(B.26)). On the other hand, densities of players keep constant because there is no strategy updating event happening in pairwise interaction stage. Therefore, the density of expellers, cooperators and defectors is given by
  ,
,  and
and  , respectively (figures B1(e)–(g)).
Download figure:
Standard image High-resolution image
Figure B2. Current local densities  (X = E:
  X = C:
  X = D:
 :
:  ) associated with transient-state configurations of pairwise interaction dynamics: (a) Y = E; (b) Y = C; (c) Y = D; (d) Y = ϕ. In our simulations, a fraction of pϕ = 0.5 random sites of a square lattice of size N = 104 with von Neumann neighborhood and periodic boundary conditions are set to be empty, and the remaining sites are occupied by either expellers, cooperators or defectors with equal probability at the beginning of pairwise interaction process. Here data points are collected in one run of Monte Carlo simulations. The solid lines show the theoretical results predicted by the extended pair approximation method for describing pairwise interaction dynamics (equations (B.7) and (B.20) (B.22)). According to equations (B.7), (B.27) and (B.28), the current local densities of altruistic players (i.e. expellers and cooperators)
  ,
,  ,
,  ,
,  keep constant,
  and
and  decrease, while
  and
and  increase during the whole pairwise interaction process, as also confirmed in figure B2.
Download figure:
Standard image High-resolution image