

Abstract
The development of wireless sensing technologies paves the way for advances in the fields of wearable devices, prosthetics and robotics. Wireless communication between sensors and readers plays an important role in recent Internet of Things technologies. Among many types of wireless sensing devices, wireless passive radio frequency devices including inductor-capacitor (LC) resonators have been spotlighted. However, passive LC sensors suffer from short-range wireless detection, and their fabrication requires several processes. Here, we design a 3D integrated wireless compact LC location sensor fabricated using the 3D printing method for multi-layered devices. The fabricated wireless sensing system shows an increased wireless readout distance of up to 10 cm. In addition, a dielectric material with high dielectric permittivity has been applied to enhance the quality factor of the sensors by 2.5 times with improved wireless detection.
Export citation and abstract BibTeX RIS

Original content from this work may be used under the terms of the Creative Commons Attribution 4.0 license. Any further distribution of this work must maintain attribution to the author(s) and the title of the work, journal citation and DOI.
1. Introduction
Recently, printed sensors have been demonstrated for the detection of environmental stimuli [1], such as chemicals [2] temperature [3], humidity [4] or pressure [5]. Usual sensors typically require a wired terminal connection to transmit data or work wirelessly using a Bluetooth module or a complex integrated circuit, which requires an extra complex circuit board and power supply [6].
A wireless LC sensor has a capacitor (C) in resonance with an inductor (L), and the resonant frequency changes with external effects, and it can work wirelessly without the need for a battery or any kind of power source [7]. Inductor-capacitor (LC) sensors have been widely used for the wireless detection of changes in pressure [8], temperature [9], humidity [10] and chemicals [11]. Continuous wireless monitoring without the need for a power supply, cost-effectiveness, and long service life are the main advantages of wireless LC sensors [12]. These merits make wireless LC sensors useful in cases where wired connections are difficult,such as sealed environments [13], biomedical implants [14] and Internet of Things fields. One major challenge of using LC sensors is that they suffer from limited readout distance known as working distance, (less than 1 cm) because of the dispersion of the electromagnetic fields, and the weak magnetic coupling between the sensor and the readout antenna as the principle of LC sensors is based on electromagnetic coupling [15].
In recent years, the improved performance of LC sensors has been reported for sensitivity, detection range and response time [16]. Developments such as the use of an adaptive repeater [15] or dual-inductance resonator [17] have been proposed to increase the readout distance up to 4 cm, but they could not exceed this low detection range. On the other hand, radio frequency identification (RFID) is a wireless data transmission technique that has been utilized in commercial product identification [18, 19]. There are two types of RFID tags that are passive and active. A passive type of RFID tag does not require a power supply for operation, which makes it cost-efficient [20]. Far-field wireless communication and low fabrication cost make passive RFID a strong candidate for long-range wireless communication [21]. Recently, researchers have started to use passive RFID sensor tags for different sensing applications, such as metal defect characterization using spiral resonators on the RFID tag as sensing elements [22].
In other studies, a passive RFID tag has been proposed and fabricated for coating defect detection and corrosion prediction [23], and it has been reported that chipless RFID has been designed and used for temperature sensing [24].
One of the most important factors in radio frequency (RF) wireless communications is the electromagnetic properties of materials used in different parts of the RF device. High permittivity materials find extensive use in high-frequency communication devices due to their low loss of magnetic fields and physical robustness. These materials can help the wireless communication quality by increasing the quality factor of the RF sensor's resonant frequency. Exploration of high-permittivity materials has been a hot topic among material scientists due to its importance in RF communication [25, 26].
In addition, the fabrication process of an LC sensor requires several processing steps. Usually, they are not cost-efficient in both materials and time. There are different printing methods, such as screen printing [27], flexography [28] or offset lithography [29] for the fabrication of printed circuits. In the past decade, various 3D printing technologies have been developed for the fabrication of electronic circuits [30]. For example, fused deposition modeling has merits, such as high printing speed and low setup cost, but its low resolution, frequent nozzle clogging and process instability make it challenging for conductive printing [31, 32]. In addition, inkjet printing has been spotlighted as a representative printing method despite the fact that it is suitable for various substrates and produces less waste, is limited to a planar surface and has nozzle clogging issues [33, 34].
Direct ink writing (DIW)-based 3D printing has recently emerged as an appealing fabrication method for electronic circuits in which a nozzle moves in the desired pattern and deposits conductive ink [35, 36]. This method allows the printing of conductive complex patterns in different layers with excellent mechanical properties, and without wasting any material [37, 38]. Due to the aforementioned benefits, the DIW 3D printing method has recently been used for the fabrication of electronic devices and LC sensors [11, 30–42].
Here, we design compact LC sensors and integrate them with RFID tags to develop a reliable wireless sensing system with an improved detection range for location identification sensing applications. Furthermore, the cost-efficient fabrication of sensors and RF antenna tags was realized with the DIW 3D printing method. Finally, by preparing and utilizing a high-permittivity material paste, the wireless communication of the RF sensor has been improved. Finite element analysis (FEA) was conducted to verify the experimental characterization results.
2. Experimental section
2.1. Compact designs of LC sensors
LC sensors consist of an inductor (L) and a capacitor (C), which are connected to each other and are in resonance with each other. Each sensor has its own resonant frequency, which is related to its inductance and capacitance. In order to detect the resonant frequency of an LC sensor, an external readout coil that is connected to a vector network analyzer (VNA) is placed on top of the sensor, to interact with the magnetic field that comes from the inductor of the sensor. The readout coil will have a mutual inductance with the inductor of the sensor. Therefore, the signature signal directly related to mutual inductance can be transferred from the sensor to the VNA. The resonant frequency of an LC sensor with the capacitance of CS and the inductance of LS can be expressed as equation (1).
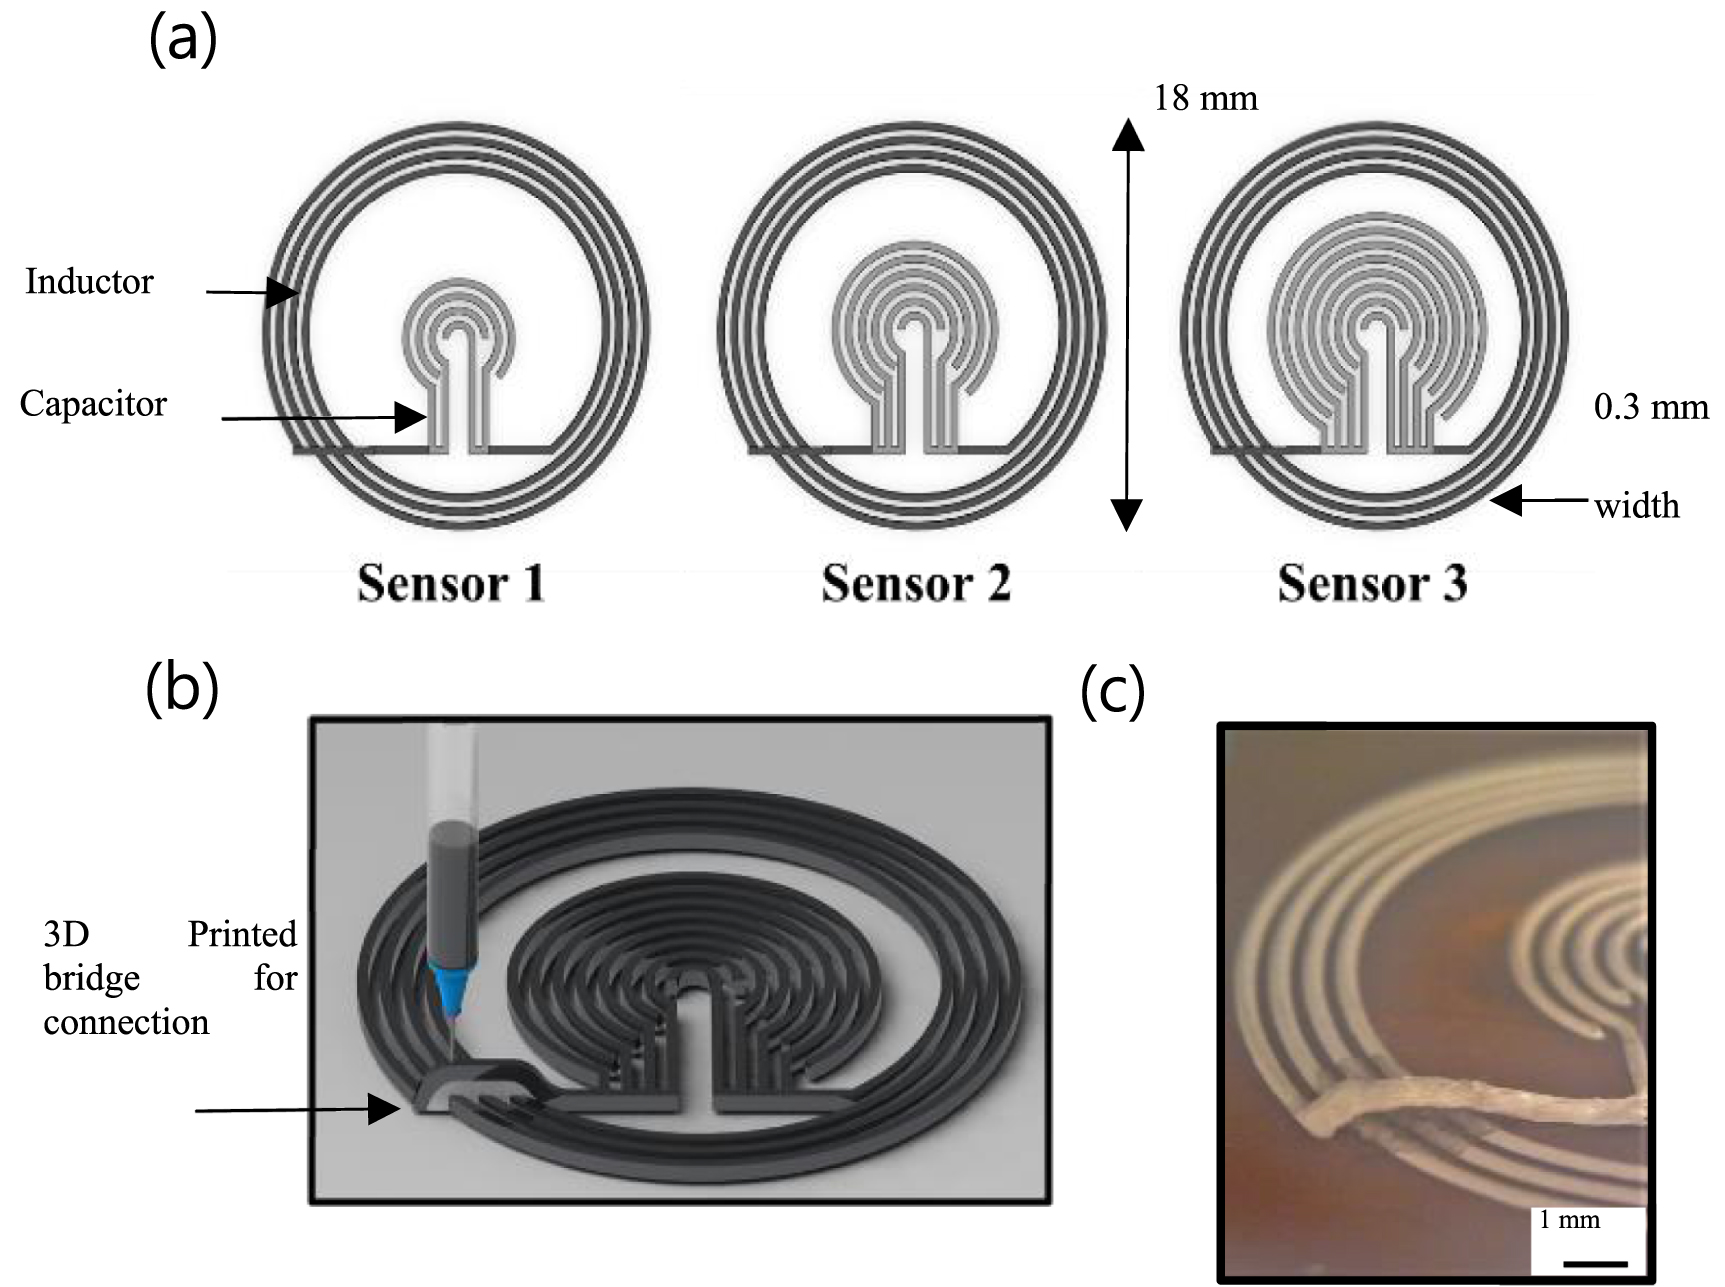
As a means of achieving sensors with different resonant frequencies, three compact sensors with differing capacitance have been designed. As shown in figure 1(a), the three sensors have 3.75 turns of the inductor on the outside, which is connected to the curved and interdigitated capacitor (IDC) at the center. The width of the inductor and each finger of the IDC is 300 µm, and the gap between the inductor's turns and the capacitor's fingers is 300 µm. The outer diameter of the sensor is 18 mm. In order to have differing capacitances in the three sensors, a different number of paired fingers of capacitors has been selected. LC sensor #1 has two pairs of curved electrodes, LC sensor #2 has three and LC sensor #3 has four pairs of capacitor electrodes. By having a greater number of paired fingers of the capacitor, capacitance is increased. Therefore, based on equation (1), the resonant frequency is decreased.

Figure 1. (a) Proposed design of three different LC sensors. (b) Schematics of the 3D printing process for the fabrication of LC sensors. (c) Actual sample image of the 3D-printed bridged structure.
Download figure:
Standard image High-resolution imageBoth inductors and IDC capacitors have been designed to have circular shapes to achieve a compact design. As a demonstration, the number of inductor's turns and capacitor's fingers have been controlled to achieve a resonant frequency in the range of 1–4 GHz. As a result, three sensors have three different resonant frequencies, which are required to distinguish each sensor in different locations. Circular designs of the LC sensors demonstrate reliable mechanical behavior that leads to consistent electromagnetic behavior depending on the strain change.
2.2. DIW-based 3D printing of LC sensors
To have a closed LC circuit, the inductor must be connected to both electrodes of the capacitor. Since the inductor is outside the capacitor in the proposed design, a bridge between the inductor and the capacitor is required to complete the closed circuit. Figure 1(b) shows the DIW-based 3D printing method for the fabrication of an LC sensor with a bridge for connecting the capacitor to the inductor, so that the circuit can be closed. This ability of DIW-based 3D printing, which allows a bridge to be printed on top of the inductor in a different layer will make the fabrication process faster than constructive methods and help to save conductive material. A 3D CAD model of LC sensors has been designed and converted into a tool path, and the 3D printer moves the nozzle based on the designed tool path. By applying pressure to the syringe, the conductive ink is dispensed from the nozzle and makes the desired path. Parameters, such as dispensing pressure, the movement speed of the nozzle, and the distance between the nozzle and the surface, determine the width and quality of printed patterns. The dispensing pressure affects the amount of dispensing material in such a way that higher pressure leads to more dispensing material and larger width of the prints. In addition, the printhead's moving speed needs to be optimized so that the dispensing materials have enough time to adhere to the substrate and not to be dragged with the nozzle. Finally, the vertical gap between the nozzle and the substrate needs to be less than the nozzle width to make the dispensing material fully adhere to the surface. The optimal printing parameters including dispensing pressure, speed and the vertical gap were initially selected based on trial and error to obtain reliable 3D-printed patterns.
The printed sample is shown in figure 1(c), in which the bridge area is focused. The conductive ink that has been used is 'Voltera's conductor 2 ink', which has a resistivity of 1.265 × 10⁻⁷ Ωm. After printing the LC sensors with conductive ink on a polyimide substrate, the samples were cured thermally at 120 °C for 30 min to achieve fully dried and conductive traces.
3. Results and discussion
3.1. FEA of designed sensors
In order to find the resonant frequencies of the LC sensors by experiment, an external readout coil is employed. The coil antenna is connected to the Sub Miniature version A (SMA) adapter and then connected to the VNA with a cable. The SMA connector has an impedance of 50 Ω and is designed to function in the frequency range of 0–12 GHz. The resonant frequency of the sensor is obtained via electromagnetic coupling between the readout coil and the inductor of the LC sensor. For a single port measurement system with a coil antenna, the input return loss (S11) parameter and reflection coefficient are measured in the desired frequency range. The frequency at which S11 is the minimum is close to the resonant frequency. Therefore, with this method the resonant frequency of the LC can be measured.
In this study, FEA that mimics the real experimental situation has been conducted for the characterization of LC sensors for the validation and characterization of the sensor design. The ANSYS high-frequency structure simulator (HFSS) has been used for the S11 simulation of the resonant frequencies of LC sensors. The conductive material used in the simulation setup for the sensors is bulk silver with a resistivity of 1.6 × 10⁻⁸ Ωm.
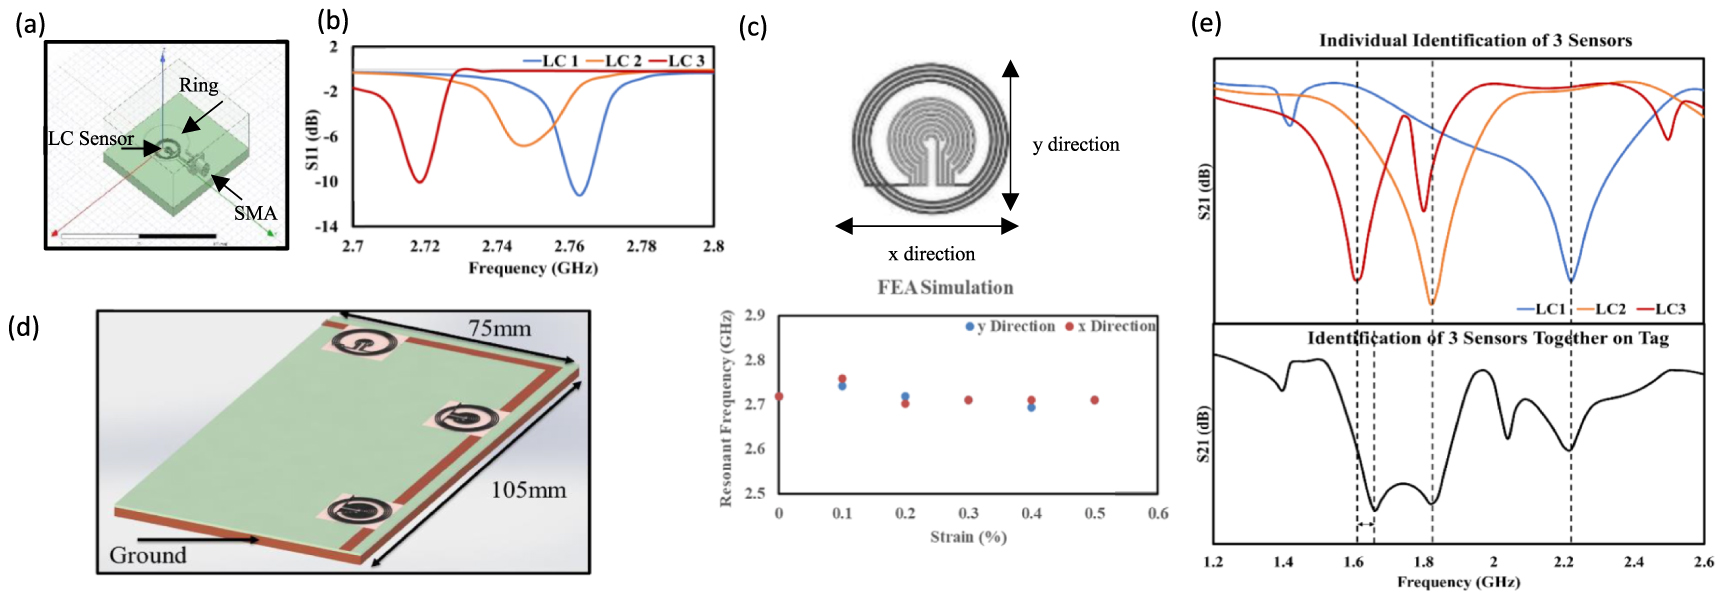
Figure 2(a) shows the ANSYS HFSS interface of the simulation setup. A circular coil antenna 2 cm in diameter has been connected to the SMA and placed on top of the LC sensor with 5 mm. After conducting a simulation, the S11 coefficient has been found at different frequencies. The plot of S11 versus frequency has been obtained, as shown in figure 2(b). The blue line is for LC 1, which has two pairs of capacitor fingers, showing that the minimum value of S11 is around 2.76 GHz, which is indicated as the resonant frequency of LC 1. The orange line is for LC 2 with three pairs of capacitor fingers, showing that the resonant frequency is around 2.74 GHz. The red line is for LC 3 with four pairs of capacitor fingers, showing that the resonant frequency is around 2.72. Results show that the three sensors have different resonant frequencies. Moreover, since LC 1 has the minimum capacitance among the other sensors, it has the highest resonant frequency, and LC 3 has the lowest resonant frequency among them due to its maximum capacitance in line with the theoretical expectation from equation (1).
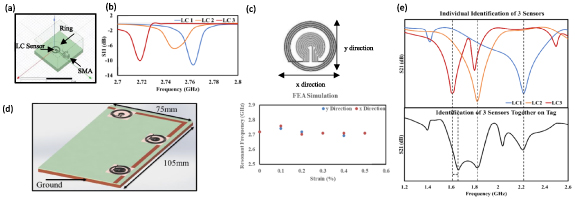
Figure 2. (a) ANSYS HFSS simulation interface for the validation of designed sensors. (b) S11 simulation results for the resonant frequency of three LC sensors. (c) Resonant frequency of LC sensor #3 with horizontally and vertically applied strain. (d) Three LC sensors on top of the strip line. (e) S21 simulation results of three LC sensors on the tag (top: individual sensor, bottom: three sensors together).
Download figure:
Standard image High-resolution imageFigure 2(c) shows the simulation results of resonant frequency changes in applied strain for LC sensor #3. Due to the circular shape of the LC sensors, the resonant frequency does not change drastically by applying the strain in both the x and y directions up to 0.5%.
To find the resonant frequency with different location information, the transmission coefficient (S21) is measured in the desired frequency range. The frequency at which S21 is minimum is close to the resonant frequency. For the simulation of transmission coefficient (S21), sensors with polyimide substrate have been placed on top of the L-shaped transmission line (stripline) with 3.5 mm width on top of the printed circuit board (PCB) substrate, as shown in figure 2(d) in such a way that their inductors cover the strip line and communicate with the strip line with mutual inductance. The length of the L-shaped tag is 105 mm, and the width of the tag is 75 mm. A copper plate has been attached at the bottom of the PCB, which acts as a ground. Signals from the first port move along the strip line and the signature signal, which has the information of the LC sensor will be transferred back to the VNA via the second port for analysis.
For the simulation, each sensor has been placed on the strip line individually, and the results have been collected. In addition, three sensors were placed on the strip line together, and these results have also been collected, as shown in figure 2(e). For the individual case, LC 1 has a resonant frequency of 2.22 GHz. The resonant frequencies of LC 2 and LC 3 are 1.82 and 1.61 GHz, respectively. The results from the bottom graph, which are for all LC sensors together on the transmission line, show that for LC 1 and LC 2, the resonant frequencies match the individual cases. The difference in resonant frequency is around 50 MHz for LC 3, which may come from the interaction among the magnetic fields of the three sensors. All the LC sensors can still be identified individually. Moreover, the discrepancy between the S11 and S21 results comes from the difference in mutual inductance between the LC sensors and coil antenna in the S11 measurement and the mutual inductance between the LC sensors and transmission line in the S21 measurement. From the S11 and S21 measurements, it has been confirmed that each sensor has its resonant frequency, which varies from other sensors. Therefore, when each sensor is placed at a different location it has its specific location-based information that is different to other locations with a sensor.
3.2. Confirmation of fabricated sensors
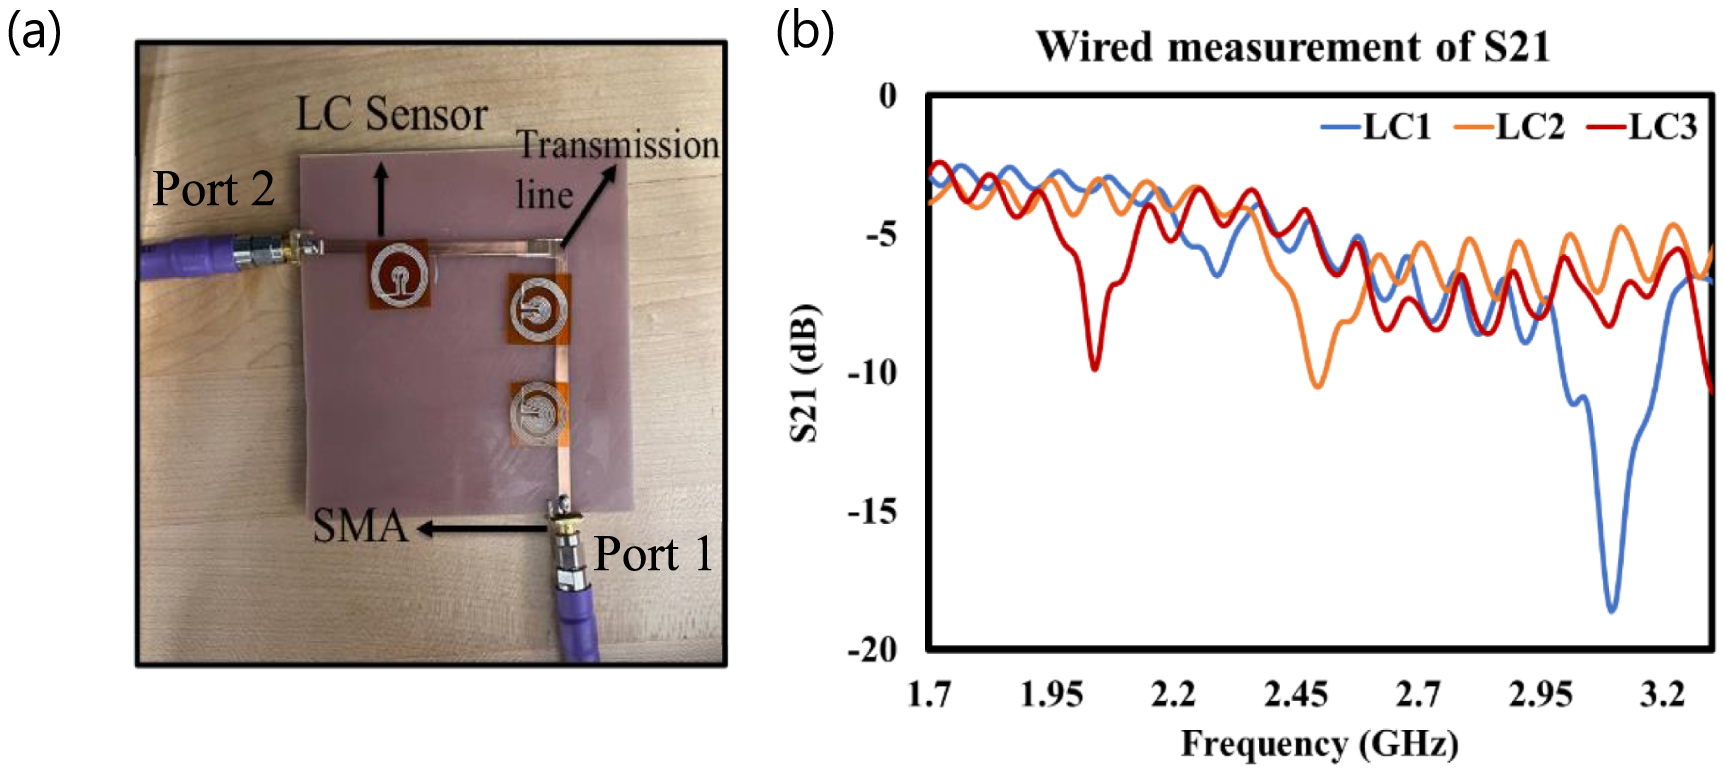
After we confirmed the FEA simulation, an experimental method was chosen to verify the communication between the LC sensors and the strip line. As shown in figure 3(a), an L-type strip line has been fabricated on top of the tag with a 3.5 mm width of copper sheets as a transmission line. Two ends of the strip line have been connected to SMA connectors. On the other side of the tag, a copper plate has been used to act as a ground. Two SMA connectors have been connected to the VNA input and output ports to conduct the measurement of the S21 coefficient. The VNA used in this study is the 'Rohde and Schwarz ZND Vector Network Analyzer' with a frequency range of 100 kHz–4.5 GHz.
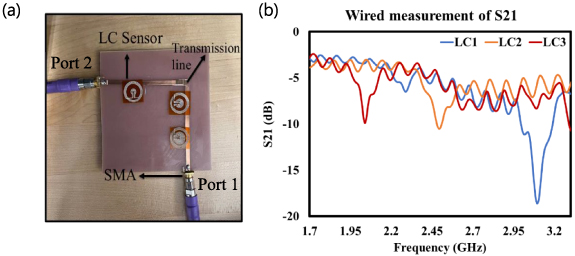
Figure 3. (a) Actual image of wired S21 measurement of three LC sensors placed on top of the strip line. Port 1 is connected to the VNA and receives the signals and Port 2 transfers the signals back to the VNA. (b) Results from S21 wired measurement using an SMA and a strip line.
Download figure:
Standard image High-resolution imageOne sensor at a time has been placed on top of the strip line in such a way that its inductor is placed exactly on top of the strip line so that there can be mutual inductance between them. After completing the setup, the VNA applied the excitation from one port and received the signal from another port. The S21 graph has been obtained, as shown in figure 3(b). The blue line is the result of placing LC 1 on the strip line, the orange line is for LC 2, and the red line is for LC 3. All three results from the three sensors are shown in one graph for comparison. The minimum number of S21 coefficients for LC 1 is at 3.09 GHz frequency, which is considered to be its resonant frequency. LC 2 has a resonant frequency of 2.48 GHz, and the resonant frequency of LC 3 has been found to be 2.05 GHz.
The behavior of decreasing resonant frequencies by having a sensor with a larger capacitance has been proved by the S21 measurement. It was expected that results from the experiment would not completely match the results from the FEA simulation because the properties of the material used in fabrication are different to the material parameters used in the simulation. For instance, the conductivity of the silver conductive ink used for the fabrication is different to the conductivity of bulk silver in the FEA simulation. There are two main reasons for the FEA characterization of designed LC sensors. First, we find that the resonant frequency trend in the 1–4 GHz range (by increasing the fingers of the IDC capacitor, the resonant frequency decreases). Next, it is confirmed that the LC sensor and the transmission line can communicate, and the transmission line can transfer the signature signal that is demonstrated in figures 2(d) and (e). Moreover, by FEA simulation, it has been confirmed that by having different LC sensors on top of the transmission line, each sensor shows its own resonant frequency with a minimum influence on the other sensors. Thus, the value mismatch between the simulation and experimental results does not affect the objective of the study.
3.3. Wireless sensing system
Figure 4(a) shows a schematic of the wireless detection system. Signals come from one port of the VNA that leads to the transmitter (Tx) reader antenna. This antenna transmits the signal from one side, and the receiver (Ry) tag antenna that is connected to the strip line receives the signals. The Rx tag antenna transmits the signals to the strip line, and the signals go through the strip line, while the LC sensors placed on top of the strip line signature the signal with their resonant frequencies. Signature signals go through the transmitter (Ty) tag antenna, and this antenna transmits the signal to the VNA receiver (Rx) reader antenna and then to the VNA to collect the signals for the S21 versus frequency graph.
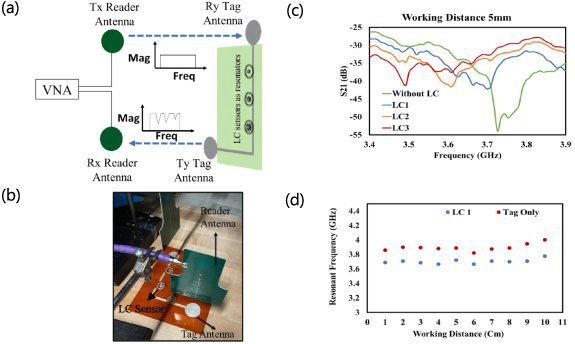
Figure 4. (a) Schematic of the wireless measurement setup consisting of a reader, sensor tag and antennas. (b) Actual image of the wireless experiment setup. (c) Results from wireless S21 measurement of the sensor tag with 5 mm working distance. (d) Results from S21 measurement of the tag without a sensor and with LC sensor 1 for ten different working distances.
Download figure:
Standard image High-resolution imageThe photo image of the experimental setup is shown in figure 4(b). The tag size is 105 mm by 75 mm. Commercial antennas have been used as reader antennas, and monopole antennas with a diameter of 3 cm have been printed as tag antennas.
A tag with an L-type strip line and two monopole antennas have been fabricated using a DIW-based 3D printing method with conductive ink on top of a polyimide substrate, which is then thermally cured to be fully conductive, and finally attached to a copper plate ground on the other side.
Figure 4(c) shows the results of placing one sensor at a time on top of the strip line for a working distance of 5 mm. As shown in the graph, the resonant frequencies of the three LC sensors are different to each other and distinguishable, and the tag without any sensors shows wireless communication. From the graph, LC 1 has a resonant frequency of 3.69 GHz, LC 2 has a resonant frequency of 3.61 GHz, and the resonant frequency of LC 3 is 3.49 GHz. The same experiment has been conducted for LC 1 at different working distances from 1–10 cm, and results have been provided in figures S1 and S2 in the supporting data. Resonant frequencies of tags without LC sensors and with LC 1 in different working distances have been collected from the S21 versus frequency graphs, as shown in figure 4(d). For each working distance, signals were detectable, and the resonant frequency has been found from the S21 versus frequency graph. For the working distance beyond 10 cm, it was hard to distinguish a minimum S21 for finding the resonant frequency of the sensor, which means that the proposed system with these types of antennas has a maximum working distance of 10 cm, which is a significant improvement in the case of the working distance of the LC sensor.
3.4. Effect of dielectric materials on wireless sensing communication
The designed LC sensors have been improved by applying high dielectric constant materials on top of the LC. In order to determine the effect of the dielectric constant of dielectrics on the communication between LC sensors and strip lines, FEA simulations with ANSYS HFSS have been conducted for four different dielectric materials with thicknesses ranging from 1–5 mm. Figure 5(a) shows the S21 results with different dielectric material thicknesses for poly(methyl methacrylate) (PMMA), epoxy, Al2O3 and TiO2 in the case of LC 3.

Figure 5. (a) Simulation results of dielectric effects on the intensity of S21 coefficient in resonant frequency for LC sensor #3 in different thicknesses of dielectric material. (b) Wireless setup schematic illustrating the working distance. (c) S21 measurement results for LC sensors with and without dielectric paste with 40 wt. % of TiO2. (d) Quality factor of LC sensor 3 with and without dielectric paste with 40 wt. % of TiO2 in different working distances.
Download figure:
Standard image High-resolution image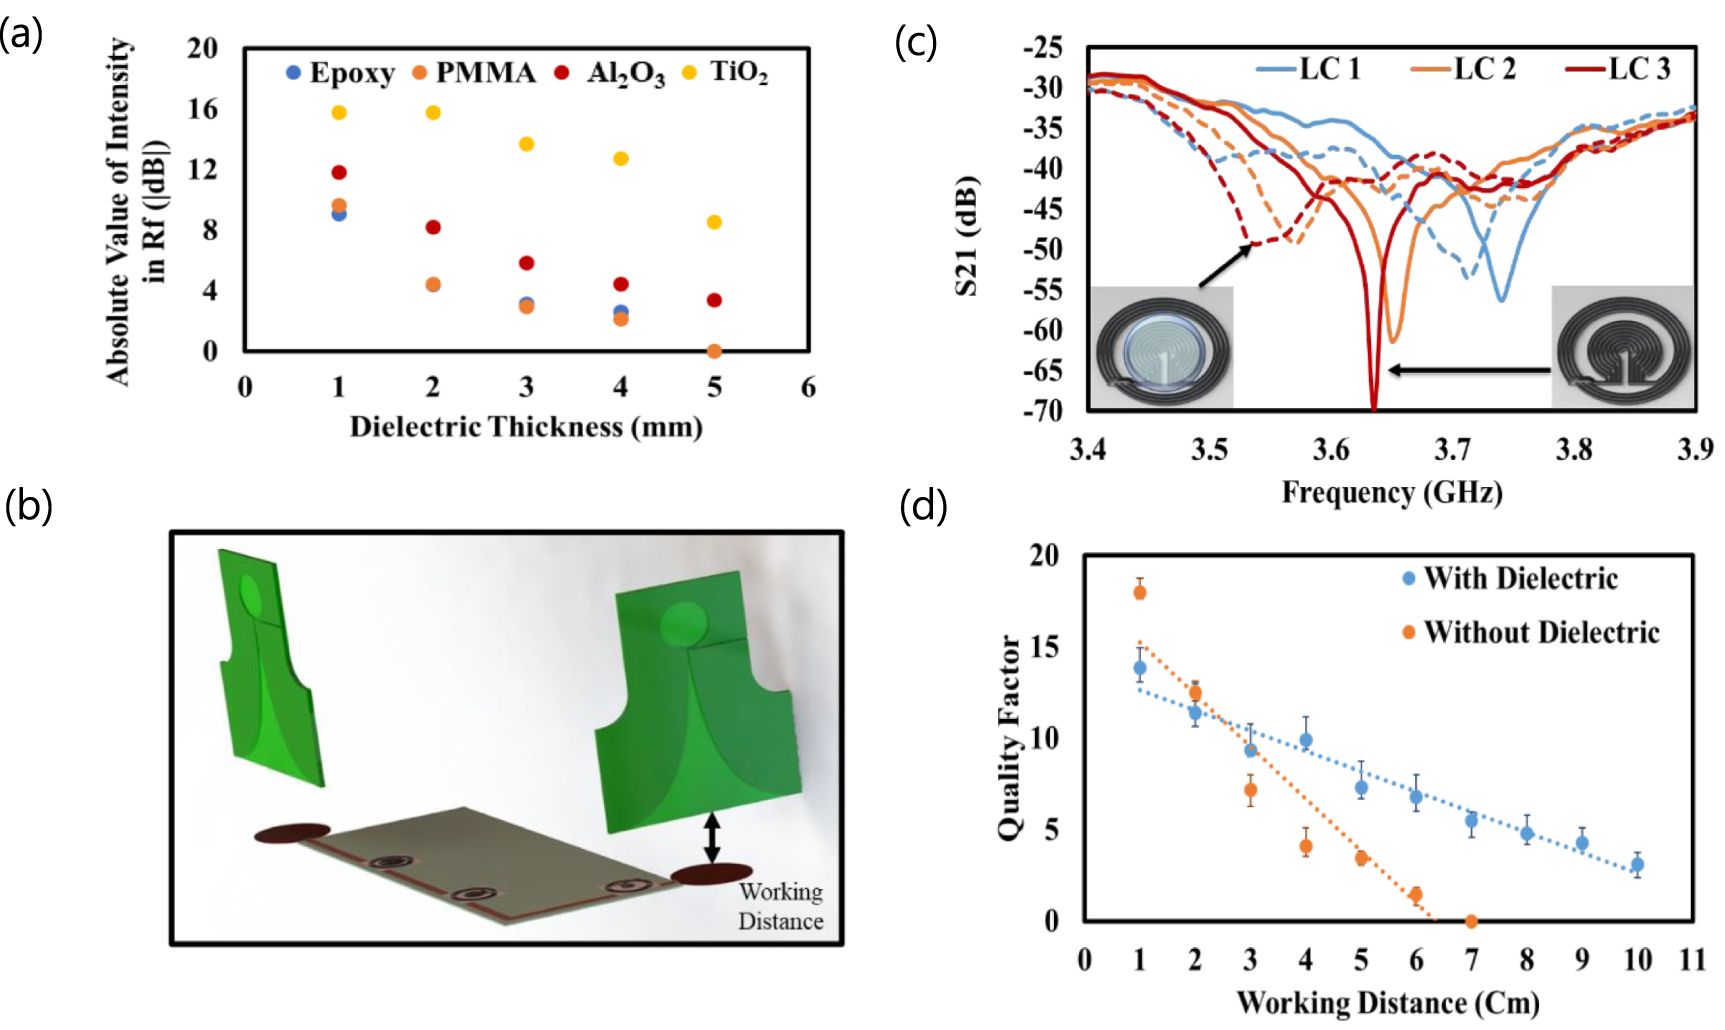
The simulation setup interface of ANSYS is shown in figure S3, and the relative permittivity (dielectric constant) of four dielectric materials is provided in table S1 in the supporting data. As shown in the graph, by increasing the thickness of the dielectric material, the intensity of S21 decreases. For PMMA and epoxy, the intensity of S21 goes to 0 with a thickness over 4 mm, which means that the resonant frequency cannot be found. From table S1, the dielectric constants of PMMA and epoxy are 3.4 and 4.4, respectively. With Al2O3, which has a dielectric constant of 9.8 (higher than PMMA and epoxy), it has a higher permittivity. Consequently, the magnetic field from the inductor of the sensor can reach the strip line, and they can communicate up to 5 mm thickness of Al2O3. Figure S4 in the supporting data shows the graph drawn from the simulation of the relationship between the absolute value of the S21 coefficient in resonant frequency and Al2O3 thickness between the LC sensor and the strip line for the three LC sensors.
Another dielectric material that has been chosen for this part is TiO2 due to its high dielectric constant, which is 86. As shown in figure 5(a), for TiO2 as a dielectric between the LC sensor and strip line, the intensity of the S21 coefficient in the resonant frequency of the sensor is much higher than that of other materials from 1 mm to 5 mm thickness. Its high permittivity allows proper electromagnetic communication between the LC sensor and the strip line. Resonant frequencies of the three LC sensors for the mentioned dielectric materials are provided in figure S5 in the supporting data.
In section C, LC 1 has been used for wireless measurement at different distances between the tag and VNA transmitter and receiver antennas. Figure 5(b) shows the schematic of the wireless setup with different working distances. Since wireless measurement has been conducted for LC 1, it has been noted that finding a resonant frequency for a relatively longer working distance (>6 cm) is challenging, and the bandwidth at the resonant frequency increasesd, which means that the quality factor decreases with increasing the working distance. Therefore, dielectric material paste that contains TiO2 has been prepared, and after applying it to the sensor, its effect on wireless communication has been studied. To make the 3D printable dielectric paste, the urethane triacrylate oligomer was mixed with nano-fibrillated cellulose with phenylbis phosphine oxide as a photo-initiator. This paste is UV curable by light with a wavelength of 400 nm.
After making the paste, 40 wt. % of the TiO2 powder has been added to the paste, and the paste was mixed with a speed mixer to achieve a homogeneous 3D printable paste. TiO2 has been chosen due to its high dielectric constant and permittivity to make a dielectric paste with a high dielectric constant. The dielectric constant of the paste has been measured for different wt. % of TiO2 and the results are provided in figure S6 in the supporting data. For the paste with 40 wt. % of TiO2, the measured permittivity is around 43 F m−1. Therefore, this dielectric paste has been used for further preparation of the three LC sensors. Figure S7 shows the fabricated LC sensor #3 with dielectric paste on the capacitor part.
Figure 5(c) shows the S21 measurement results for the working distance of 5 mm for the three LC sensors without dielectric material and with dielectric paste on their capacitor. The blue line represents LC 1, the orange line LC 2 and the green line LC3. Solid lines result from sensors without dielectrics and dotted lines result from sensors with dielectric paste. As shown in the graph, the resonant frequency of each LC sensor decreases by adding the dielectric material on top of its capacitor. By increasing the dielectric constant between the layers of the capacitor, the capacitance increases so the resonant frequency decreases as expected based on equation (1).
In order to determine the effect of dielectric materials with high permittivity on wireless communication of the LC sensors, LC sensor #3 has been demonstrated with S21 wireless measurement for both with and without dielectric material at different detection distances, as shown in figure 5(d). Orange points are data coming from LC 3 without dielectric material, and blue points are for LC 3 with the dielectric material. For the LC sensor without dielectric material, the quality factor decreases from 18 to 0 as the working distance increases from 1 to 7 cm, which means that the resonant frequency cannot be found at a working distance beyond 7 cm. In this case, the decrease in the quality factor is 2.852 cm−1. However, for the LC sensor with TiO2 dielectric material, by increasing the working distance, the quality factor decreased from 13.78 to 3.11 as the working distance increased from 1 to 10 cm, and the decreasing rate of the quality factor is 1.111 cm−1, which means that by having the dielectric material with high dielectric constant, the wireless communication is more reliable for a relatively longer working distance because of the fact that the dielectric material with high permittivity helps the electromagnetic communication of the LC sensor with the strip line. Although the quality factor decreases by increasing the capacitance after applying the dielectric material to the capacitor, the rate of decrease in the quality factor by increasing the working distance is twice less than the rate for LC sensors without dielectric material. The maximum working distance that we could achieve with TiO2 was 10 cm. For working distances more than 10 cm, the quality factor drops to zero, and the resonant frequency is not distinguishable.
4. Conclusion
We demonstrate 3D-printed LC sensors with monopole antennas for wireless identification of different locations. S21 measurements of the reflection coefficient together with electromagnetic FEA simulation has been conducted to verify the measured resonant frequencies of LC sensors. It has been confirmed that the designed LC sensors have distinctive resonant frequencies that can be used for location-based sensing. Then, the transmission coefficient of the LC sensors on a strip-line antenna has been demonstrated. Wireless location identification using 3D-printed LC sensors has been demonstrated up to 10 cm working distance between the receiver antenna and sensors, which has been increased by 2.5 times compared to other reported studies of LC sensors. Moreover, by applying a prepared high-dielectric material on the capacitor part of the sensors, which contains 40 wt. % TiO2 that has a relative permittivity of 43, we demonstrate improved wireless communication between the sensor tag and receiver. The proposed platform allows wireless sensing at longer communication distances for different applications. Specifically, the designed LC sensors can be utilized for the identification of different locations with distinctive resonance frequency. One potential application is location sensing with sensors inserted into a multilayered composite. For instance, different sensors can be embedded inside different layers of composite, which can show their different locations. Potentially, these sensors can demonstrate wireless detection of possible layer deformation inside the composites.
Acknowledgments
This work was supported in part by the National Research Council (NRC) of Canada under Grant No. STR1-02-01. The authors thank Marc Genest's NRC project team for the discussion about the project's progress and the manuscript.
Data availability statement
All data that support the findings of this study are included within the article (and any supplementary files).
Supplementary data (2.0 MB DOCX)