

Abstract
Serpentine interconnects are promising for electronic textiles (e-textiles), because they can maintain low electrical resistance even under cyclic large deformation. However, previous studies have not deeply discussed their failure lifetime, and the relationship between the elongation (engineering strain applied to entire structure) and cycle number to failure remains unclear. This clarification will contribute to the lifetime prediction. Therefore, this study investigates the relationship using interconnects having the same conductive material and geometric parameters but with different laminated structures: copper adhered to a polyurethane laminated knit textile (type A); copper adhered directly to a knit textile (type B); and polyethylene-naphthalate-laminated copper adhered to a knit textile only at both ends of the interconnect (type C). An elongation of 7%–70% was applied to the prepared samples with a tensile testing machine. The measurement and analytical calculation show that the type-C interconnects have the highest lifetime, and the relationship between the elongation  appl and cycle number to failure Nf is given by appl = A'Nf−c/2, where A' is the coefficient determined by the material properties, geometric parameters, and laminated structures, and c is the fatigue ductility exponent of copper. Moreover, this paper demonstrates the washing durability of an e-textile device using type-C interconnects. A cloth-face-mask-type device that monitors facial skin temperatures was fabricated and repeatedly washed with a washing machine. The demonstration confirms that the temperature variations were stably monitored before and after the first washing, and the multiple failures occurred in the interconnects after ninth washing.
Export citation and abstract BibTeX RIS

Original content from this work may be used under the terms of the Creative Commons Attribution 4.0 license. Any further distribution of this work must maintain attribution to the author(s) and the title of the work, journal citation and DOI.
1. Introduction
Electronic textiles (e-textiles) have attracted great attention for their potential application in biological information monitoring [1–4], human–machine interaction [5], energy storage [6], and others [7]. Flexible and stretchable interconnects, which connect rigid or even soft electronic components on textile substrates, are among the key technologies that enables e-textiles to fit a body shape, monitor biological information stably during exercise, and endure washing [8]. Many research groups have investigated various interconnect technologies, including the weaving/knitting/sewing of conductive yarns [9, 10], printing of stretchable conductive inks [11–14], and lithography and wet etching or cutting of metal foils to serpentine shapes [15–18]. It is often required for the interconnects to have low initial resistance, which is equivalent to that of conventional printed wiring boards using metal foils, and maintain the initial resistance even under cyclic large deformation. Additionally, interconnects having large area are often required for e-textiles. Considering these requirements, serpentine interconnects fabricated by patterning metal foils have some advantages because of their low resistivity (e.g. resistivity of copper foil is 1.7 × 10⁻⁸ Ω m) and applicability for large area [4, 17].
For serpentine interconnects, many studies have discussed mainly the elongation that lead to failure (engineering strain applied to entire structure) under single large deformation [15, 19–21]. However, those studies have not deeply discussed the cycle number to failure under cyclic large deformation. To aid in predicting the failure lifetime, it is important to investigate the relationship between the elongation and cycle number to failure under various conditions. Although there have been a few studies investigating the relationship using interconnects with different geometric parameters of serpentine [22, 23], it is still not clear how the relationship changes corresponding to other conditions, such as material properties and laminated structures.
Therefore, this study investigates the relationship between the elongation and cycle number to failure using serpentine interconnects having the same conductive material and geometric parameters but with different laminated structures, under cyclic large deformation. The laminated structure must affect the displacement of the lateral buckling that occurs in the interconnects. For the interconnects used in e-textiles, their thickness is usually much smaller than their width. In this case, when the interconnect is stretched from both ends, each straight line and half circle segment of serpentine experiences combined bending and shearing. As the elongation reaches a critical value, lateral buckling occurs to reduce the strain energy in the interconnect [24, 25]. When the entire structure of the interconnect adheres strongly to a relatively hard textile substrate (e.g. knit textile laminated with several-hundred-micrometres-thick elastomer film), the lateral buckling is inhibited. On the other hand, when the entire structure adheres to a relatively soft textile substrate or can deform freely from the textile substrate, the lateral buckling is not inhibited. These indicate that the strain energy varies with the laminated structure, even if the elongation remains the same. The strain energy corresponds to the strain level in the interconnect, and a larger strain induces a lower failure lifetime. Therefore, the laminated structure must affect the failure lifetime, and the investigation of the relationship between the elongation and cycle number to failure with different laminated structures will contribute to the failure lifetime prediction.
In this study, the serpentine interconnects with different laminated structures on knit textiles were prepared, and the cycle number to failure was measured at the various elongation. Additionally, for a better understanding of the relationship between the elongation and cycle number to failure, the measurement results were analyzed using analytical calculation and buckling/crack observations. Moreover, this paper demonstrated the washing durability of an e-textile device using interconnects having the highest lifetime from the measurement results.
2. Materials and methods
2.1. Sample preparation
Figure 1(a) shows a schematic of geometric parameters for a serpentine interconnect. The interconnect consists of straight lines and half circles. The length and spacing of the straight lines were l1 = 1.0 mm and l2 = 1.5 mm, respectively. The width w and thickness t for both segments were 0.5 and 0.018 mm, respectively. The total length of the interconnect l3 was 29.5 mm. The contact pads (8 × 5 mm2) at both ends of the interconnect were designed for connection to electrical measuring instruments and clamping to a tensile testing machine. In this study, the elongation appl (engineering strain applied to entire structure) is defined as Δl3/l3 [%].
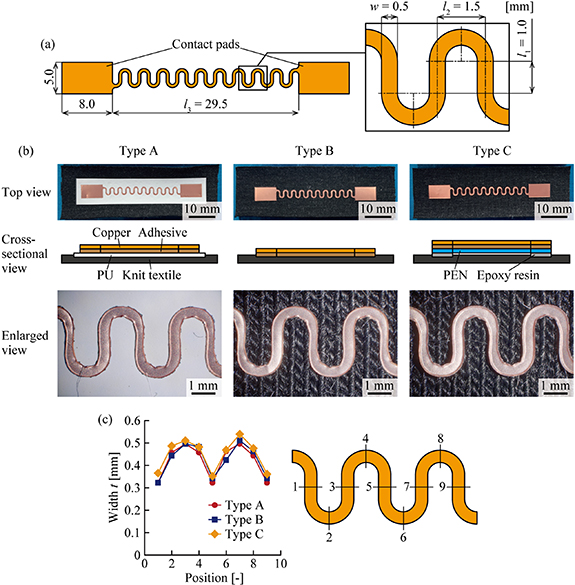
Figure 1. (a) Schematic of geometric parameters for serpentine interconnect. (b) Optical images and schematics of interconnect on knit textile with different laminated structures. (c) Measurement and comparison of interconnect width w for each structure type.
Download figure:
Standard image High-resolution imageFigure 1(b) shows the optical images and schematics of serpentine interconnects on knit textiles with different laminated structures. Referencing previous studies [16, 17, 22], three types of laminated structures were used: copper adhered to a polyurethane (PU) laminated knit textile (type A); copper adhered directly to a knit textile (type B); and polyethylene-naphthalate (PEN)-laminated copper adhered to a knit textile only at both ends of the interconnect (type C). The copper layer is adhered to the next layer with a soft adhesive layer. Thicknesses of each layer were 0.018, 0.02, 0.1, 0.3, and 0.05 mm for copper, adhesive, PU, knit textile, and PEN, respectively. The properties of the knit textile used in this study are as follows: it is knitted with plain stitch (jersey stitch), and consists of 89% of rayon, 6% of acrylate, and 5% of PU. The thread diameter is approximately 0.2 mm. The knit textile was stretched along its course direction (meandering path direction of thread), and the failure elongation of the knit textile with the course direction is approximately 130%. Under the cyclic tensile deformation, the knit textile does not return to its initial length completely, even when the stretching is released in the elastic region of the thread. For example, after the knit textile is stretched to 150% of its initial length, it returns to 102%–103% of its initial length. Comparing types A and B, the Young's modulus of textile substrate differ considerably (4.1 MPa and 36 kPa at 10% strain for PU and knit textile, respectively). This difference must cause smaller lateral buckling in the interconnects with type-A structure. On the other hand, the interconnects with type-C structure can deform freely from the textile substrate layer. Therefore, the type-C structure must induce larger lateral buckling than types A and B.
For the fabrication processes of each laminated structure, the copper layer was patterned by cutting with a cutting plotter machine, and then transferred to the textile substrate layer, because of its processability without chemical and thermal damage and applicability for large area [26]. For type A, a copper foil with an adhesive (CU-18, 3M) was first laminated onto a thermal-release adhesive sheet (Revalpha, Nitto Denko) with the adhesive of copper foil face up. Then, the copper and adhesive layers were patterned to the serpentine interconnect with a cutting plotter machine (CE6000-40, Graphtec). The excess areas of copper and adhesive were peeled off using tweezers. A PU film (cut to 10 × 50 mm2) was thermally laminated to a knit textile (cut to 20 × 60 mm2) using a clothing iron. Finally, the copper and adhesive layers were adhered to the PU layer and released from the thermal-release adhesive sheet by heating them to 100 °C using a hot plate. For type B, a copper foil with an adhesive was also patterned to the serpentine interconnects using the same process as type A. Then, the copper and adhesive layers were adhered to a knit textile and released from the thermal-release adhesive sheet by heating them to 100 °C. For type C, a copper foil with an adhesive was first laminated on a PEN film (Teonex Q51, Teijin). Then, the copper, adhesive, and PEN layers were laminated on a thermal-release adhesive sheet and also patterned to the serpentine interconnect using the same process as type A. Two-part epoxy resin (Araldite Rapid, Huntsman) was applied only on the contact pads and adhered to a knit textile. Finally, the copper, adhesive, and PEN layers were released from the thermal-release adhesive sheet by heating them to 100 °C.
The interconnect width w of each structure type was measured and compared at each illustrated position, as shown in figure 1(c). Although w was different within the range of 0.32–0.54 mm at each measurement position, the interconnects with each structure type had almost same geometry. The difference in w must have been caused by the distortion of cutting path due to the shaft misalignment between the center and top of the cutter blade.
2.2. Measurement setup and conditions
Figure 2 shows measurement setup of the tensile test. The prepared sample was clamped to a tensile testing machine (AGS-X, Shimazu), and tensile deformation was applied to the sample. The electrical resistance of the serpentine interconnect R was measured using four-terminal sensing method. A constant-current power supply (PA36-2B, Texio) was connected to the contact pads, and a constant current of 100 mA was applied to the interconnect. A data logger (GL900, Graphtec) was also connected to the contact pads, and the voltage between the contact pads was measured. R was calculated by dividing the measured voltage by the current of 100 mA. The average of initial resistance R0 was 0.15, 0.15, and 0.14 Ω for types A, B, and C, respectively. The resistance value was almost stable while the sample was not stretched.

Figure 2. Measurement setup of tensile test.
Download figure:
Standard image High-resolution imageIn the measurement, the tensile test with single large deformation was first conducted, and the elongation to failure for each type of structure was measured. The deformation speed of the tensile test with single large deformation was 14.8 mm min−1 (elongation appl of 50% min−1). Then, the tensile test with cyclic large deformation was conducted. The elongation applied to each sample appl was determined based on the elongation to failure, and appl was 7, 10, 12, 15, 20, 25, and 30% for type A; 10, 15, 20, 25, 30, 35, and 40% for type B; and 40, 45, 50, 55, 60, 65, and 70% for type C. The deformation speed of the tensile test with cyclic large deformation was 20 cycles min−1.
3. Results and discussion
3.1. Measurement result
Figure 3(a) shows the resistance change of the serpentine interconnects under single large deformation. The resistance change rate was calculated as ΔR/R0 [%]. For each structure type, the resistance change rate was almost constant at zero when the elongation appl was relatively low. Subsequently, the resistance change rate increased gradually as appl increased, and it then increased sharply at appl = 46, 66, and 91% for types A, B, and C, respectively. This indicates that a failure occurred in the interconnect. Therefore, these points of appl are the elongation to failure. Figures 3(b)–(d) show the resistance change of the interconnect under cyclic large deformation with appl of 12, 20, and 30% for the type A; 20, 30, and 40% for the type B; and 50, 60, and 70% for the type C. For each structure type, the resistance change rate was also almost constant at zero when the cycle number N was relatively low. Subsequently, the resistance change rate increased gradually as N increased, and it then increased sharply. This indicates that a failure occurred in the interconnect. Therefore, these points of N are the cycle number to failure Nf. Figure 3(e) shows the relationship between the applied strain appl and cycle number to failure Nf, in a log–log graph. For each structure type, the plots are almost straight lines. This indicates that each plot has a power-law relationship between appl and Nf, and the type-C interconnects had highest lifetime. The lines in figure 3(e) show the power-law fitting lines for each structure type. Those were calculated using the least-squares method in the log–log graph. For the coefficient of the power law, the values are considerably different and the interconnect with type-C structure shows the greatest value: 45, 108, and 224 for types A, B, and C, respectively. On the other hand, for the exponent of the power law, the values are close to each other: −0.27, −0.29, and −0.22 for the type A, B, and C, respectively. Additionally, a previous study [22] reported close values, −0.36 and −0.27, for the power-law fitting lines of the relationship between appl and Nf, for serpentine interconnects made of copper. These results indicate that the laminated structure significantly affects the coefficient of the power law, whereas there are few effects on the exponent.
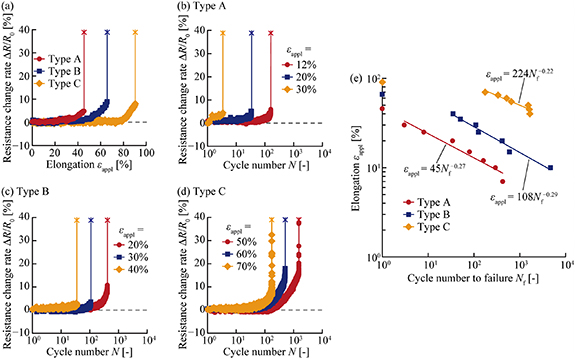
Figure 3. (a) Resistance change under single large deformation for each structure type. (b)–(d) Resistance change under cyclic large deformation with elongation appl of 12, 20, and 30% for type A; 20, 30, and 40% for type B; and 50, 60, and 70% for type C. (e) Relationship between elongation appl and cycle number to failure Nf for each structure type.
Download figure:
Standard image High-resolution image3.2. Analytical calculation
For a better understanding of the measurement results obtained in figure 3(e), the relationship between the elongation appl and cycle number to failure Nf was analyzed using analytical calculation. When the entire structure of the serpentine interconnect is deformed with appl, the maximum local strain max occurs at a certain point in the serpentine. Fatigue failure caused by crack propagation must occur at the point where max occurs. The relationship between max and Nf can be given by the Basquin's equation and Coffin–Manson equation [27]. Therefore, the relationship between max and appl was analytically calculated first, and the relationship between appl and Nf was then analytically calculated. Here, for simplification, we assume that a serpentine interconnect spans a space between the fixed supports, corresponding clamped boundary condition at two ends. The interconnect can deform freely, and the interaction between the interconnect and the textile substrate can be neglected. The interconnect width w is much larger than its thickness t. In this case, when the interconnect is stretched from both ends, the interconnect experiences combined bending and shearing. Then, lateral buckling occurs when appl reaches a certain critical value. During the lateral post-buckling, the maximum local principal stress max can be expressed mainly by the superposition of the out-of-plane bending and in-plane bending strains. A previous study gives max in elastic region as follows [25]:
where g1 and g2 are the coefficient determined by the number of unit cells of serpentine m and the ratio of length and spacing α = l2/l1. When the interconnect is adhered to the textile substrate, g1 and g2 must be also determined by the laminated structures. The first and second terms correspond to the out-of-plane bending and in-plane bending strains, respectively.
For the serpentine interconnects prepared in this study, we calculated the maximum local strain max determined by the elongation app using equation (1). In the calculation, l1, l2, w, t, m, and α were 1.0, 1.5, 0.5, 0.018 mm, 9, and 1.5, respectively. For g1 and g2, the values were listed in the tables of a previous study [25], and the values of α = 1 and 2 were used: g1 = 0.93 and g2 = 6.3 × 10⁻³ for α = 1, g1 = 0.48 and g2 = 1.9 × 10⁻³ for α = 2. Figure 4 shows the calculation result of max determined by appl in a log–log graph. max is plotted from appl = 0.2%, because we calculated that lateral buckling occurs when appl reaches approximately 0.2%, using an equation in a previous study [25]. When appl ranges from approximately 0.2 to 1%, the slopes of each curve are 0.5. This indicates that the first term is dominant in equation (1) when appl is relatively small. On the other hand, the slopes increase gradually as appl increases, and they are 2.0 when appl is greater than approximately 10%. This indicates that the second term is dominant in equation (1) when appl is relatively large. Note that equation (1) can be used when max in the elastic region. The yield strain of copper is 0.3% [28]; therefore equation (1) must be applicable when appl is lower than approximately 10%–20%. On the other hand, considering the experimental results obtained in figure 3(a), the elongation to failure of type C structure (where the interconnect can deform freely from the textile substrate) was 91%. The fracture strain of copper is 10% [29]. Therefore, figure 4 indicates that max and appl maintain the relationship during a relatively large strain level of appl that is plastic region. In the experiment, appl ranges between 7 and 70%. Therefore, in this study, equation (1) can be rewritten as

Figure 4. Maximum local strain max determined by elongation (engineering strain) appl during lateral post-buckling.
Download figure:
Standard image High-resolution imageFocusing on the relationship between the maximum local strain max and cycle number to failure Nf, the Basquin's equation and Coffin–Manson equation give a following relationship [27]:
where E is the Young's modulus, and σf', b, f', and c are material constants. The first and second terms correspond to the high-cycle fatigue failure (failure in elastic strain level) and low-cycle fatigue failure (failure in plastic strain level). Figure 4 indicates that max reaches almost into the plastic region in this study. Therefore, equation (3) can be rewritten as

where A is a coefficient determined by the material properties. From equations (2) and (4), we can obtain the relationship between the elongation appl and cycle number to failure Nf that it is given by

where A' is the coefficient determined by the material properties, geometric parameters, and laminated structures. Equation (5) indicates that appl and Nf have the power-law relationship, and the exponent is determined only by c that is known as the fatigue ductility exponent commonly ranging from −0.5 to −0.7. For copper foils, c is approximately from −0.5 to −0.4 [30]. That is close to a double of the exponent obtained in the experiment (−0.27, −0.29, and −0.22 for type A, B, and C). Therefore, these results enhance the reasonability of the relationship obtained in the measurement.
3.3. Buckling and crack observations
Figure 5 shows the surface height of the serpentine interconnect from the textile substrate under single large deformation. The surface height was observed using a laser microscope (VK-X1100, Keyence). In the observation, the prepared sample was clamped to a pair of small movable stages with the contact pads, and tensile deformation was gradually applied. For each structure type, the height was not uniform in the interconnect, and the difference in height increased with the elongation appl. This indicates that lateral buckling occurred in the interconnects. For type A, the difference in height was smaller than that of types B and C. This indicates that the lateral buckling was inhibited by the PU layer that has the greater Young's modulus than the knit textile (4.1 MPa and 36 kPa at 10% strain for PU and knit textile, respectively). This might cause a larger strain energy in the interconnect, and therefore the interconnects with type-A structure showed the lowest failure lifetime in the experiment. For type B, the difference in height was relatively low during appl of 0%–20%, and then increased suddenly after appl was 20%. This indicates that a part of the copper was peeled off from the knit textile when appl was relatively large. This partial peeling might occur when the cyclic deformation is applied, and it induces a larger strain level than that caused in lateral buckling with a freely deformable structure (type-C structure). Therefore, the interconnect with type-B structure showed a lower lifetime than that of type C in the experiment.

Figure 5. Surface height of serpentine interconnect from textile substrate under single large deformation.
Download figure:
Standard image High-resolution imageFigure 6 shows the scanning electron microscope (SEM) images of the failure part of the serpentine interconnect after large cyclic deformation with elongation appl of 15, 30, and 65 for types A, B, and C, respectively. For each structure type, a single crack propagated thoroughly across the width of the interconnect at the half-circle segment. This indicates that the maximum local strain max occurred in the half-circle segment, although the displacement of lateral buckling was different, as shown in figure 5.

Figure 6. SEM images of failure part of serpentine interconnect after large cyclic deformation.
Download figure:
Standard image High-resolution image4. Demonstration of washing durability of e-textile device
4.1. Fabrication of cloth-face-mask-type device
This study also demonstrates the washing durability of an e-textile device using serpentine interconnects with type-C structure. In this study, we fabricate a cloth-face-mask-type device monitoring facial skin temperatures at multiple points. This device aims for health monitoring and emotion estimation [31, 32] in everyday life. Figure 7(a) shows a flexible and stretchable circuit for the cloth-face-mask-type device. The circuit consists of the serpentine interconnects with type-C structure, analog temperature sensors for the cheek and top of the nose (SOT-23, Microchip Technology), microcontroller wireless communication module (TWE-L-WX, Mono Wireless), and a coin battery. For the interconnect, a 0.05 mm thick polyimide film (Kapton 200EN, Du Pont-Toray) was used instead of a PEN film. The temperature sensors and microcontroller module were connected with the interconnects each other, and they were soldered to the copper layer. The soldered parts were encapsulated with epoxy resin to enhance washing durability. Additionally, the interconnects were fixed by the epoxy resin at the fixed supports, to prevent the entanglements of interconnect each other. The interconnects and components were coated with a polyvinyl butylal-based insulator (Hayacoat Mark 2 EF (green), Sunhayato) to prevent electrical short circuits. The connection parts between the interconnect and microcontroller module were connected using small screws. The circuit was adhered to a cloth face mask at the fixed supports with an adhesive, as shown in figure 6(b). Through-holes for temperature sensors were patterned on the cloth face mask, and the temperature sensors can contact with the face via the through-holes.

Figure 7. (a) Flexible and stretchable circuit for cloth-face-mask-type device. (b) Cloth-face-mask-type device mounted on mannequin.
Download figure:
Standard image High-resolution image4.2. Evaluation of washing durability
The washing durability of cloth-face-mask-type device was evaluated by repeated washing test. Figure 8(a) shows the evaluation setup for facial skin temperature monitoring using a mannequin. The flexible heaters, which consist of soft PU sheet and nichrome wire, were laminated on the cheek and nose of the mannequin. The device was mounted on the mannequin, and the temperature variations at the cheek and top of the nose caused by the flexible heater were monitored before and after the washing test. For the washing test, the device was washed using a washing machine (MWM1000, Mitsukin Shoji), as shown in figure 8(b). During the washing test, the microcontroller module and coin battery were removed from the circuit by removing the screws at the connection points. The washing time of one cycle was 15 min, and tap water was used. The temperature of tap water is approximately room temperature, and detergents were not used. The washing time and temperature were determined based on Japanese Industrial Standard (JIS) L 1930, which contains the washing and drying procedures for textile testing. Following the washing, the device was naturally dried at room temperature. The washing was repeated until failure was observed in the circuit.
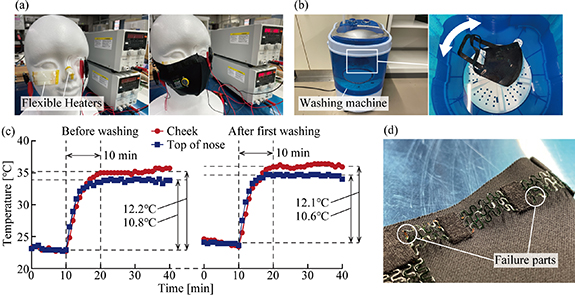
Figure 8. (a) Evaluation setups for facial skin temperature monitoring using mannequin. (b) Evaluation setup for repeated washing test using washing machine. (c) Temperature variation monitored by cloth-face-mask-type device before and after first washing. (d) Optical image of failure part of interconnect after ninth washing.
Download figure:
Standard image High-resolution image
Figure 8(c) shows the temperature variation monitored by the cloth-face-mask-type device before and after the first washing. Before washing, the temperatures increased by 12.2 and 10.8 °C for the cheek and top of nose in 10 min, respectively. After the first washing, the temperature increased by 12.1 and 10.6 °C for the cheek and top nose in 10 min, respectively. This indicates that the device stably monitored facial skin temperatures even after washing. Then, the washing test was repeated, and multiple failures were observed in the interconnects after the ninth washing. Failures occurred around the fixed supports, as shown in figure 8(d). This indicates that the strain caused around the fixed support was greatest in the interconnect during the washing test for the type-C structure. The transition area from the interconnect to the contact pad or fixed support is well known as a critical area where failure often occurs [17, 33]. One practical solution is to widen the interconnect width w around the contact pad or fixed support with the gradual transition [33].
5. Conclusions
This study investigated the relationship between the elongation appl and cycle number to failure Nf, on serpentine interconnects for e-textiles under large cyclic deformation. In the measurement, interconnects having same conductive material and geometric parameters but with different laminated structures were prepared, and Nf was measured with appl of 7%–70%. The measurement results confirm that the interconnects with type-C structure had the highest failure lifetime, and appl and Nf have the relationship of power law. The power-law fitting lines indicate that the coefficient of power law is significantly different (45, 108, and 224 for types A, B, and C, respectively), but the exponent is close to each other (−0.27, −0.29, and −0.22 for type A, B, and C, respectively). In the analysis, the analytical calculation indicates that the coefficient is determined by the material properties, geometric parameters, and laminated structures; on the other hand, the exponent is determined only by the material properties. These clarifications will contribute to the failure lifetime prediction of serpentine interconnects. Moreover, the washing durability of cloth-face-mask-type device using interconnects with type-C structure was demonstrated. The demonstration confirmed that the device could stably monitor the temperature variations before and after the first washing, and multiple failures occurred in the interconnects after the ninth washing.
Acknowledgment
This research received no external funding.
Data availability statement
All data that support the findings of this study are included within the article (and any supplementary files).