

Abstract
An ionic liquid ion source (ILIS) is a kind of high brightness ion source capable of providing high-speed positive or negative ion beams. This paper presents a miniaturized ILIS based on an array of porous metal strips. The porous emitter array, integrated with seven 10 mm long strips, is fabricated using wire electrical discharge machining (WEDM) combined with electrochemical etching. The assembled ILIS is 30 mm × 30 mm × 17.5 mm in size and weighs less than 25 g. A series of experiments, including an I–V characteristic test, a retarding potential analyzer (RPA) test, and a spatial plume distribution test, have been conducted in vacuo to characterize the performance of the ILIS. Results show that the emitted current is up to about 800 μA and ion transparency is as high as 94%. Besides, RPA curves reveal that the total fragmentation rate of the emitted particles accounts for 48.8% in positive mode and 59.8% in negative mode. Further, with the increase in applied acceleration voltage, the voltage loss rises while the energy efficiency decreases. It is also found that the plume perpendicular to the strips has a higher divergence than the one parallel to the strips. A numerical simulation by COMSOL reveals that the electric field distribution between the two electrodes results in such a spatial plume profile.
Export citation and abstract BibTeX RIS
1. Introduction
An ionic liquid ion source (ILIS) is a promising ion source based on the electrospray phenomenon. Conductive fluids subjected to strong electric fields deform from a rounded shape into a conical structure and emit charged droplets, ions, or a mixture of both [1], known as electrospray. Traditional electrospray sources emit combinations of ions and charged droplets from organic solvents [2–4], such as doped glycerol and formamide. However, ILISs produce purely positive or negative ion beams from ionic liquids (ILs). ILs are molten salts at room temperature. Unlike those solvents, ILs are composed of cations and anions, exhibiting relatively high electrical conductivities, low volatility as well as high thermal stability [5]. ILs were first applied in electrospray by Romero Sanz et al in 2003 [6], and it was discovered that pure ion emission could be achieved with EMI-BF4 at low flow rates. Apart from EMI-BF4, EMI-Im and EMI-(HF)2.3F have been reported to reach the purely ionic regime (PIR) [7, 8].
ILISs can be applied to a wide range of areas, from micro-fabrication to space propulsion [9–12]. There are many benefits of using ILISs as electric thrusters. Firstly, the emitted ions in ILISs are accelerated to a high velocity of the order of magnitude of 105 m s−1, contributing to a high specific impulse. Besides, no gas discharge is required to produce charged particles compared with plasma sources [13–15]. The liquid propellant can be passively fed by capillary force. The removal of additional pumps, valves and pipelines makes the whole system light and compact. Furthermore, compared with liquid metal ion sources (LMISs), ILISs need no heaters and operate at a lower voltage [16, 17], resulting in a considerable reduction in power consumption.
An ILIS device basically consists of an emitter, an extractor, a storage tank, and housing. A sufficiently high voltage difference is applied between the emitter and the downstream extractor so that a strong electric field is formed in the vicinity of the emitter tip. Ions are extracted from the electrified menisci formed on the emitter tip and accelerated by the electrostatic field. Ion emission from the menisci of ionic liquid formed in vacuo is taken to obey the kinetic law [18]

where  is the current emitted per unit area of the meniscus surface,
  is the density of surface charge,
  is the Boltzmann's constant,
  is the liquid temperature,
  is the Planck's constant,
  is the activation energy barrier for solvated species,
  is the normal component of the electric field acting at the meniscus exterior on the vacuum side, and
  is the reduction of
  due to the presence of the electric field.
  is assumed to take the form
  in which
  is the permittivity of the vacuum and
  is the charge of the emitted ions. Significant fluxes can only begin when
  approaches
  [19]. The solvation energy for ionic liquid is about 1–2 eV, thus
  is estimated to be 0.1–1 V nm−1.
To amplify the electric field intensity, emitters are usually terminated by sharp geometries with an apex curvature radius of several to tens of microns. Further, to scale up the total emitted current, emitters are fabricated into linear or planar arrays [20–22]. There are generally three types of emitters: capillary emitters, externally wetted emitters, and porous emitters, as shown in figure 1. Capillaries have been used as emitters since the 1960s. However, micro-fabricated capillary arrays would be unable to produce stable emissions from all capillaries since the hydraulic impedance is not high enough. Though increasing the capillary aspect ratio seems to be an effective way to solve this problem, the method suffers from larger operating voltages and capillary clogging. Another drawback of capillary emitters is the addition of a liquid supply system, increasing the volume and weight of ILIS. As to externally wetted emitters, clogging can be avoided using such an open architecture. Another advantage of externally wetted emitters is that ionic liquid can be passively fed without any pumps or valves. But challenges lie in the improvement of the wettability of emitters and the sustainability of liquid supply.
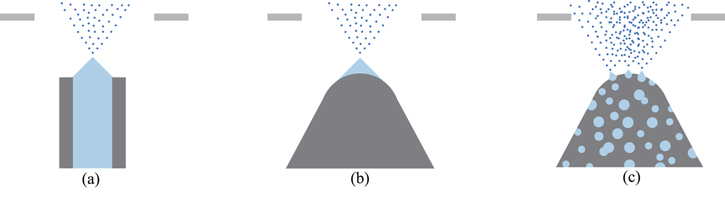
Figure 1. Three types of electrospray emitters: (a) capillary, (b) externally wetted, and (c) porous.
Download figure:
Standard image High-resolution imageAmong the three types of emitter configurations, porous emitters are adopted by an increasing number of ILIS applications. In a porous ILIS, inner pore structures provide multiple paths to arrive at the tips, and liquid can be passively fed via capillary force. Porous metals are important materials for ILIS emitters. Legge et al firstly proposed linear emitter arrays fabricated from porous tungsten by electrochemical etching [22]. Porous emitters were shown to generate a wide range of emitted currents up to levels generally greater than those in externally wetted emitters. Further, a planar array of 480 individual emitter tips was achieved on a 1 cm2 porous nickel substrate by Courtney et al to improve the integration of the emitters [21]. In the subsequent studies, the substrate of the emitters was expanded to porous glass and carbon xerogels [23, 24], and laser ablation was used to fabricate the emitter array. Except for sharp tips, emitters are also fabricated into an array of strips terminated with triangular prisms. Courtney et al manufactured a porous glass ILIS with strip emitters using conventional mill [20]. Chen et al developed a porous ceramic ILIS with strip emitters by sintering [25]. However, porous metal strip emitters are difficult to machine by electrochemical micromachining (suffering from geometry nonuniformity) or laser ablation (problems in pore blocking). Thus, few investigations of ILISs with an array of porous metal strips have been reported in the literature before.
This paper presents a miniaturized ILIS based on an array of porous stainless steel strips. Section 2 gives the description of the processes of the emitter preparation and ILIS fabrication. To characterize the developed ILIS, an I–V characteristic test, a retarding potential analyzer (RPA) test, and a spatial plume distribution test are conducted. Section 3 describes the experimental apparatus of the tests, and the results are revealed and discussed in section 4.
2. Emitter preparation and ILIS fabrication
The schematic diagram of the designed ILIS is depicted in figure 2. The ILIS includes a porous emitter array, an extractor, a storage tank, a distal electrode and housing. The emitter is a seven-strip array integrated on a porous stainless steel substrate. The trigonous strip is 1 mm tall and the stepped substrate has a total height of 3 mm. The adjacent strips are spaced by 2 mm, and each of them is 10 mm long. Ionic liquid EMI-BF4 (1-ethyl-3-methylimidazolium tetrafluoroborate, and the molecular formula is C6H11BF4N2) is used in this paper. EMI-BF4 is passively fed from the porous reservoir to the emitter by capillary force. The high voltage power supply represents either a positive or a negative high voltage source. When operating the ILIS with a positive bias, positive particles are emitted. On the contrary, when operated in negative polarity, negative particles are emitted.
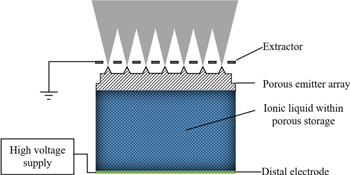
Figure 2. Schematic diagram of the designed ILIS.
Download figure:
Standard image High-resolution imageThe emitter array is prepared using wire electrical discharge machining (WEDM) combined with electrochemical etching, as proposed in [26]. The fabricated emitter array is observed by KEYENCE VHX-5000 digital microscope with a large depth of field and accurate measurement capabilities. The apex curvature radii of the strips range from 6 μm to 10 μm, as shown in figure 3, and the surface roughness along the apex of the emitter strip is around 10 μm.

Figure 3. Observation of the emitter under the digital microscope: (a) overall geometry and (b) measurement of the radii of apex curvature (rainbow bar denotes the relative height of the strip, μm).
Download figure:
Standard image High-resolution imageThe extractor is laser cut from a 120 μm thick stainless steel sheet. Seven linear extractor holes are 0.6 mm in width with a pitch distance of 2 mm. The storage tank is integrated with housing which is computerized numerical control (CNC) machined from a polyetheretherketone (PEEK) bulk. After being wetted in vacuo, the emitter array is assembled with the extractor and the housing through screw fastening. The emitter and the extractor hole are aligned with the aid of the microscope, as shown in figure 4(a). Actually, the geometry between the emitter and the extractor is difficult to observe using a normal optics microscope. At hundreds of times magnification, the microscope can only focus on one plane, while the areas on other planes are blurry. Since the emitter apex and the extractor are not in the same plane, it is very hard to capture the geometry between the two electrodes. To solve the problem, the super deep scene digital microscope (KEYENCE VHX-5000) is used, which can capture the geometries at hundreds of separate focusing planes by automatically lifting the lens, and then reconstruct a 3D geometry by its internal image processing technology. In the 3D reconstruction process, the entity margins can be well captured, while the void margins are distorted to some extent. Thus, the scan geometry looks like a 'W' shape in figure 4(a). However, what we are concerned about, such as the distance between the two electrodes and the alignment of the emitter, can be successfully achieved by the 3D geometry. The points 1, 2 and 3 are measurement points, taken from the two edges of the extractor and the emitter apex, respectively. The horizontal distances between the emitter apex and the two edges of the extractor are 295.82 μm and 303.50 μm, showing a good symmetry. The distance between the emitter apex and the upper surface of the extractor is 262.26 μm, meaning that the distance from the emitter apex to the lower surface of the extractor is around 140 μm. The assembled thruster measures 30 mm × 30 mm × 17.5 mm with a wet weight of less than 25 g, as shown in figure 4(b).
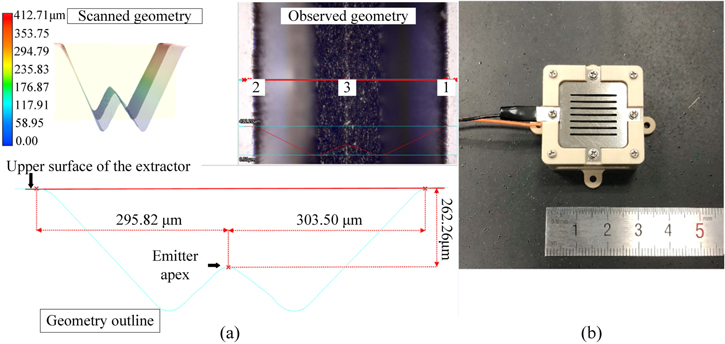
Figure 4. Assembly of the ionic liquid electrospray thruster: (a) alignment under microscope (rainbow bar denotes the relative height of the scanned geometry) and (b) the assembled thruster.
Download figure:
Standard image High-resolution image3. Experimental apparatus
The experiments are conducted in vacuo in the State Key Laboratory of Mechanical System and Vibration in Shanghai Jiao Tong University. The experimental facilities and instruments are shown in figure 5, including a vacuum chamber, two high voltage power suppliers, a digital multimeter, a signal generator as well as a high voltage amplifier. The vacuum chamber is 0.6 m in diameter and 1 m in length with two mechanical pumps, a roots pump, and two turbo molecular pumps, which can achieve a base pressure of 5 × 10⁻⁴ Pa. The positive high voltage power supplier (Spellman SL30P30) and the negative one (Boher LAS-20kV-200N) provide acceleration voltages for the ILIS. The digital multimeter (Keithley DMM 7510) is used to measure and record the voltages and currents. Besides, the signal generator (Tektronix AFG 3022B), together with the high voltage amplifier (Matsusada AMPS-20B20), can provide sweeping voltage for the RPA test.
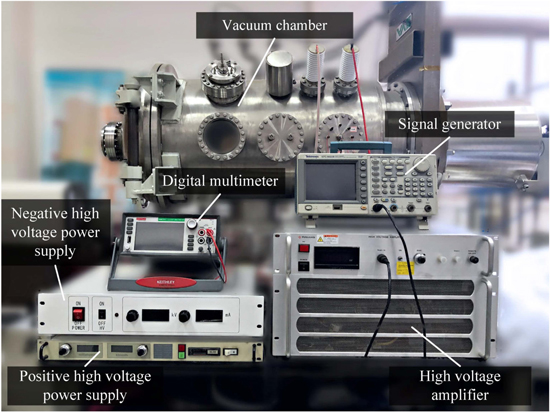
Figure 5. Experimental facilities and instruments used in the tests.
Download figure:
Standard image High-resolution image3.1. I–V characteristic test
Either the positive or negative high voltage supply is connected to the distal electrode, and the extractor is grounded. In the positive mode, the voltage is regulated from 0 to +3000 V, and in the negative mode, the voltage is regulated from 0 to −3060 V. Both the emitted current, which is the current drawn by the emitter from the high voltage supply, and the intercepted current, which is defined as the current measured from the extractor to ground, are obtained by measuring the voltage drop across a 1 kΩ resistor.
3.2. Retarding potential analysis test
The RPA test is performed to measure the energy distribution of the emitted particles. The actual acceleration voltage is usually smaller than the acceleration voltage applied between the distal electrode and the extractor from the high-voltage power supply. Thus, the RPA test can obtain the nonkinetic voltage losses. Further, ion fragmentation, which is the break-up of the emitted ion clusters, occurs during the ionic liquid electrospray process, and RPA test can measure the rates of fragmentation of ion clusters by analyzing the RPA curves.
As suggested in [27], a four-grid design is adopted in the RPA. The RPA device consists of a four-layer grid assembly, a metal shielding, and a collector, as depicted in figure 6. The first layer of the grid is grounded, and both the second and the fourth layers of the grids are connected to a voltage of −40 V to suppress the secondary electron emission. The third grid is the retarding grid, connected to the sweeping voltage generated from a signal generator and a high voltage amplifier. The RPA device is installed 95 mm away from the source. The center of the ILIS and the center of the RPA aperture are mounted coaxially. The flying particles enter the RPA device through the front aperture, pass the four layers of grids, and finally arrive at the collector. The collected currents are measured and recorded by a Keithley DMM 7510 digital multimeter.
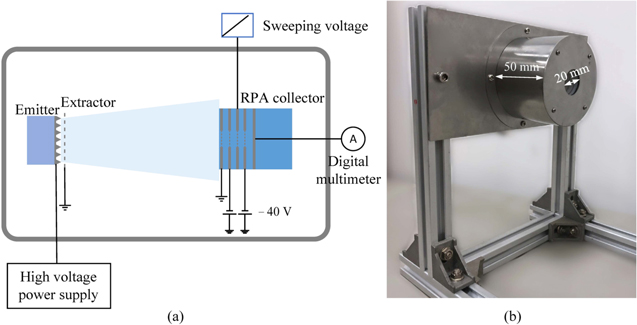
Figure 6. (a) Schematic diagram of the RPA setup and (b) RPA collector.
Download figure:
Standard image High-resolution image3.3. Spatial plume distribution measurement
The spatial plume distribution is tested by measuring the collected current when rotating the ILISs either parallel to the strips or perpendicular to the strips, as shown in figure 7. The ILIS is installed on a rotating platform, and the rotating shaft traverses the emission plane. The rotary motion of the platform is driven by a turbine worm mechanism connected to a stepper motor, and the rotational speed can be regulated by the frequency of the pulse signal input. The rotational angular speed is set to six degrees per second in the test.
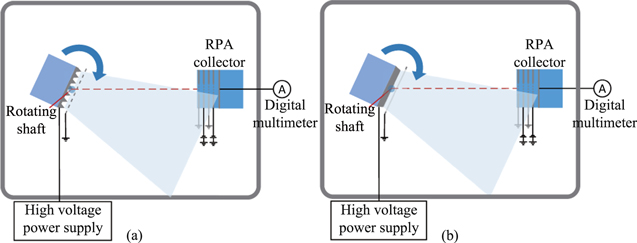
Figure 7. Schematic diagram of the spatial plume distribution setup: (a) rotating parallel to the emission strips and (b) rotating perpendicular to the emission strips.
Download figure:
Standard image High-resolution imageThe RPA collector is used to collect the emitted current, mounted 155 mm downstream from the source. Unlike the RPA test, all four layers of grids, including the retarding grid, are grounded. A similar method using the RPA device to collect the ion plume with the sweeping grid grounded was implemented in [23]. The ILIS center, aperture center, and collector center are installed coaxially. By rotating the ILIS, the plume with a certain divergence angle can selectively pass through the RPA aperture. Thus, the spatial plume distribution can then be measured from the collected current.
4. Results and discussion
4.1. I–V characteristics
The variation of both emitted current and the intercepted current with the applied acceleration voltage is shown in figure 8. The startup voltage  which is defined as the minimum voltage that starts an electrospray emission, is 1280 V. Apart from the experimental value, the startup voltage can also be estimated by the following equation [28]

where  is the surface tension coefficient,
  is the apex curvature radius of the emitter,
  is the mean pore radius of the emitter, and
  is the distance between two electrodes. Given that the apex curvature radii and pore sizes fluctuate in a range, an accurate estimation of the startup voltage is not expected. Here, we take some typical values in the range to calculate the startup voltage. Taking
  = 45.2 mN m−1,
  = 140 μm,
  = 3 μm, and
  = 9 μm, the calculated startup voltage is 1217 V, with an error of 4.9% compared with the experimental value.

Figure 8. I–V characteristic curve of the ILIS.
Download figure:
Standard image High-resolution imageBoth the emitted current and the intercepted current grow with the increase of the applied acceleration voltage. In the positive polarity, the curve is similar to quadratic from the startup voltage to 2500 V while it is similar to linear form 2500 V to 3000 V. The emitted current reaches 804 μA at +3000 V, and −790 μA at −3060 V, and the intercepted current is within 6% of the emitted current, meaning that the ion transparency is up to 94%.
4.2. Fragmentation of the ILIS
The normalized RPA curves for both positive and negative modes are plotted in figure 9. As the sweeping voltage of the retarding grid increases from zero to the acceleration voltage, the normalized collected current first holds steady, then experiences three stages of decline, and finally decreases to zero in both polarities. The overall RPA curves are generally consistent with some other RPA studies of ILISs [25, 29, 30]. According to the working principles of the ILISs, the emitted charged particles gain kinetic energy through electrostatic acceleration between emitter and extractor. If all the particles have the same kinetic energy, the collected current will maintain a steady value and dramatically decrease at a specific voltage. Therefore, the RPA curves indicate that the plume is not monoenergetic.
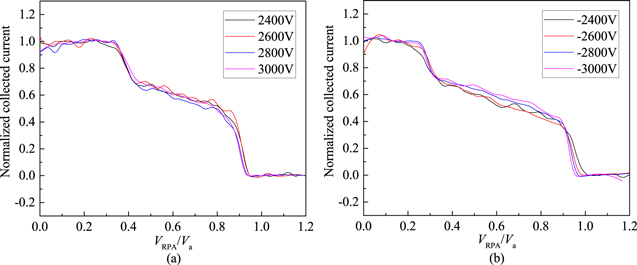
Figure 9. Normalized RPA curves: (a) positive mode and (b) negative mode.
Download figure:
Standard image High-resolution imageThe divergence of the energy distribution may be derived from ion extraction or ion fragmentation. Our previous time of flight test showed that the plume is mainly composed of monomers [31] (single ions, EMI+ or  ) and dimers (single ions combined with a molecule, (EMI-BF4)EMI+ or (EMI-BF4)
 ), very little, if any, trimer (single ions combined with two molecules, (EMI-BF4)2EMI+ or (EMI-BF4)2
 ) or droplets. The relative molecular mass, molecular mass, charge, and charge to mass ratio of the ion species are listed in table 1. The inexistence of droplets contributes to concentrated extraction voltages. The energy of ions to be extracted from the ionic liquid is small (1–2 eV), which means there is little possibility of such significant energy dispersion (hundreds of eV) caused by ion extraction. Thus, only ion fragmentation effects need further consideration.
Table 1. Relative molecular mass, molecular mass, charge, and charge-to-mass ratio of the ion species.
| Ion species | Relative molecular mass | Molecular mass (kg) | Charge (C) | Charge-to-mass ratio |
|---|---|---|---|---|
| EMI+ | 111.17 | 1.85 × 10⁻²⁵ | 1.60 × 10⁻¹⁹ | 8.64 × 10⁵ |
| (EMI- BF4) EMI+ | 309.14 | 5.15 × 10⁻²⁵ | 1.60 × 10⁻¹⁹ | 3.11 × 10⁵ |

| 86.80 | 1.45 × 10⁻²⁵ | 1.60 × 10⁻¹⁹ | 1.11 × 10⁶ |
(EMI-BF4) 
| 284.77 | 4.75 × 10⁻²⁵ | 1.60 × 10⁻¹⁹ | 3.37 × 10⁵ |
If the fragmentation occurs in the field-free region, as shown in figure 10, which means the acceleration process is completed, according to the principle of conservation of energy

where  is the mass of a molecule,
  is the mass of a monomer ion,
  is the velocity after electrostatic acceleration,
  is the charge of a monomer ion, and
  is the applied acceleration voltage.

Figure 10. The segment marked in red represents the fractions fragmented in the field-free region.
Download figure:
Standard image High-resolution imageSupposing that the velocity of the neutral molecule and the monomer ion remains unchanged after fragmentation, the accelerated ion travels at an invariable speed until it is stopped by the retarding grid

where  is the potential of the retarding grid. The ratio of
  and
and  can be obtained from equations (3) and (4)

The ratio is a constant only depending on the masses of the monomer ion and the molecule. For EMI-BF4,  is 0.36 in positive mode and 0.30 in negative mode. The segment indicating fragmentation in the field-free region is marked in red in the RPA curve in figure 10.
If the dissociation of ion clusters takes place in the acceleration region, as shown in figure 11, both the molecule and the monomer ion are accelerated until they get to the departure position

where  is the velocity of the molecule and the monomer ion, and
  is the electric potential of the departure position.
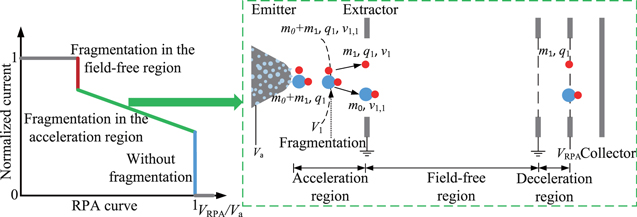
Figure 11. The segment marked in green represents the fractions fragmented in the acceleration region.
Download figure:
Standard image High-resolution imageAfter departure, the ion sustains acceleration up to leaving the acceleration region

where  is the velocity of the monomer ion after ending the acceleration process. The accelerated ion travels at an invariable velocity until it is stopped by the retarding grid

The ratio of  and
and  can be derived from equations (6)–(8)

The value of  ranges from 0 to
  thus
thus  is within the limits of
 ![$\left[\tfrac{{m}_{1}}{{m}_{0}+{m}_{1}},1\right].$](https://content.cld.iop.org/journals/1009-0630/23/12/125502/revision2/pstac23bdieqn48.gif) In figure 10, the segment representing fragmentation in the acceleration region is marked in green in the RPA curve.
In figure 10, the segment representing fragmentation in the acceleration region is marked in green in the RPA curve.
If no fragmentation occurs, the theoretical value of VRPA/Va is 1. The blue drop lines of the RPA curve in figures 10 and 11 denote the fraction of the ions without fragmentation.
Through the above analysis, the three segments of decline in the RPA curve imply different types of fragmentation. Since all the ion species are singly charged, the fragmentation rate at a certain applied acceleration voltage can be valued as the current fraction. From figure 9, there are no strong signs that ion fragmentation is affected by the acceleration voltage in the same polarity. The average fragmentation rates are calculated and presented in figure 12. The total fragmentation rate of the emitted particles accounts for 48.8% in positive mode and 59.8% in negative mode. Coles and Miller proposed and validated that ion clusters composed of complex ions tend to be more stable [29, 32]. The better stability of (EMI-BF4)EMI+ than (EMI-BF4) is probably due to a more complex structure of (EMI-BF4) EMI+ despite different polarities.

Figure 12. Fragmentation rates in (a) positive mode and (b) negative mode.
Download figure:
Standard image High-resolution image4.3. Energy distribution and voltage losses of the ILIS
Energy spectra of the ILIS can be derived from the derivative of the RPA curve. Figure 13 shows a series of normalized energy spectra of the ILIS at different acceleration voltages. It is found that there are two prominent peaks in each separate curve. This is due to the two sharp drop lines in the RPA curve, caused by fractions fragmented in the field-free region and fractions without fragmentation, respectively. After the calculation of the derivative, the signal intensity is therefore relatively high in the vicinity of these two positions, indicating that the plume contains two concentrated energy distributions.
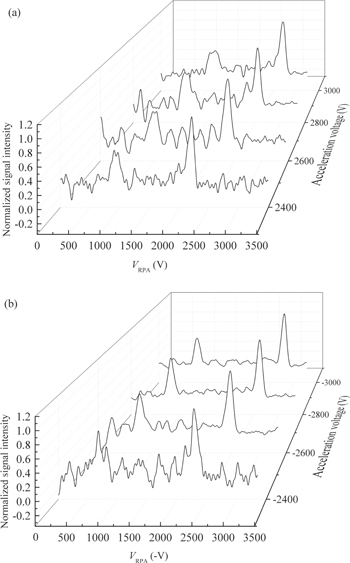
Figure 13. Energy spectra of the ILIS in (a) positive mode and (b) negative mode.
Download figure:
Standard image High-resolution imageThe voltage of the second peak, which indicates particles without fragmentation, is slightly smaller than the corresponding applied acceleration voltage. Since the unbroken particles obtained kinetic energy only by electrostatic field acceleration, the voltage loss of the ILIS can be obtained by analyzing the difference between the voltage of the second peak and the applied acceleration voltage. Further, energy efficiency, defined as the ratio of the actual acceleration voltage and the applied acceleration voltage, can also be calculated. Figure 14 illustrates voltage losses and energy efficiencies of the ILIS in positive and negative modes. Results indicate that the voltage loss is increased with the applied acceleration voltage. Correspondingly, the energy efficiency versus the applied acceleration voltage is decreased, though the decrease is relatively slight due to the simultaneous increase of the applied acceleration voltage. A similar trend was mentioned in references [30], though the material of the emitter is different. The voltage loss is probably due to the resistance of the propellant liquid or circuit.

Figure 14. Voltage losses and energy efficiencies of the ILIS in positive and negative modes.
Download figure:
Standard image High-resolution image4.4. Spatial plume profile of the ILIS
The spatial plume profiles both perpendicular and parallel to the strips of the ILIS are shown in figure 15. The collected current has been normalized to the height of the peak at an applied acceleration voltage of 3000 V or −3000 V. The main source of error is approximating the finite dimensions of the ILIS as a point source, which is estimated to be less than six degrees.

Figure 15. Spatial plume profiles: (a) perpendicular to the strips in positive mode, (b) parallel to the strips in positive mode, (c) perpendicular to the strips in negative mode, and (d) parallel to the strips in positive modes.
Download figure:
Standard image High-resolution imageIt is found that the plume cross profile is approximately symmetric in the direction of either perpendicular or parallel to the strips, and better symmetry is found at higher acceleration voltages. This phenomenon is likely caused by the uneven distribution of the emission sites at lower voltages. At lower applied voltages, some parts of the emitters can form emission sites while others cannot [33], and this is likely due to the variation among the emission strips. This variability can be attributed to differences in apex geometry (mainly radii), emitter-to-extractor distance, and material properties (such as pore size) along the emitter apex. These differences lead to different startup voltages for emission site formation at the different parts of the strips. Thus, at lower voltages, only a part of the emission sites can produce emission and the distribution of the emission sites is uneven.
Besides, another interesting finding is that the plume perpendicular to the strips shows a higher divergence in both positive and negative modes compared with the plume parallel to the strips. Specifically, taking the angle containing 95% of the overall current as the plume angle, the half plume angle perpendicular to the strips is 41.2° at +3000 V and 40.1° at −3000 V, while the plume distribution parallel to the strips is more concentrated, 19.4° at +3000 V and 19.7° at −3000 V. To get an in-depth understanding of the plume divergence difference in two cross sections, numerical simulation is carried out via the software package COMSOL Multiphysics version 5.5.
In the simulation, a 3D model is established, as shown in figure 16(a). The sizes, materials, and circumstances are set the same as the experiments to reflect the actual conditions of the experiments. The combination of the extractor and the emitter array is placed in a sphere, which is defined as the calculation zone. The extractor is grounded, while the potential of the emitter array is set to either a positive or negative acceleration voltage. Particles (monomers and dimers) are released at an initial velocity of zero along the seven strips of the upper surface on the emitter array apex. The particle release position is marked in green in figure 16(b). The sequence type of meshing is set as a physics-controlled mesh, and the element size is selected as an extra-fine level so that the mesh of the emitter apex is fine enough to reflect the real geometry, as depicted in figure 16(c).
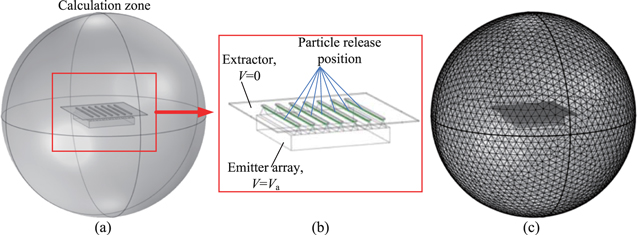
Figure 16. 3D COMSOL modelling: (a) model establishment, (b) boundary conditions and (c) meshes.
Download figure:
Standard image High-resolution imageFigure 17 shows the simulated trajectories of monomers and dimers at both Va = 3000 V and Va = −3000 V. Results further confirm that the plume divergence perpendicular to the strips is greater than parallel to the strips. From the COMSOL output file, the positions of the particles can be obtained. Taking the angle containing 95% of the total emitted particles as the plume angle, the simulated half plume angle perpendicular to the strips is 40.1° at +3000 V (an error of 2.7% with the measured value) and 39.7° at −3000 V (an error of 1.0% with the measured value), while this value parallel to the strips is 17.6° at +3000 V (an error of 9.3% with the measured value) and 18.1° at −3000 V (an error of 8.1% with the measured value). The simulated results are in good agreement with the experimental values.
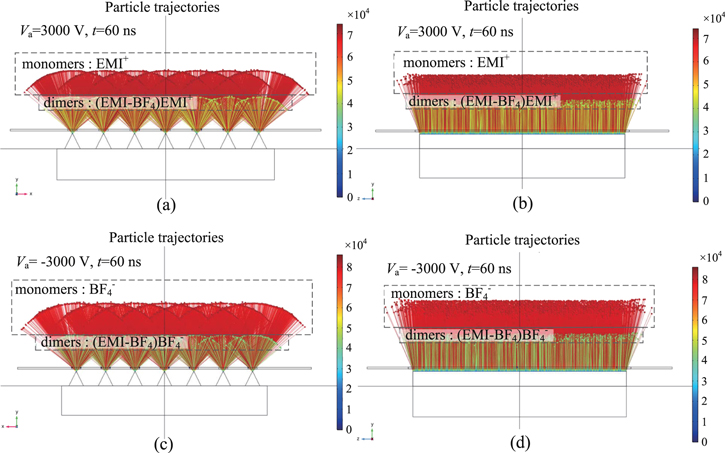
Figure 17. Simulated particle trajectories at t = 60 ns. (a) Va = 3000 V, perpendicular to the strips, (b) Va = 3000 V, parallel to the strips, (c) Va = −3000 V, perpendicular to the strips, and (d) Va = −3000 V, parallel to the strips (right rainbow bar denotes the velocity of the particles, m s−1).
Download figure:
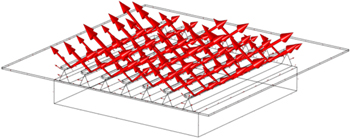
Standard image High-resolution imageThe accelerating particles are driven by the electric force provided by the electric field. Investigating the electric field distribution between two electrodes as shown in figure 18, the main electric field lines match well with particle trajectories perpendicular to the strips. Thus, it can be inferred that the spatial plume profile is influenced by the electric field distribution between the emitter and the extractor to a great extent.
Figure 18. Arrow line graph of the electric field between two electrodes (the arrow length is proportional to the magnitude of the electric field intensity).
Download figure:
Standard image High-resolution image
5. Conclusions
This paper presents a miniaturized ILIS based on an array of porous metal strips fabricated using WEDM combined with electrochemical etching. A series of experiments have been performed to gain an insight into some significant characteristics, such as the I–V characteristic, energy properties, and the spatial plume profile of the ILIS. Results show that the ILIS is capable of producing ionic beams of up to 0.8 mA. Besides, the fractions of particles fragmented in the field-free region, fragmented in the acceleration region as well as without fragmentation, have been obtained by analyzing the RPA curves. The fragmentation rate of the emitted particles accounts for 48.8% in positive mode and 59.8% in negative mode. Further, voltage losses and energy efficiencies of the ILIS have been calculated, and results reveal that with the increase in applied acceleration voltage, the voltage loss rises, and the energy efficiency decreases. As to the spatial plume distribution, it is found that the plume perpendicular to the strips has a higher divergence than that parallel to the strips. The numerical simulation reveals that the electric field distribution of the ILIS may well lead to such a spatial plume profile.
Acknowledgments
This work is supported by National Natural Science Foundation of China (No. 52075334).