


Abstract
In this paper, Maxwell equations are coupled with a radially localized global model and an analytical sheath model to investigate the electromagnetic effects under various frequencies and electron powers in large-area very high frequency symmetric capacitive argon discharges. Simulation results indicate that both the vacuum wavelength and the sheath width decrease with frequency, leading to the reduced surface wavelength. As a result, the standing wave effect becomes pronounced, causing the fact that the radial profiles of the electron density, radio frequency voltage, and sheath width shift from uniform over center-high to multiple-node. When the frequency is close to or higher than the series resonance frequency, the surface waves cannot propagate to the radial center because of the significant radial damping. Due to the lack of power deposition near the radial center, the electron density is nearly zero there, i.e. the stop band effect. As power increases, the higher electron density leads to the decrease of the skin depth. Therefore, the importance of the skin effect gradually exceeds that of the standing wave effect, giving rise to the transition from the center-high to edge-high electron density profiles. The method proposed in this work could help to predict the plasma distribution under different discharge conditions in a few minutes, which is of significant importance in optimizing the plasma processing.
Export citation and abstract BibTeX RIS
1. Introduction
Capacitively coupled plasmas (CCPs) are widely used for plasma enhanced chemical vapor deposition and dry etching in the semiconductor industry [1, 2]. In these plasma processes, large-area CCPs become popular because of the current trend of increasing wafer size. Besides, very high frequency (VHF) sources have attracted growing interest due to the higher ion flux and lower ion bombarding energy to the substrate [3–14]. However, in large-area VHF CCPs, the electromagnetic (EM) effects negatively affect the plasma radial uniformity and thus limit the plasma processing [15–19].
In the past two decades, several theoretical models, i.e. uniform slab model [15, 16, 20] and transmission line model [21–27], have been adopted to investigate the propagation of surface waves and the EM effects. Lieberman et al [15] employed a uniform slab model and solved the Maxwell equations analytically for a geometrically symmetric CCP discharge. They first addressed the standing wave effect and the skin effect, and pointed out the conditions under which these EM effects could be neglected. Sansonnens et al [16] developed a similar uniform slab model with the same sheath width surrounded for a geometrically asymmetric CCP discharge. They found that only the first even (axially symmetric) and the first odd (axially antisymmetric) modes of surface waves, which were responsible for the standing wave effect and the telegraph effect, could propagate inside the chamber. After that, Lieberman et al [20] used a uniform slab model with different sheath widths for a geometrically asymmetric CCP discharge, and they presented a series of system resonances associated with the symmetric and antisymmetric mode surface waves under various frequencies. Moreover, a transmission line model coupled with a global discharge model was developed by Chabert et al [21–24] to study the standing wave effect and the skin effect self-consistently, and they concluded that the CCP discharge was mainly sustained by the capacitive (E) field at lower radio frequency (rf) voltages and by the inductive (H) field at higher rf voltages, i.e. the E–H mode transition. To consider the influence of nonlinearly excited harmonics on the standing wave effect, Lieberman et al [25] developed a nonlinear transmission line model with uniform plasma density and a single homogeneous sheath, revealing that the series resonance-enhanced harmonics induced the standing wave effect and made the center-high profile of the electron power density more pronounced. Subsequently, more versatile nonlinear transmission line models were developed by Wen et al [26, 27] to examine the series resonance effect and the corresponding wave effects.
In addition, numerous self-consistent numerical models have also been developed to study the EM effects [17, 28–50] and the modulation of the plasma radial uniformity [28, 30, 33, 34, 40, 43–48]. Lee et al [17] combined a bulk fluid model with an analytical sheath model and the Maxwell equations, and they observed the stop band effect for the first time in the frequency range between the series resonance frequency and the electron plasma frequency, and this effect has been captured experimentally by Liu et al [19, 51] and Han et al [52] later. By a fast fluid-analytical model, Kawamura et al [28–30] presented that the higher harmonics contributed significantly to the center-high plasma profile, and this could be suppressed by adding an additional low frequency power or a dielectric layer. Recently, they proved that when the frequency was above or near an antisymmetric spatial resonance frequency, the symmetric and antisymmetric modes could coexist in a symmetric discharge, leading to the non-symmetric distribution of the plasma parameters about the midplane [31]. Rauf and Bera et al [32–37] investigated the effects of external parameters, such as the source power, inter-electrode gap, plasma electronegativity and inhomogeneous magnetic field on the VHF CCPs by a two-dimensional fluid model. Moreover, Chen et al [38, 39] developed a three-dimensional fluid model and solved the Maxwell equations by the finite difference time domain technique for a large-area rectangle chamber, focusing on the influence of segmenting powered electrode on the plasma uniformity. Xu and Zhang et al [40–44] reported the phase shift effect on the plasma distribution, and recently Zhang et al studied the plasma characteristics in discharges sustained by multiple consecutive harmonics in the VHF regime [45]. Yang et al [46–48] used the hybrid plasma equipment model to analyze the effects of different parameters on the plasma spatial profile and the ion energy distribution, and they proposed that the plasma uniformity could be improved by graded conductivity electrodes. Upadhyay and Sawada et al [49, 50] solved the fluid equations and the Maxwell equations under a high-resolution computational mesh, and their results indicated the importance of higher harmonics on the center-high plasma profile, which has also been observed in [11, 13, 14, 25–27, 29, 53, 54].
It is known that the EM effects, which originate from the propagation of surface waves, have a significant influence on the plasma spatial distribution. Vice versa, the propagation characteristics of surface waves are affected by the plasma properties, such as the plasma spatial profile, sheath width and so on [15, 16, 20]. However, in the previous research mentioned above, the surface wave propagation was usually studied with the uniform slab model, in which the plasma properties were assumed to be spatially uniform. In the fluid simulations, the emphases were mainly put on the variation of the plasma properties with different discharge parameters, as well as the modulation of the plasma uniformity. The surface wave propagation characteristics were overlooked, and the simulation regions were limited due to the computational burden.
In order to have a deeper understanding of the VHF CCP discharges, a self-consistent model, which includes the interaction between the spatially non-uniform plasma parameters and the propagation of surface waves, is necessary. In this work, a radially localized global model is coupled with an analytical sheath model and the Maxwell equations to self-consistently investigate the propagation characteristics of surface waves together with the plasma properties under various discharge parameters. Note that we assume a fixed non-uniform axial density profile, and the radial distribution of the plasma density is determined by applying the global model at different radial positions. Moreover, since the series resonance-enhanced harmonics cannot be excited in the geometrically symmetric discharges performed in this study, the Maxwell equations are solved in the frequency domain to reduce the calculation time [27]. This strategy allows us to self-consistently predict the plasma uniformity under various discharge conditions in a few minutes. Besides, the transition from the standing wave effect to the stop band effect with frequency, as well as the expansion of the stop band region, is captured. To understand the evolution of the electron density distribution with discharge parameters, which derives from different EM effects, the self-consistently predicted electric field, and thus the power deposition are presented. Besides, the surface wavenumbers, as well as the surface wavelength, radial damping length and skin depth, are calculated for a deeper understanding of the underlying mechanisms behind the EM effects.
This paper is organized as follows. The radially localized EM global model is described in section 2. In section 3, we first investigate the appearance of the standing wave effect, and then we present the transition from the standing wave effect to the stop band effect with increasing frequency. After that, the influence of the electron power on the shifting from the standing wave effect to the skin effect is discussed. Finally, conclusions are given in section 4.
2. Radially localized EM global model
The schematic diagram of a geometrically symmetric cylindrical CCP reactor is shown in figure 1. A large chamber with a radius of R = 50 cm and a gap of 2l = 5 cm is adopted due to the current trend of increasing wafer size. The half width of the bulk plasma is  with
with  the sheath width.
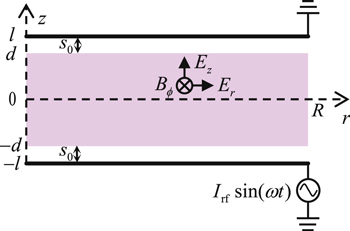
Figure 1. Schematic diagram of a geometrically symmetric cylindrical CCP reactor.
Download figure:
Standard image High-resolution image2.1. EM equations
The EM equations solved in this study have been described in detail in the previous work [55], so only a brief description is given here. Assumed a transverse magnetic mode, the Maxwell equations in the frequency domain are expressed as


Here,  is the angular component of the magnetic field,
  is the radial component of the electric field,
  is the axial component of the electric field,
  is the driving angular frequency,
  is the vacuum permittivity,
  is the vacuum permeability, and
  is the plasma relative permittivity.
In the bulk region, the relative permittivity is  where
where  is the electron-neutral momentum transfer frequency and
  is the electron plasma frequency with the element charge e, the electron mass
  and the electron density
  The electron density
  in the bulk region is assumed to be spatially non-uniform along the axial direction

which is a good approximation at low pressures [1, 55]. The radial profile of the electron density (i.e.  ) at
) at  cm is determined by the following radially localized global model.
In the sheath region, the relative permittivity varies along the radial direction  This allows the model to use a simulation-convenient fixed sheath thickness
  and meanwhile to equivalently take the propagation of surface waves in an actual radial varying sheath
  into account [17, 28]. Here,
  is determined by the position of
  where
where  is the ion velocity and
  is the Bohm velocity with the electron temperature
  and the ion mass M (equation (5.3.5) in [1]). Note that
  influences the electron density and hence the power deposition near the bulk-sheath interface, and the propagation of surface waves is affected by the actual sheath width
  which is determined by the following analytical sheath model.
From equations (1)–(3), a Helmholtz equation for  is obtained
where  is the vacuum wavenumber, with c the speed of light in vacuum. The boundary conditions for
  are as follows: (1)
  at the radial center. (2)
  at two electrodes with
  the unit normal vector. (3)
  at the radial edge, where
  is the source current. Substituting
  into equations (1) and (2), the EM fields can be determined, and the capacitive and inductive power densities in the bulk region are given by


where  is the plasma conductivity.
2.2. Radially localized global model
In the radially localized global model, the electron temperature is determined by the particle balance equation. We assume that the electrons reach the bulk-sheath interface with the Bohm velocity  and then they are lost at the electrodes

Here  is the background gas density, with the gas pressure
  the gas temperature
  and the Boltzmann constant
 is the ionization rate coefficient, as shown in table 1.
  is the axial edge to center density ratio, with the ion-neutral mean free path
  Due to the fixed axial density profile (see equation (4)), the ratio of
  to
to  in equation (8) is a constant, so
  and thus
  is independent on the radial position.
Table 1. Electron impact reaction rate coefficients in terms of the electron temperature  (section 3.5 in [1]).
| Reaction | Collision rate coefficient ( ) ) | |
|---|---|---|
| Elastic collision |

|

|
| Ionization |
|

|
| Excitation |

|

|
In the model, the plasma radial transport is ignored and the local heating is assumed, which is similar to the models in [21, 23, 24]. The electron energy balance equation, which is used to calculate the electron density, is given by

Here  is the total electron energy loss, where
  represents the electron energy loss when the electrons cross the sheath to the electrode [20].
  is the collisional electron energy loss per electron-ion pair created,
  is the average energy loss-weighted excitation rate coefficient for average excitation energy 12.14 eV [1], and
  is the elastic collision rate coefficient (see table 1).
  is the total electron power area density.
  and
and  are the capacitive and inductive power area densities in the bulk region.
  and
and  are the stochastic heating and the Ohmic heating in each sheath, and they are calculated by the analytical sheath model below.
2.3. Analytical sheath model
The analytical collisionless sheath model is used to determine the sheath width and the electron sheath heating (section 11.2 in [1]). The maximum sheath width is given by
where  is the DC sheath voltage and
  is the rf voltage across each sheath. The time averaged sheath width is given by
  Note that the minimum sheath width
  is added to the time averaged sheath width
  to avoid that
  is nearly zero at the radial positions where the sheath voltage drop
  is very small, and
  is the Debye length. Moreover, the stochastic heating and the Ohmic heating in each sheath are given by

2.4. Radially localized EM global model overview
First, the EM fields are determined by solving equations (1)–(3) with the initial  and
and  and then
 and
and  are obtained. Subsequently, the analytical sheath model is implemented, the sheath width
  is updated, and the sheath heating
  and
and  are calculated. Then, the energy balance equation (9) is solved at each radial position for
  and the axial distribution
  is determined according to equation (4). Finally, the electron temperature
  is obtained by solving the particle balance equation (8). In each iteration, the source current
  is adjusted to ensure that the calculated total electron power, which is obtained by integrating
  over the whole electrode, equals to the fixed value. The iteration continues until the energy balance is achieved at each radial position.
3. Results and discussion
3.1. Standing wave effect
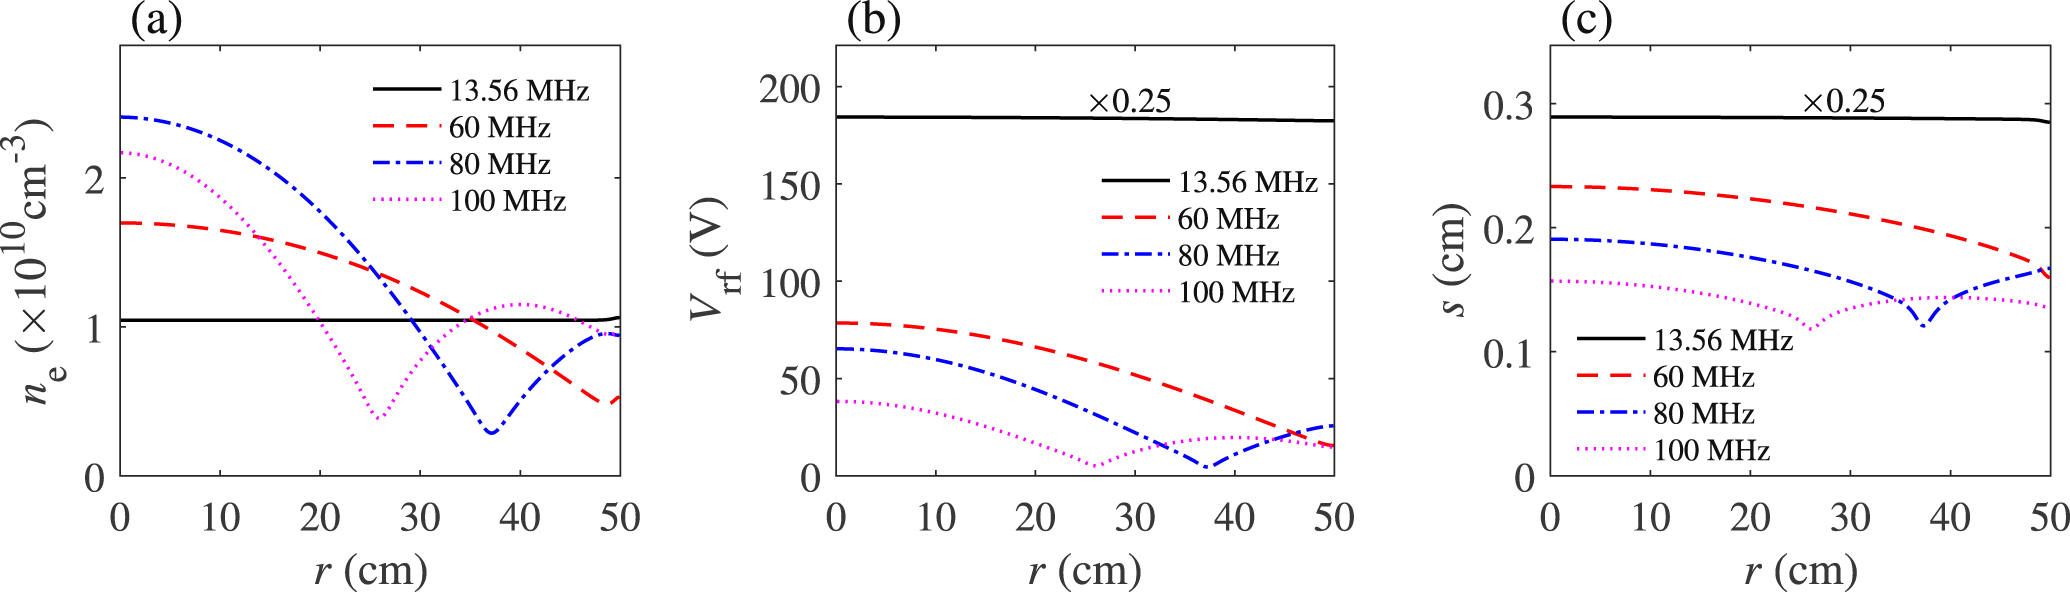
First, we study the appearance of the standing wave effect in the frequency range from 13.56 to 100 MHz, with the gas pressure of 50 mTorr and the electron power of 100 W. Figure 2(a) shows the radial profiles of the electron density (i.e.  ) at
) at  cm for various frequencies. It is clear that
  is quite uniform along the radial direction at 13.56 MHz, even near the radial edge, because the particle loss at the side wall and the plasma transport are not considered in the global model. As the frequency increases to 60 MHz,
  shows an obvious center-high profile, due to the standing wave effect. At 80 MHz,
  first decreases along the radial direction, with a density node appearing at
  and then it increases from the node to the radial edge. As the frequency increases further to 100 MHz, the density node moves inward to
  and the second density peak appears at
  indicating that the standing wave effect becomes more pronounced.
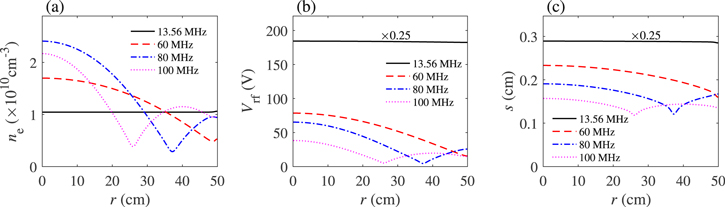
Figure 2. Radial profiles of (a) the electron density (i.e.  ) at
) at  (b) the rf voltage (i.e.
  ) between two electrodes, and (c) the sheath width
  for different frequencies: 13.56, 60, 80, and 100 MHz, at 50 mTorr and 100 W.
Download figure:
Standard image High-resolution imageTo illustrate the standing wave effect, the dispersion relations of surface waves [15, 16] are solved under various frequencies by using the spatially averaged electron density  and the radially averaged sheath width
  [29–31] (see appendix A). Since the total electron power is fixed as we mentioned above,
  stays unchanged at four frequencies. At 13.56 MHz, the obtained radial wavenumber is
  with
with  Note that
  is much smaller than the first zero of the zero-order Bessel function
  indicating that the surface wavelength (i.e.
  ) is much longer than the chamber radius R. This gives rise to the uniform rf voltage between two electrodes
  and the uniform sheath width
  (figures 2(b) and (c)), and consequently the uniform sheath heating (i.e.
  in figure 3(b)). As the frequency increases,
  and
and  show overall downward trend and significant radial non-uniformity, which is consistent with the radial profiles of
  and this will be discussed below.
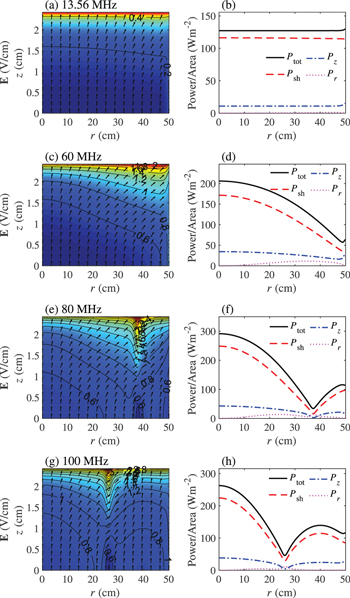
Figure 3. Spatial profiles of the electric field  in the bulk plasma (first column), as well as the radial profiles of the capacitive power area density in the bulk
  the inductive power area density in the bulk
  the power area density in sheaths
  and the total power area density
  (second column) for different frequencies: 13.56 MHz (a) and (b), 60 MHz (c) and (d), 80 MHz (e) and (f), and 100 MHz (g) and (h), at 50 mTorr and 100 W.
Download figure:
Standard image High-resolution imageThe spatial profiles of the electric field  in the bulk region, as well as the radial distributions of the power area density, are presented in figure 3. The contour lines and the arrows in the first column indicate the amplitude and direction of
  respectively. To reveal the electric field in the bulk region more clearly, we have excluded the sheath regions in all the figures of
  In the second column of figure 3, the power area density in sheaths
  is calculated by
  Note that although the discharge gap is larger than the electron mean free path at 50 mTorr and 100 W, the stochastic heating plays an important role under this condition [21, 56–60]. For instance, when the frequency increases from 13.56 to 180 MHz, the stochastic heating increases from 57 to 84 W, while the Ohmic heating decreases from 43 to 16 W. In figure 3(a),
  is also radially uniform, because of the very long surface wavelength and the radially uniform electron density, as we mentioned above, and this results in the similar distribution of
  (figure 3(b)). In the axial direction,
  shows a significant decrease from the bulk-sheath interface to
  which is caused by the higher electron density and thus the higher
  at the axial center. Besides,
  and the corresponding
  are very weak under this condition, because of the negligible skin effect at the relatively low electron density. As a result,
  is mainly determined by
  and
and  and the radially uniform
  leads to the similar distribution of
  in figure 2(a). Note that
  represents the capacitive power in the sheaths, indicating that the capacitive power rather than the inductive power dominates the discharge when the electron power is relatively low, i.e. 100 W.
As the frequency increases to 60 MHz, the radial wavenumber is  with
with  Note that
  is close to
  indicating that the surface wavelength (i.e.
  ) is comparable to the chamber size, and the standing wave effect becomes significant. As a result,
  and
and  are characterized by obvious center-high profiles in figures 2(b) and (c). However,
  in the bulk region is slightly higher at the radial edge, especially near the bulk-sheath interface (figure 3(c)). This is because although
  shows a radial decrease under this condition,
  in the bulk region is stronger at the radial edge due to the lower electron density and
  there (see equation (B5) in appendix B). Moreover, the radial increase of
  also becomes more pronounced at 60 MHz than at 13.56 MHz due to the decrease of the surface wavelength, which is consistent with the analytical solution based on the uniform slab model [15, 16]. Under the combined influence of
  and
and  the maximum of
  appears at the radial edge of the bulk-sheath interface. In addition,
  exhibits a parabolic profile along the radial direction, which is similar to
  (see equation (B6) in appendix B), except for the peak due to the strong
  at the radial edge, as shown in figure 3(d). Besides,
  shows a center-high profile, which is caused by the similar distribution of
  and
and  (see equations (11) and (12)). Although
  becomes more significant than that at 13.56 MHz due to the stronger
 is still negligible compared with
  and
and  because of the relatively low electron density. As a result, the maximum of
  appears at the center, leading to the center-high profile of
  in figure 2(a). At 80 MHz, the radial wavenumber is
  with
with  and the first node of surface wave appears at
  which is slightly different from the first node of
 and
and  in figure 2 (i.e.
  ). This is because the dispersion relation is obtained by using the spatially averaged plasma parameters, which is similar to the approach in [29–31]. Indeed, the electron density shows significant non-uniformity, which is clear from figure 2(a), so the predicted radial wavenumber by using the spatially averaged plasma parameters deviates slightly from the actual value. However, the evolution of radial wavenumbers and thus the surface wavelength with frequency agrees quite well with simulation results, and this can be used to qualitatively explain the EM effects under various discharge conditions. In figure 3(e),
  exhibits a peak near the node position of the bulk-sheath interface, which is again due to the combined effect of
  and
and  as mentioned above. When the frequency increases further to 100 MHz, the radial wavenumber is
  with
with  and the first node of surface wave takes place at
  Therefore, the first node of
 and
and  moves inward and the second peak appears in the chamber (figure 2).
3.2. Stop band effect
In this subsection, we focus on the transition from the standing wave effect to the stop band effect in the frequency range from 120 to 180 MHz at 50 mTorr and 100 W. In figure 4(a),  shows a multiple-node profile at 120 MHz, i.e.
  has two nodes at
  and
and  respectively. The multiple-node density profile is again due to the significant standing wave effect, which has also been captured by experiments [19, 51, 52] and simulations [17, 38]. As the frequency increases to 140 MHz, the stop band effect takes over the standing wave effect and dominates the radial profile of the electron density, which is similar to that obtained in [17, 19, 51, 52]. As a result,
  is nearly zero in the region of
  and it shows a radial increase towards the radial edge. As the frequency increases further to 160 MHz and 180 MHz, the stop band effect becomes more significant and the stop band region, where
  is nearly zero, expands to
  and
and  respectively. Note that the electron density distributions obtained in this work are different from [61, 62], because of the low electron density, i.e. in the order of
  This value is calculated self-consistently by the EM global model under the electron power of 100 W. If a higher electron power is applied, the electron density increases, and thus the series resonance frequency may be several times higher than the driving frequency, as will be discussed below. Therefore, the stop band effect does not take place, and the discharge is dominated by the standing wave effect at VHF [61]. Moreover, both the electron mean free path for argon under such discharge condition (i.e. about 0.6 cm) and the discharge gap (i.e. 5 cm) are much smaller than the chamber radius (i.e. 50 cm), so the plasma radial transport, which tends to decrease the stop band region, should be insignificant in these cases. In figures 4(b) and (c),
  and
and  show similar radial profiles to
  at four frequencies. For instance,
  drops to the minimum value in the region where
  and
and  are nearly zero.
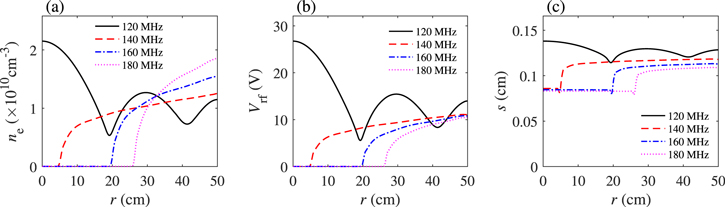
Figure 4. Radial profiles of (a) the electron density (i.e.  ) at
) at  (b) the rf voltage (i.e.
  ) between two electrodes, and (c) the sheath width
  for different frequencies: 120, 140, 160, and 180 MHz, at 50 mTorr and 100 W.
Download figure:
Standard image High-resolution imageThe stop band effect derives from the radial damping of surface waves when they propagate from the radial edge to the center, which can be described by the radial damping length  (see appendix A). At 120 MHz, the radial wavenumber is
  with
with  The radial damping length is
  which is almost twice the chamber radius R, indicating that there is no significant radial damping. Since
  is larger than the second zero of the zero-order Bessel function

 and
and  exhibit two nodes at 120 MHz (figure 4), and so is the power area density, i.e.
 and
and  (figure 5(b)). Besides, it is clear that
  exhibits two peaks near the node positions at the bulk-sheath interface (figure 5(a)), as we discussed above. At 140 MHz, the radial wavenumber is
  with
with  Since the radial damping length
  becomes smaller than R, the surface waves have significant damping. As a result,
 and
and  decrease rapidly from the radial edge to the center (figure 4), and
  and
and  are nearly zero in the region of
  As the frequency increases to 160 MHz and 180 MHz, the radial wavenumbers are
  with
with  and
and  with
with  and the radial damping lengths decrease strikingly to
  at 160 MHz and
  at 180 MHz, respectively. Due to the enhanced radial damping, the stop band region expands, as shown in figures 4(b), 5(e) and (g).

Figure 5. Spatial profiles of the electric field  in the bulk plasma (first column), as well as the radial profiles of the capacitive power area density in the bulk
  the inductive power area density in the bulk
  the power area density in sheaths
  and the total power area density
  (second column) for different frequencies: 120 MHz (a) and (b), 140 MHz (c) and (d), 160 MHz (e) and (f), and 180 MHz (g) and (h), at 50 mTorr and 100 W.
Download figure:
Standard image High-resolution imageFigure 6 shows the variation of wavenumber with frequency in the frequency range of 0–300 MHz at the electron density of  the sheath width of 0.11 cm, and the electron temperature of 2.1 eV. Note that the spatially averaged electron density and the electron temperature are almost unchanged in this frequency range. Besides, the above sheath width is obtained by averaging
  at 120, 140, 160, and 180 MHz (figure 4(c)), and the averaged value only differs from
  at each frequency by no more than 20%. Therefore, the dispersion relation curves in figure 6 can qualitatively describe the propagation characteristics of surface waves in this frequency range. As we can see, when the frequency is much lower than the series resonance frequency
  i.e. in the frequency range
 increases almost linearly, and
  is much smaller than 1, which is consistent with the approximate expression of the radial wavenumber at low density and low frequency
  [15]. As a result, the surface wave could propagate from the radial edge to the center almost without damping. When the frequency is close to
 increases rapidly with frequency. Therefore, the radial damping becomes significant when the frequency is higher than 140 MHz, and this leads to the pronounced stop band effect.
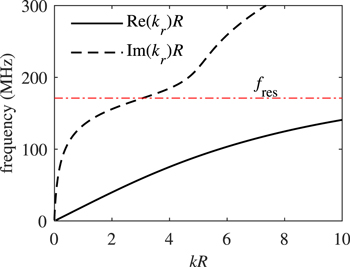
Figure 6. Dispersion relations of surface waves obtained at the electron density of  the sheath width of 0.11 cm, and the electron temperature of 2.1 eV.
Download figure:
Standard image High-resolution image3.3. Skin effect
The skin effect has been studied in a wide frequency range, i.e. 40.7–180 MHz, in previous literatures [15, 17, 18, 32, 41, 51]. In this subsection, 80 MHz is adopted to study the transition from the standing wave effect to the skin effect as the electron power increases from 100 to 800 W at 50 mTorr. In figure 7(a), it is obvious that the electron density increases significantly with electron power. For instance, the spatially averaged electron density increases from  at 100 W to
  at 800 W. Moreover,
  has a density node at
  and shows significant non-uniformity at 100 W, as we discussed above. At 200 W, the radial position of the density node almost keeps unchanged, but the decreasing trend near the radial center becomes less obvious. As the electron power increases to 400 W, the skin effect becomes significant due to the high electron density. Under the combined influence of the standing wave effect and the skin effect,
  near the radial center becomes uniform, and the density node becomes less obvious. When the electron power increases further to 800 W, the skin effect dominates the discharge, and
  exhibits an edge-high profile, as shown in figure 7(a). In figures 7(b) and (c),
  and
and  show significant non-uniformity, and the node positions of
  and
and  are almost unchanged at different electron powers, because
  only varies slightly from 3.56 at 100 W to 3.70 at 800 W.

Figure 7. Radial profiles of (a) the electron density (i.e.  ) at
) at  (b) the rf voltage (i.e.
  ) between two electrodes, and (c) the sheath width
  for different electron powers: 100, 200, 400, and 800 W, at 50 mTorr and 80 MHz.
Download figure:
Standard image High-resolution imageThe skin effect results from the shielding of surface waves by plasma at high electron density, and its importance could be evaluated by the skin depth  (see appendix A). At 100 W, the axial wavenumber in the bulk
  is obtained with
  and
and  Since the skin depth
  is larger than the half width of the bulk region, the skin effect is negligible under this condition. Therefore, the standing wave effect has a dominant influence, and leads to the radial non-uniformity of
 and
and  in figure 7, as we discussed above. At 200 W, the electron density increases to
  and
and  has a slight decrease. The axial wavenumber is
  and the skin depth decreases to
  Correspondingly,
  contributes more to
  (figure 8(a)) than that at 100 W (figure 3(e)), especially near the bulk-sheath interface and near the node position. Therefore,
  in figure 8(b) has a slight increase, and the radial decrease of
  near the radial center becomes less obvious than that shown in figure 3(f), which leads to the similar variation of
  in figure 7(a). However, since the skin depth is still larger than the half width of the bulk region, the standing wave effect dominates the discharge under this condition.
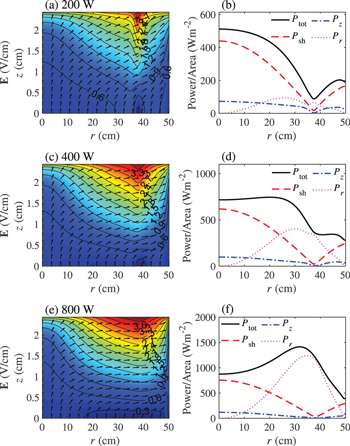
Figure 8. Spatial profiles of the electric field  in the bulk plasma (first column), as well as the radial profiles of the capacitive power area density in the bulk
  the inductive power area density in the bulk
  the power area density in sheaths
  and the total power area density
  (second column) for different electron powers: 200 W (a) and (b), 400 W (c) and (d), and 800 W (e) and (f), at 50 mTorr and 80 MHz.
Download figure:
Standard image High-resolution imageAs the electron power increases to 400 W, the electron density increases to  and the sheath width has a further decrease, i.e.
  Under this condition,
  and the skin depth decreases to
  which is close to the half width of the bulk region, indicating that the skin effect becomes significant. As a result,
  is the main component of
  in a large region near the bulk-sheath interface and near the node position, which is clear from the horizontal arrows in figure 8(c). Consequently,
  shows a significant increase and leads to the flat distribution of
  and
and  near the radial center (figures 7(a) and 8(d)). At 800 W,
  is obtained with
  and
and  and the skin depth
  becomes smaller than the half width of the bulk region. Therefore,
  is responsible for the distribution of
  in the most region, as shown in figure 8(e). Moreover, the maximum value of
  at 34.7 cm becomes larger than the sum of
  and
and  at the center (figure 8(f)), leading to the edge-high profile of
3.4. Comparison with experiments
To validate our model, the simulation results have been compared with experimental measurements. The cylindrical CCP reactor in the experiment has an inner diameter of 40 cm, containing two stainless steel parallel disk electrodes, 30 cm in diameter and separated by 4 cm. A highly purified (99.999%) argon gas is evenly injected into the discharge region through the showerhead-like top electrode. A signal generated by a function generator (Tektronix AFG31252) is amplified by a broadband power amplifier (AR, Model 1000A225) and then delivered through a Π-type matching network to the bottom electrode. The voltage waveform on the powered (bottom) electrode is measured by a high-frequency, high-voltage probe (Tektronix P5100A, 500 MHz bandwidth) and acquired via a digital oscilloscope (Tektronix MSO56).
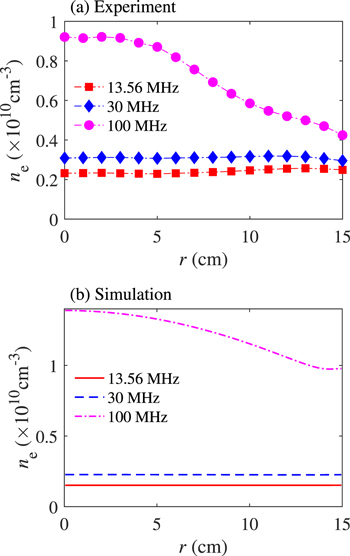
Figure 9 shows the measured and calculated electron density under 13.56, 30 and 100 MHz, with pressure of 3 Pa. In experiments, the source power is fixed at 40 W, and the measured rf voltages are 150, 50 and 30 V for the three frequencies, and these values are input into simulations as the voltages at the radial center. It is clear from figure 9(a) that the measured electron density is quite uniform at 13.56 and 30 MHz, except for a slightly higher value at the radial edge. At 100 MHz, the electron density exhibits a center-high profile, due to the standing wave effect. The evolution of the electron density with frequency in the simulation (figure 9(b)) agrees well with the experimental measures, but there exists a small discrepancy in the absolute value, which may be caused by the simplified chamber geometry and chemistry set in the model. Besides, the radial decrease of the electron density at 100 MHz in experiments is more obvious than in simulations. This may be caused by the existence of the nonlinearly excited harmonics due to the geometrically asymmetry in experiments, which enhances the electron power near the center [25, 27, 50].
Figure 9. (a) Measured and (b) calculated electron density for argon discharges under different frequencies of 13.56, 30 and 100 MHz, with pressure of 3 Pa.
Download figure:
Standard image High-resolution image
4. Conclusions
In this work, Maxwell equations are coupled with a radially localized global model and an analytical sheath model to study the EM effects and the underlying mechanisms for argon discharges in a geometrically symmetric cylindrical CCP reactor. The electron density is assumed to have a fixed non-uniform axial distribution, and the radial profile is determined by applying the radially localized global model, which allows us to improve the simulation efficiency and meanwhile take the non-uniform density profile into account.
First, we investigated the standing wave effect in the frequency range from 13.56 to 100 MHz at 100 W and 50 mTorr. At low frequencies, both the vacuum wavelength and the sheath width are very large, leading to the fact that the surface wavelength is much larger than the chamber radius. Therefore, no significant standing wave effect is observed, and the electron density, the rf voltage, and the sheath width are radially uniform. As the frequency increases, both the vacuum wavelength and the sheath width show a remarkable decrease, and so is the surface wavelength, which becomes comparable to or even smaller than the chamber radius. As a result, the standing wave effect becomes pronounced and gives rise to the center-high or even multiple-node profiles.
Besides, the stop band effect has been illustrated in the frequency range from 120 to 180 MHz at 100 W and 50 mTorr. Under the conditions we studied, the frequency only has a slight influence on the spatially averaged electron density and the sheath width, so the series resonance frequency almost keeps constant in this frequency range. When the frequency is close to or higher than the series resonance frequency, a significant radial damping of surface waves takes place, resulting in that they cannot propagate to the radial center. Therefore, the stop band effect dominates the discharge and results in a region near the radial center where the electron density is almost zero.
Finally, the skin effect has been demonstrated in the electron power range from 100 to 800 W at 80 MHz and 50 mTorr. At low electron powers, the electron density is relatively low, and the skin depth is much larger than the half width of the bulk plasma, so the skin effect is not obvious. As the electron power increases, the increased electron density leads to the reduced skin depth. Thus, the skin effect becomes pronounced, and the inductive power area density at the radial edge has a remarkable increase. Under the combined influence of the skin effect and the standing wave effect, the density profile becomes radially uniform at 400 W. As the power increases further, the skin effect dominates the discharge and gives rise to the edge-high profile of the electron density.
Acknowledgments
This work was supported by National Natural Science Foundation of China (NSFC) (Nos. 11935005, 11875101, 12020101005, 12005035), the Natural Science Foundation of Liaoning Province (No. 2020-MS-114), the China Postdoctoral Science Foundation (No. 2020M670741), and the Fundamental Research Funds for the Central Universities (No. DUT20LAB201). The author Jiankai Liu also appreciates the financial support from the China Scholarship Council.
Appendix A.
The dispersion relations given by the uniform slab model are solved with the spatially averaged plasma parameters to understand the propagation characteristics of surface waves in detail. Since the higher symmetric modes rapidly damp out near the radial edge, and the antisymmetric modes do not exist in this work, only the dispersion relations for the first symmetric mode of surface waves are solved [15, 16, 31]


where 
 and
and  are the radial wavenumber, the axial wavenumber in the bulk and the axial wavenumber in the sheath, respectively.
  is the radially averaged half width of the bulk plasma.
The above equations are calculated using the Matlab solver fsolve, and some important parameters, which describe the propagation of surface waves, are determined. For instance,  could help to explain the radial variation of the fields caused by the finite wavelengths. The radial damping length
  describes the radial decay of the fields from the radial edge to the center. The skin depth
  illustrates the axial decay of the fields when they penetrate into the bulk plasma.
Appendix B.
To demonstrate the radial profiles of  and
and  at the bulk-sheath interface, two positions within the sheath region
  and
and  and two positions within the bulk region
  and
and  are adopted.
At the bulk-sheath interface, the axial electrical displacement is continuous
Using the expression for  in the bulk and in the sheath regions, we have
and the ratio of  at
at  and
and  is given by
Because  in the sheath region almost keeps constant along the axial direction, we find

Substituting the expressions for 
 and
and  into equation (B3), we obtain
Using equations (6) with (B5) and the expression for  the ratio of
  at
at  and
and  is achieved

It is clear from equation (B6) that  is proportional to