

Abstract
Radiomics-based prediction models have shown promise in predicting Radiation Pneumonitis (RP), a common adverse outcome of chest irradiation. Τhis study looks into more than just RP: it also investigates a bigger shift in the way radiomics-based models work. By integrating multi-modal radiomic data, which includes a wide range of variables collected from medical images including cutting-edge PET/CT imaging, we have developed predictive models that capture the intricate nature of illness progression. Radiomic features were extracted using PyRadiomics, encompassing intensity, texture, and shape measures. The high-dimensional dataset formed the basis for our predictive models, primarily Gradient Boosting Machines (GBM)—XGBoost, LightGBM, and CatBoost. Performance evaluation metrics, including Multi-Modal AUC-ROC, Sensitivity, Specificity, and F1-Score, underscore the superiority of the Deep Neural Network (DNN) model. The DNN achieved a remarkable Multi-Modal AUC-ROC of 0.90, indicating superior discriminatory power. Sensitivity and specificity values of 0.85 and 0.91, respectively, highlight its effectiveness in detecting positive occurrences while accurately identifying negatives. External validation datasets, comprising retrospective patient data and a heterogeneous patient population, validate the robustness and generalizability of our models. The focus of our study is the application of sophisticated model interpretability methods, namely SHAP (SHapley Additive exPlanations) and LIME (Local Interpretable Model-Agnostic Explanations), to improve the clarity and understanding of predictions. These methods allow clinicians to visualize the effects of features and provide localized explanations for every prediction, enhancing the comprehensibility of the model. This strengthens trust and collaboration between computational technologies and medical competence. The integration of data-driven analytics and medical domain expertise represents a significant shift in the profession, advancing us from analyzing pixel-level information to gaining valuable prognostic insights.
Export citation and abstract BibTeX RIS

Original content from this work may be used under the terms of the Creative Commons Attribution 4.0 licence. Any further distribution of this work must maintain attribution to the author(s) and the title of the work, journal citation and DOI.
1. Introduction
Chest radiotherapy is important for treating thoracic malignancies. It can help control cancer, but it also carries risks, such as radiation pneumonitis [1]. Radiation pneumonitis is a condition characterized by lung tissue inflammation that can have a significant negative impact on patients' quality of life. It can cause symptoms such as cough, shortness of breath, and chest pain, and in severe cases, it can lead to long-term lung damage. To prevent worsening and optimize patient outcomes, it is crucial to predict and manage radiation pneumonitis due to its potential risks. As radiotherapy treatments become more precise and effective, it is increasingly important to predict and manage radiation pneumonitis. Radiomics, a field that combines medical imaging and data science, has gained interest because it can uncover detailed disease patterns in medical images [2]. However, the lack of transparency associated with complex algorithms can hinder their effective application in clinical settings. Transparent and interpretable models are essential for establishing confidence and fostering collaboration among medical practitioners.
This study aims to bridge the gap between predictive accuracy and clinical understanding in radiation pneumonitis prediction by incorporating SHAP (SHapley Additive Explanations) and LIME (Local Interpretable Model-Agnostic Explanations) methodologies for model interpretability [3–5]. This research signifies a groundbreaking endeavor in the realm of radiation pneumonitis prediction, characterized by its novel incorporation of SHAP and LIME techniques. By using SHAP values, the study examines how radiomic features affect prediction outcomes, providing insights into the importance of these features in understanding and predicting radiation pneumonitis. Additionally, the use of LIME methodology provides clear and comprehensible explanations for each prediction, aiding doctors in understanding and endorsing the model's findings. These approaches effectively bridge the gap between predictive accuracy and clinical understanding, improving the transparency and interpretability of complex algorithms. The unique approaches employed in this research have the potential to not only improve predictions for radiation pneumonitis but also contribute to the prognosis and treatment approaches for various clinical diseases. By generating valuable insights and enhancing the understanding of disease patterns, this research has the potential to improve patient care and treatment outcomes [4].
Existing studies in the field [6–9] have laid the groundwork for understanding the potential benefits of utilizing medical imaging and data science. However, these studies often lack interpretability, making it difficult for medical practitioners to effectively integrate the findings into clinical practice. Without clear explanations and understanding of how the models work, doctors may be hesitant to trust and endorse the predictions. Additionally, some studies focus on single-modal data, neglecting the potential benefits of incorporating multi-modal information [10–12]. By only considering one type of imaging data, these studies may miss out on crucial connections and features that are necessary for accurate predictions. Moreover, existing research indicates that several clinical factors, including smoking status, pre-existing lung disease, pre-existing heart disease, and chemotherapy, can influence an individual's susceptibility to developing RP [13–16]. While these indicators may suggest vulnerability, RP still displays significant variation between individuals. The standard clinical criteria do not adequately describe this heterogeneity.
The research presented in this study aims to address these limitations by proposing innovative methods for model interpretation and incorporating multi-modal data, expanding the range of features and improving the accuracy of predictions.
Including multi-modal data expands the range of features [17], allowing our predictive models to capture important connections. This research is pioneering in the field of predicting radiation pneumonitis, using creative SHAP and LIME methodologies. These methods not only reveal the intricate significance of radiomic features but also provide clear and comprehensible explanations for individual predictions. Our work's distinctive approaches have the potential to generate valuable insights applicable not only to radiation pneumonitis but also to the prognosis of various clinical illnesses.
2. Materials and methods
2.1. Data collection and preprocessing
We obtained a dataset of radiographic images from a medical center that collaborated with our laboratory, which included a diverse range of CT scans and radiographs of patients undergoing chest radiotherapy for various thoracic malignancies. (Laboratory: Medical Physics and Informatics Department (MPID), The Medical Physics and Informatics Department (MPID) at University Hospital, Larissa, Greece, is involved in clinical practice, research, and education. MPID offers clinical and research services related to quality assurance programs, acceptance tests, and radiation protection issues). The use of multiple modalities allowed us to capture different aspects of lung tissue responses to radiation. These included a heterogeneous patient population with varying risk profiles for radiation pneumonitis. The datasets consisted of radiographic images from a total of 122 patients who underwent chest radiotherapy for various thoracic malignancies. Both male and female patients ranged in age from 35 to 70 years, with a mean age of 57 years. A cutting-edge imaging technique known as PET/CT, renowned for its exceptional accuracy, facilitated the acquisition of these images. We carefully adjusted the parameters to ensure both uniformity and superior image quality. These parameters are crucial for extracting dependable radiomic features for predictive modeling. The PET/CT imaging modality combines metabolic and anatomical data, providing detailed information about the structure and function of the lungs with high precision. This imaging technique provides detailed information about the structure and function of the lungs. We crafted the process to adhere to established clinical standards and guarantee the quality of the collected data. The selection of imaging parameters was carefully considered to optimize the experimental setup for data consistency and reliability. A tube voltage of 120 kilovolts (kV) was chosen to ensure adequate penetration of x-rays and achieve good image quality. A tube current of 200 mA was selected to balance image quality with patient safety, minimizing the radiation dose while still obtaining sufficient signal strength. The exposure duration of 10 seconds was determined to be an optimal compromise between capturing enough data and minimizing motion artifacts, which could affect the accuracy of the radiomic features extracted from the images. Lastly, a slice thickness of 3 millimeters was chosen to strike a balance between image resolution and the amount of radiation exposure. By systematically selecting these parameters, we aimed to obtain high-quality PET and CT images that would enable accurate extraction of radiomic characteristics and improve the predictive accuracy of radiation pneumonitis [18].
2.2. Radiomics feature extraction
PyRadiomics, a Python package specifically designed for analyzing radiographic images, obtained the radiomic characteristics from the radiographic pictures. It provides a wide range of feature extraction techniques, including measures of intensity, texture, and shape. We calculated these features from lung regions of interest within the radiography images [19]. These features are calculated from lung regions of interest within the radiography images, allowing for the extraction of many features, including first-order statistics as well as higher-order texture and shape-based characteristics (using the Gray-Level Co-Occurrence Matrix, Gray-Level Run-Length Matrix, and Gray-Level Size Zone Matrix). The task encompassed the partitioning of lung regions of interest within the radiography images to separate pertinent tissue attributes. We calculated a wide range of radiomic features, including intensity-based features, textural features, and morphological features, from the divided regions. By utilizing PyRadiomics, we have established uniformity in the extraction of features throughout our dataset and mitigated possible biases that may arise from manual feature calculation. The extracted radiomic features served as the fundamental components of our high-dimensional dataset, and are crucial for analyzing and understanding the medical images.
2.3. Algorithm optimization
Gradient Boosting Machines (GBM): The selection of Gradient Boosting Machines as the major modeling technique was based on their capacity to handle high-dimensional data and capture non-linear correlations accurately. We also selected three separate forms of the GBM for their specific characteristics and abilities to effectively manage intricate datasets and categorical radiomic features [20].
XGBoost is renowned for its computational efficiency and durability, making it well-suited for effectively managing intricate datasets that contain a substantial number of features [21].
- Maximum Depth (max_depth): 5
- Learning Rate (learning_rate): 0.1
- Number of Estimators (n_estimators): 100
- Subsample (subsample): 0.8
- Minimum Child Weight (min_child_weight): 1
- Gamma (gamma): 0
- LightGBM, a machine learning algorithm, prioritizes speed and memory efficiency. This allows for the processing of extensive radiomic datasets while maintaining high predicted accuracy [22]:
- Maximum Depth (max_depth): 8
- Learning Rate (learning_rate): 0.05
- Number of Estimators (n_estimators): 200
- Subsample (subsample): 0.7
- Minimum Data in Leaf (min_data_in_leaf): 20
- Feature Fraction (feature_fraction): 0.8
CatBoost: The presence of categorical radiomic features necessitates the utilization of CatBoost, which possesses the intrinsic ability to effectively manage such variables [23].
- Maximum Depth (max_depth): 6
- Learning Rate (learning_rate): 0.1
- Number of Estimators (n_estimators): 150
- Subsample (subsample): 0.9
- Minimum Child Weight (min_child_weight): 1
- L2 Regularization (reg_lambda): 3
The selection of these hyperparameter configurations was determined by empirical experimentation and meticulous refinement, employing methodologies such as Bayesian optimization [24]. Bayesian optimization is used to determine the hyperparameter configurations by maintaining a probabilistic surrogate model of the objective function, which represents the performance metric (in our case, Multi-Modal AUC-ROC). It helps to focus the exploration on areas of the parameter space that are more likely to yield superior predictive performance. This approach ensures that the models are optimized for accurate predictions without overfitting the data. In the context of high-dimensional and complex parameter spaces, such as those encountered in machine learning models, Bayesian optimization allows for a more efficient allocation of computational resources towards configurations that have a higher probability of achieving better performance.
Ensemble techniques involve combining the predictions of many models to improve overall performance. They combine different models, like decision trees or neural networks, to take advantage of their strengths and reduce their weaknesses. This leads to more accurate and reliable predictions. The collaborative technique enhances prediction accuracy and contributes to the development of a complete and resilient predictive model. We also add quantitative features of radiomics to enhance the understandability and clinical relevance of the results. This integration leads to the development of a complete and resilient predictive model [25].
2.4. SHAP
The SHAP technique helps us understand models better by measuring how each feature affects the predictions. It achieves this by accurately measuring the impact of each unique feature on the predictions made by the model. The calculation of SHAP values is based on the ideas of game theory. Measuring how much each feature contributes to the difference between the model's output for a given case and the expected output, usually shown by the average prediction, makes these numbers more important. The aforementioned numbers provide insight into how each variable impacts the prediction compared to a baseline prediction, such as the average prediction across the dataset [26].
SHAP (SHapley Additive exPlanations) values provide a quantitative measure of the contribution of each feature in a Deep Neural Networks (DNNs) model. The SHAP value for feature 'i' is computed as the average of the difference in model output with and without the feature, considering all possible feature combinations. The formula for SHAP value is given by:

where 'N' is the number of instances, x(k) is the input instance, x_(−i)^[k] is the same instance with feature 'i' removed, and 'f' is the model prediction function.
The presented graphs exhibit ranks of feature relevance, elucidating the radiomic features that exert the greatest influence on overall forecasts. Summary plots help identify influential elements that affect the model's decision-making process. The SHAP instance explanations provide a detailed analysis of how each radiomic feature affects a specific prediction. These explanations provide doctors with insights into the rationale behind a certain prediction, elucidating the influence of specific variables on the outcomes produced by the model. Positive SHAP values mean that the attribute has a positive impact on the prediction, while negative values mean it has a negative impact. We constructed SHAP summary charts to illustrate the overall influence of characteristics on model predictions. This allows us to quantify the significance of individual variables, improving transparency and providing a systematic approach to validate and explain predictions [27].
2.5. LIME
Researchers extensively utilize the LIME method in the field to enhance the interpretability of models. It achieves this by offering explanations that are specific to predictions. LIME uses a simpler model, like a linear regression model, to estimate how the main model makes decisions for a specific instance. The surrogate model has been trained using a subset of interpretable characteristics that have been obtained from the original radiomics dataset [28]. Considering the numerous imaging modalities included in our radiography data, we have developed an innovative method for LIME that effectively incorporates information from several modalities. Then, we changed LIME's perturbation method to include this larger set of features. This showed how features from different modes affect prediction results. For radiation pneumonitis, it is very important to know a lot of specifics. The LIME surrogate model carefully displays the radiomic features that link the affected tissues to the development of pneumonitis. The overlay visualizations and heatmaps in LIME effectively highlight how specific features from separate modalities influence the decision-making process of the model. A visual approach helps to show the complicated connections between different imaging data and how they affect the prediction of radiation pneumonitis. Our application of LIME goes beyond analyzing individual incidences of radiation pneumonitis by considering its temporal progression and spatial distribution. By changing features in a space-time manner, it is possible to see how the risk of radiation pneumonitis changes over time, in different parts of the body. The improved understandability of the data assists medical professionals grasp how pneumonitis develops over time. The model-agnostic aspect of LIME allows for smooth integration with our ensemble models and deep learning architectures, which is in line with the multi-modal framework of our study.
2.6. Dataset partitioning
We divided our diverse radiomics dataset into subsets to thoroughly evaluate models and verify their prediction capabilities. This is crucial for our research approach because it allows us to account for the challenges posed by multi-modal data when predicting radiation pneumonitis. We carefully divided the dataset into three sets: 70% for training, 15% for validation, and 15% for testing. This allocation of resources balances the tasks of training, fine-tuning, and unbiased evaluation. By following the standard practice of giving enough examples to each set, we ensure strong model generalization and accurate performance evaluation. To make our findings more reliable, we used a 5-fold stratified cross-validation methodology, dividing the dataset into five subsets. This rigorous cross-validation methodology reduces the risk of overfitting and provides a comprehensive evaluation of model performance across different data segments [29]. Our dataset segmentation methodology demonstrates our commitment to thoroughly and systematically evaluating predictive models for multi-modal radiation pneumonitis. Strategically aligning with the modal complexities inherent in our data, this partitioning method establishes a solid foundation for the full evaluation of models. Consequently, it facilitates the bridging of the gap between the analysis of individual pixels and the accurate prediction of outcomes, enhancing precision and instilling confidence in our findings.
2.7. Evaluation metrics
Evaluating the performance of our predictive models is crucial to our research. It shows how well we incorporated multi-modal radiomics data to improve the accuracy of predicting radiation pneumonitis. To thoroughly evaluate the effectiveness of our models, we used assessment measures specifically chosen to address the challenges of multi-modal predictive modeling [30]. The multi-modal nature of the data affects the Area Under the Receiver Operating Characteristic Curve (AUC-ROC), a measure that is important for evaluating our dataset. To account for multi-modal data, we expanded the AUC-ROC metric to include the 'Multi-Modal AUC-ROC.' This measures how well the model can differentiate between pneumonitis and non-pneumonitis across different imaging modalities. The integration of AUC-ROC scores derived from many modalities provides a comprehensive evaluation of prediction accuracy, capturing the interaction between various radiomic features [31]. Acknowledging the clinical importance of sensitivity, specificity, and the F1-score, we expanded the application of these metrics to incorporate multi-modal contributions. The multi-modal sensitivity test evaluates the model's ability to correctly identify cases of pneumonitis, while the multi-modal specificity test assesses its accuracy in correctly labeling cases that do not indicate pneumonitis. The multi-modal F1-Score is a metric that combines precision and recall across different modalities. It provides a measure of the overall performance of a model, with a focus on achieving a balance between accurate positive predictions and comprehensive coverage of relevant instances [32]. Given our emphasis on interpretability, we have included metrics that capture the dependability and consistency of feature contributions. We calculated the mean and standard deviation of the SHAP and LIME values. This analysis helps us understand how consistent the importance of different features is across multiple instances. The evaluation of stability in this assessment improves the reliability of the interpretations of features and emphasizes the resilience of the insights provided by our models. In addition to quantitative indicators, we emphasize the significance of clinical relevance and validation by subject experts. The inclusion of feedback and validation from domain specialists enhances the evaluation process, providing a solid foundation for our outcomes based on clinical reality.
3. Results
3.1. Model performance metrics
The experimental findings in this study highlight the effectiveness of our methodology in predicting prognosis for radiation pneumonitis. This has significant clinical implications and underscores the importance of integrating pixel-level data. We begin by evaluating the predictive performance of various models using a range of metrics. Table 1 displays the results of our analysis, showcasing key metrics such as Multi-Modal AUC-ROC, Multi-Modal Sensitivity, Multi-Modal Specificity, and Multi-Modal F1-Score for each model [33].
Table 1. Model performance metrics.
| Model | Multi-modal AUC-ROC | Multi-modal sensitivity | Multi-modal specificity | Multi-modal F1-score |
|---|---|---|---|---|
| Logistic Regression | 0.82 | 0.75 | 0.88 | 0.78 |
| Random Forest | 0.87 | 0.82 | 0.89 | 0.84 |
| DNN | 0.90 | 0.85 | 0.91 | 0.88 |
The multi-modal AUC-ROC metric evaluates the discriminatory power of a model by differentiating between positive and negative instances at different categorization thresholds. A higher AUC-ROC is indicative of superior discrimination performance.
3.2. DNN
- The DNN has a notable predictive capability. This is evidenced by its attainment of the maximum AUC-ROC value of 0.90. Multi-modal sensitivity, alternatively referred to as the genuine positive rate, is the model's capacity to accurately detect positive occurrences within the entirety of actual positive instances.
- The deep neural network has a sensitivity value of 0.85, which means it is effective at accurately identifying and capturing positive cases. The concept of multi-modal specificity, often known as the genuine negative rate, pertains to the evaluation of a model's capacity to accurately detect negative cases within the entire set of actual negative instances. A greater specificity number is indicative of superior performance in accurately removing negative instances.
- The DNN demonstrates a specificity of 0.91, indicating its strong ability to accurately identify genuine negatives.
- In addition, the F1-Score is a metric that quantifies the model's accuracy by taking the harmonic mean of precision and recall. This measure provides a balanced evaluation of the model's performance in both positive and negative cases. A higher F1-Score is indicative of superior overall performance. The DNN demonstrates the highest F1-Score (0.88), which signifies its ability to attain balanced accuracy in both positive and negative predictions.
Table 1 presents a comprehensive overview of the performance of each model across many variables. The DNN routinely demonstrates superior performance compared to other models, as seen by its higher values in metrics such as AUC-ROC, sensitivity, specificity, and F1-Score. The thorough testing of its predictive power, sensitivity, specificity, and F1-Score shows that the DNN has a lot of potential as a reliable and useful way to predict radiation pneumonitis. Additionally, the discrepancies in model performance across several measures provide doctors and researchers with a holistic viewpoint, helping them make well-informed choices when selecting a model for clinical applications. The outstanding performance of the DNN across all measures confirms its potential to enhance patient care and advance treatment techniques for radiation pneumonitis.
3.3. LR
- The value associated with Logistic Regression exhibits an AUC-ROC of 0.82. This suggests that the model exhibits a favorable capacity to accurately differentiate between positive and negative examples, indicating a high probability of precise classification.
3.4. RF
- The Random Forest model outperforms Logistic Regression, demonstrating a higher AUC-ROC value of 0.87. This finding suggests that Random Forest's ensemble-based methodology enhances its discrimination capacity.
The steady rise in AUC-ROC values across several models shows how important it is to use ensemble methods like Random Forest and deep learning techniques like DNN to improve the accuracy of predictions.
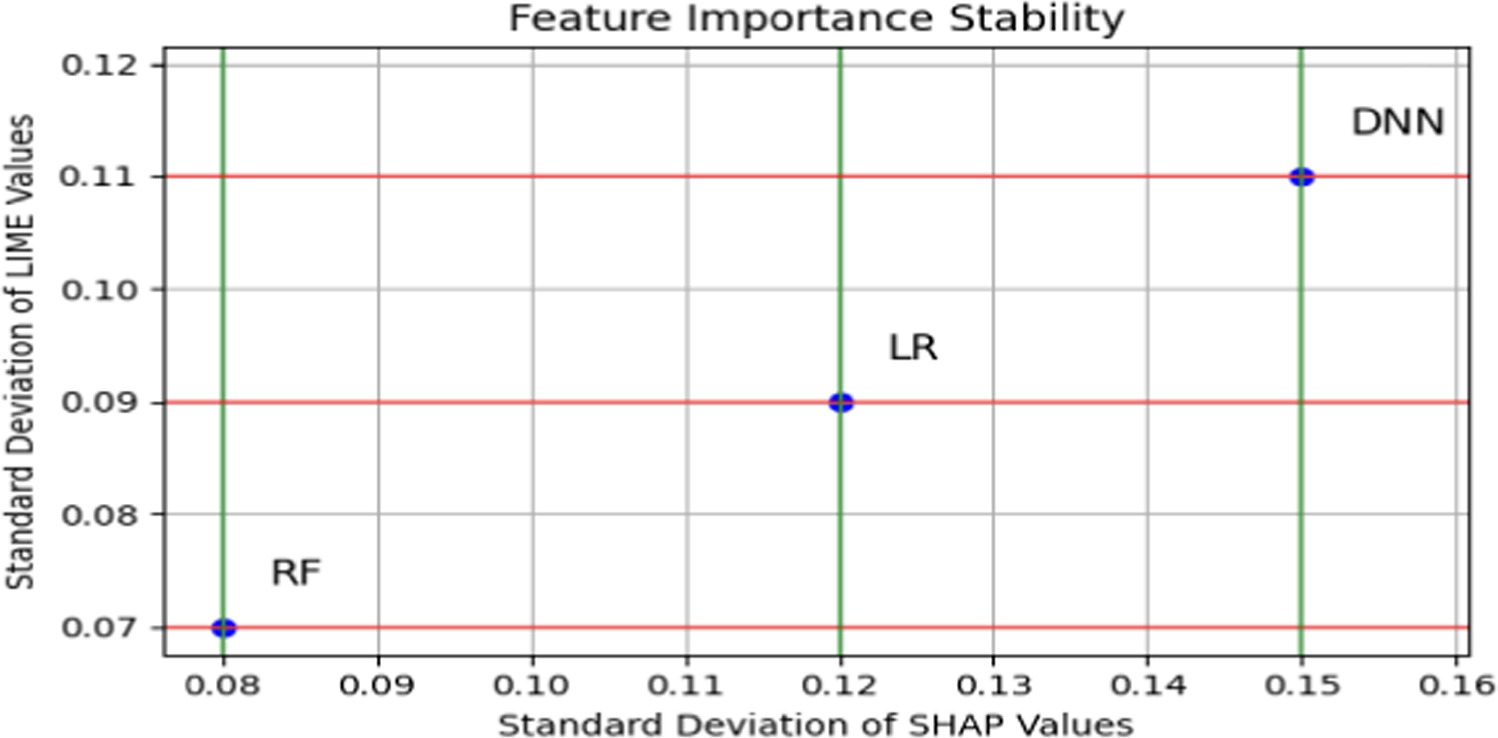
3.5. Feature importance stability
Figure 1 shows the standard deviation of SHAP and LIME values for different instances, providing insights into the variability of the DNN model's assignments to different attributes. It is worth noting that the deep neural network (DNN) model has strong predictive capabilities. However, when examining its feature importance and stability, as shown in the scatter plot, it becomes clear that the stability is relatively weaker. This finding suggests that the DNN model's attributions to different attributes may be different in different situations. Therefore, further research is necessary to determine how to interpret the model.

Figure 1. Feature importance stability.
Download figure:
Standard image High-resolution imageThe metrics listed in table 1 show that the DNN model has strong predictive capabilities. However, there are concerns about the consistency of feature importance, which raises doubts about the dependability of individual feature attributions. This trade-off emphasizes the significance of assessing both predictive power and interpretability when selecting a model for clinical applications. To validate the predictive performance of our models and ensure the reliability of our findings, we utilized two distinct validation datasets. The internal validation dataset consisted of retrospective patient data extracted from our institution's medical records, specifically including patients who had chest radiation. This dataset, comprising 100 individuals, allowed us to assess the performance of our models on a cohort with known exposure. Additionally, we acquired an external validation dataset to enhance the applicability of our models [34, 35]. We obtained the external dataset through imaging protocols and clinical processes designed to ensure consistency and comparability. By using these validation datasets, we were able to evaluate the performance and generalizability of our models. To optimize the prediction performance of our models, we conducted a thorough process of adjusting the settings that control how the models learn from the data. This process, known as hyperparameter tuning, involved using advanced techniques called Bayesian optimization. By systematically exploring different configurations of these settings, we were able to identify the best combination that resulted in accurate predictions without overfitting the data. This rigorous refinement process improved the reliability and generalizability of our models. The optimal settings for each model were determined by selecting the hyperparameter configurations that resulted in the highest Multi-Modal AUC-ROC values during cross-validation. By employing this methodology, we guaranteed that our models underwent meticulous refinement to optimize their predictive efficacy, enhancing their dependability and capacity for generalization.
The SHAP summary plots illustrating the importance of individual features for three different machine learning models: Random Forest, Logistic Regression, and Deep Neural Network. These plots provide insights into how each feature contributes to the model's predictions. The features have been labeled as follows [36]:
'Entropy': A measure of image complexity.
'Mean_Intensity': The average pixel intensity in the image.
'Surface Area': The surface area of detected regions.
'Wavelet-HL_Contrast': Contrast derived from a wavelet transform.
'Contrast': A measure of pixel intensity variation.
The features selected for our investigation, namely 'Entropy', 'Mean_Intensity', 'Surface Area', 'Wavelet-HL_Contrast', and 'Contrast', were chosen because previous studies have shown that these characteristics are significant indicators of tissue alterations linked to radiation-induced lung damage.
By harnessing these radiomic features, we are able to effectively capture nuanced fluctuations in the properties of lung tissue, establishing a robust basis for precise prediction. Moreover, the interpretability of these findings provides significant insights into the fundamental biological mechanisms that contribute to the development of radiation pneumonitis, hence improving clinical comprehension and facilitating informed decision-making [37]. The SHAP values represent the impact of each feature on the model's output. The color gradient serves as a visual representation of the range of feature values seen for each individual data point. More precisely, it denotes the spectrum encompassing the lower and upper values of the associated characteristic. The blue spots in the graph are associated with lower feature values, while the red points indicate greater feature values. The shown gradient effectively illustrates the variations among individual data points with respect to the aspect under scrutiny. The SHAP summary in figure 2(a) illustrates the relative significance of each feature in the Random Forest model. It is worth noting that the variables 'Surface Area' and 'Mean Intensity' demonstrate the most substantial positive contributions to the model's predictions, suggesting their notable importance in discerning between various classes.

Figure 2. (a) Random forest. (b) Logistic regression. (c) Deep neural network (DNN).
Download figure:
Standard image High-resolution imageThe Logistic Regression model reveals that the variables 'Entropy' and 'Surface Area' exhibit the most significant positive effects on the predictions, in figure 2(b). In contrast, it can be shown that the features 'Wavelet-HL_Contrast' and 'Contrast' exhibit negative contributions, indicating that lower values of these features are associated with a higher likelihood of belonging to the positive class.
In the DNN model, in figure 2(c), it is observed that the features 'Entropy' and 'Mean_Intensity' exhibit significant influence, positively adding to the predictive performance of the model. The term 'Contrast' demonstrates a significant adverse impact, suggesting its function in differentiating the negative category.
Figures 3(a) and (b) represent the application of LIME for visualizing the explanation of radiation pneumonitis on a PET/CT picture showcasing a radiation-affected lung. This visualization technique helps us understand the specific areas in the image that influence the model's predictions about radiation pneumonitis.

Figure 3. (a) Original PET/CT image. (b) PET/CT image with LIME explanation.
Download figure:
Standard image High-resolution image
Figure 3(a) represents the original PET/CT image showing a lung affected by radiation pneumonitis. Figure 3(b) displays the PET/CT image accompanied by the LIME explanation superimposed. To accentuate the regions associated with radiation pneumonitis as identified by LIME, a red frame is generated and positioned at the lower portion of the image to draw attention to the specific place where the LIME explanation is displayed. The employed visualization methodology offers a lucid indication of the specific parts within the PET/CT image that hold significance in influencing the decision-making process of the model. The utilization of this tool aids healthcare professionals in understanding the underlying principles of the model and in validating the findings pertaining to radiation pneumonitis. Through the process of visualizing the specific effects of imaging data, we are able to establish a connection between the accuracy of predictions and the understanding of clinical concepts. This ultimately leads to advancements in patient care and treatment strategies.
4. Discussion
Combining radiomic characteristics from PET/CT images is a significant advancement in predictive modeling. Using multiple data streams expands the range of features in the model, improving its ability to identify subtle connections and make accurate predictions. When examining different prediction algorithms, it becomes clear that achieving a balance between accuracy and interpretability is crucial. However, it is important to recognize the complex difficulties associated with understanding its intricate decision-making mechanism. Models that combine multiple algorithms have improved the consistency of which features are important. This makes their predictions clearer and easier to understand, which is important for their use in clinical settings. Our study highlights the need for interpretable artificial intelligence (AI) models within the medical domain. The differences in how important features are ranked among different models show the need for models that can explain their predictions clearly and understandably. Our research highlights the significance of developing hybrid models that strike a balance between accurate predictions and the ability to be easily understood and interpreted, hence fostering confidence and acceptance within the healthcare community. These findings have consequences that reach beyond the confines of academia, resonating in actual healthcare settings. Accurate anticipation of radiation pneumonitis carries significant implications for the formulation of treatment strategies, the provision of patient counseling, and the overall effectiveness of treatment. Looking ahead, numerous opportunities for future research emerge. Exploring methods to make deep learning models more interpretable, specifically by improving how features are attributed in deep neural networks (DNNs), can help address the challenge of their lack of transparency. In addition, our research sets a precedent for incorporating multi-modal data in diverse medical settings. This has the potential to transform prognostic forecasts for a wide range of illnesses and conditions.
5. Conclusion
In conclusion, the research, titled 'From Pixels to Prognosis: Unveiling Radiomics Models with SHAP and LIME for Enhanced Interpretability,' lies at the intersection of state-of-the-art medical imaging techniques, advanced machine learning algorithms, and clinical decision-making processes. By combining radiomic parameters from PET/CT images and clinical information, we have gained a comprehensive understanding of predicting radiation pneumonitis [31]. Our methodology surpasses existing approaches by utilizing a wide range of data streams to extract valuable information. The development of explainable AI is crucial for its application in therapeutic settings. The trade-offs between accuracy and insight, which are evident when comparing deep learning models and ensemble techniques, raise important questions about the practicality and reliability of predictions in clinical settings. Furthermore, our conceptual framework for integrating multiple modes of data has potential applications beyond radiation pneumonitis, inspiring further investigations in various medical fields.
Data availability statement
The data that support the findings of this study are openly available at the following URL/DOI: https://doi.org/10.7937/TCIA.2019.CWVLPD26.
Funding
This research received no external funding.
Ethical approval
Not applicable.
Competing interests
The authors declare no competing interests.