

Abstract
In this study, the performance of a new iterative reconstruction algorithm, the pre-clinical AcurosXB iCBCT algorithm, has been characterized on Varian Halcyon linear accelerators with respect to the potential of radiotherapy dose calculations on CBCT images. The study utilized various phantom setups to verify the accuracy of the pre-clinical algorithm under different scatter conditions and compared dose calculations performed on CBCT images reconstructed with the pre-clinical algorithm to those performed on typical planning CT images. The results indicated that despite showing improvements compared to the existing iCBCT protocol, certain restrictions should be introduced when the pre-clinical AcurosXB iCBCT algorithm was used for dose calculations. Changes in the scatter condition exhibited a larger effect on CBCTs than on planning CTs. Therefore, users should be careful in offsetting the patient and positioning the patient's arms if the resultant images will be used for dose calculations. In addition, protocols with different kV settings should be approached with caution, where 100 kV protocols should only be used to scan the head and neck area, while the rest of the body should be scanned with the 125 kV and 140 kV protocols. When the patient is set up properly and the appropriate energy is selected for the anatomical area, the uncertainty of using the novel AcurosXB iCBCT algorithm for treatment planning dose calculation is within ±2.0%.
Export citation and abstract BibTeX RIS

Original content from this work may be used under the terms of the Creative Commons Attribution 4.0 licence. Any further distribution of this work must maintain attribution to the author(s) and the title of the work, journal citation and DOI.
1. Introduction
The Halcyon 2.0 (Varian Medical Systems, Palo Alto, CA, USA) linear accelerator (linac) released in 2018 integrated a kilo-voltage (kV) cone beam computed tomography (CBCT) system with 11 scan protocols, 24.5 cm scan range, and 49.1 cm scan diameter (FOV) [1]. The subsequent Halcyon 3.0 upgrade has further extended the scan range to 38.5 cm, which is sufficient to cover most treatment areas. This has raised interest as to whether the on-board CBCT can be used as a substitute for a typical planning CT scanner in radiotherapy departments. The capability of performing dose calculations on the CBCT scans produced by the on-board kV imaging system has been assessed by multiple studies [2–7] using various methods. The use of CBCT for dose calculation has gained substantial research interests due to its vast clinical applications, such as offline adaptive radiotherapy [6], dose summation analysis [7], and rapid access to palliative radiotherapy for departments that do not have dedicated CT scanners [8].
When the kV based CBCT system was first introduced to Halcyon 2.0, a comprehensive validation of the systems accuracy for dose calculation was conducted [7]. At that time, it was found that only the 125 kV pelvis protocol could produce a reproducible CT number—electron density (CT-ED) curve for dose calculations, whereas the other two commonly used tube voltages, 100 kV and 140 kV, were deemed not suitable for dose calculation due to several factors. In addition, even with the 125 kV pelvis protocol, it was found that the CT-ED curve changed significantly with different scatter conditions, such as large air cavities within the body or patient offset. Multiple limitations were reported when using the 125 kV pelvis protocol for dose calculation, restricting it to be performed only on pelvis patients whose body contours were fully captured in the FOV. Based on this, the clinical application would be limited.
Since then, Varian has developed a new iterative reconstruction algorithm, the pre-clinical AcurosXB iCBCT algorithm, which is believed to be able to reconstruct CBCT images sufficiently accurate for dose calculations. This pre-clinical reconstruction algorithm is based on the existing iCBCT algorithm included in the Halcyon 3.0 release but with the following new elements in the reconstruction chain:
- Spectrum dependent HU calibration
- AcurosXB CTS scatter reduction [9]
- Detector saturation correction
- Beam shape correction
- Off-focal radiation correction
- Revised beam-hardening correction
- Gradient weighting (motion suppression) correction
While detailed information about the pre-clinical AcurosXB iCBCT algorithm is not provided by the vendor, it is claimed that the algorithm not only reduces artefacts, but also improves Hounsfield unit (HU) accuracy in rough order of most to least impact, which is paramount for the use of CBCT for dose calculation. Additionally, for clinical CBCT imaging, adaptive metal artifact reduction (MAR) and the ability to reconstruct beyond the native FOV has been added. The adaptive MAR is achieved with a multi-pass algorithm which applies metal masking with adaptive thresholding based on connected components classifiers, eliminating or reducing the need to specify the anatomy a priori, i.e., hip prosthesis, dentition, fiducials. In addition, the extended field of view reconstruction (eFOV) permits visualization of anatomy to 70 cm, well beyond the 49.3 cm maximum scan range of the currently released Halcyon CBCT modes.
The purpose of this study was to characterize the CBCT images created by the pre-clinical AcurosXB iCBCT algorithm and assess whether they were suitable for dose calculations in radiotherapy. Due to the length of the paper, this article only discussed the performance of the basic pre-clinical AcurosXB iCBCT algorithm, whereas advanced modules of the algorithm, i.e., MAR and eFOV, were excluded.
2. Materials and methods
2.1. Overview of the kV CBCT system on halcyon 3.0 and the pre-clinical acurosxb iCBCT reconstruction algorithm
The Halcyon 3.0 system has an on-board kV CBCT imaging system consisting of a kV x-ray source and an amorphous silicon detector. The effective area of the detector is 43 cm × 43 cm (1280 × 1280 pixels). The source-to-imager distance and source-to-axis distance are 154 cm and 100 cm, respectively [10].
While the kV source can generate a tube voltage anywhere between 40 and 150 kV, the most common clinical protocols utilize 100 kV for head and neck (H&N) patients, 125 kV for breast, pelvis, and thorax patients, and 140 kV for large pelvis patients (body mass index (BMI) ≥ 30). Under each tube voltage, there are several protocols for different purposes, which only differ in the default exposure (mAs) and the number of projections to control the imaging dose. Other than the H&N protocols, which have a reconstruction diameter of 28.1 cm, all protocols have a reconstruction diameter of 49.1 cm [1]. Iterative CBCT reconstruction is available for a selective number of protocols.
2.2. Research design and research tools
Measurements in this study were acquired across two Halcyon linacs, HAL1 (Serial No. (SN) HAL1140) and HAL2 (SN HAL1069). During commissioning, the mechanical, geometric, and patient setup accuracy as well as the image quality of both linacs were verified by the local medical physics team against local and international recommendations [11, 12]. The two linacs shared the same beam model as well as a standard list of CBCT protocols composed of identical parameters including energy (kV), exposure (mAs), scan time, and scan diameter (appendix A1).
The pre-clinical AcurosXB iCBCT required users to first perform air scans as well as scans of the Quartz phantom using different tube voltages. The raw projection data of these scans were subsequently uploaded to a dedicated Varian Research Portal (VRP) and processed by the vendor to establish spectrum dependent HU calibration and incorporate it in the algorithm. Once this was completed, the experimental data were then uploaded to the VRP and reconstructed using the pre-clinical AcurosXB iCBCT protocol.
This study comprised of three parts. Details of the experiments are provided in subsequent sections, but a summary is given here. In the first part, CT—Physical Density (CT-PD) curves for different tube voltages were established for both linacs. This was achieved using a CIRS Model 062 M CT-ED phantom (CIRS Tissue Simulation & Phantom Technology, Norfolk, VA, USA). The same phantom was used for both linacs. The phantom consists of two nested water-equivalent disks. The inner disk, which has a diameter of 18 cm, represents the head configuration, while the outer disk, which has a width and a height of 33 cm and 27 cm respectively, represents the body configuration. A total of nine different tissue equivalent electron density plugs can be positioned at 17 different locations within the scan field [13].
In the second part, a CIRS Model 002lFC IMRT Thorax phantom (CIRS Tissue Simulation & Phantom Technology, Norfolk, VA, USA) was used to acquire chamber measurements and compare to treatment planning system (TPS) calculations. A similar approach was adopted by Guan et al [6]. The phantom is elliptical in shape and represents an average human torso in proportion, density, and two-dimensional structure. It measures 30 cm long × 30 cm wide × 20 cm thick. Linear attenuations of the simulated tissues are within 1% of actual attenuation for water and bone, and within 3% for lung from 50 keV to 15 MeV. Tissue equivalent interchangeable rod inserts accommodate ionization chambers allowing for point dose measurements in multiple planes within the phantom. Hole placement allows verification in the most critical areas of the chest [14].
In the third part, patient CBCTs were reconstructed using the AcurosXB iCBCT algorithm. The original treatment plan was subsequently copied onto the CBCT for re-calculation. The recalculated dose distribution was then compared to that of the original plan calculated on the planning CT. PTW Verisoft Patient Plan Verification software (PTW-Freiburg, Freiburg, Germany), version 6.2.0.25, was used to conduct the gamma analysis between the two plans. The same approach was adopted by several articles to evaluate the accuracy of CBCT in dose calculation [4, 7].
2.3. CT-PD curve establishment
The first part of the study aimed to establish a CT-PD curve for each tube voltage. The reason why CT-PD curves rather than CT-ED curves were established was because the calculation algorithm used in this study was the AcurosXB algorithm Version 16.1 (Varian Medical Systems, Palo Alto, CA, USA), which explicitly models physical interactions with matters using the mass density and material type for each voxel of the CT dataset [15–18]. To acquire data for the CT-PD curve, the CIRS CT-ED phantom was placed in the centre of the bore and scanned with the H&N (100 kV), the Pelvis (125 kV), and the Pelvis Large (140 kV) protocols at the maximum FOV and scan range. As the H&N protocol was designed for the human head geometry, the reference scan for 100 kV only included the inner disk of the CT-ED phantom. For the other two kV settings, the entire phantom was included in the reference scan. In addition, 5 cm water-equivalent materials were added to the phantom in both the superior and the inferior directions to ensure a full scatter condition. During the scan, the two inserts of the same material were distributed evenly between the inner and the outer disks such that each disk would contain eight different material plugs other than water.
Once the scans were acquired and reconstructed on the VRP, they were imported into the Eclipse TPS Version 16.1 (Varian Medical Systems, Palo Alto, CA, USA) to read the average HU of each material by creating a 1.5 cm × 1.5 cm × 2.4 cm cylindrical region-of-interest (ROI) centred within each insert. For the 125 kV and the 140 kV protocols, the average HU of the two inserts of the same density sitting across the inner and the outer disks was then calculated to establish the CT-PD curve. For the 100 kV Head protocol, the scan that only included the inner disk was used to establish the CT-PD curve. The curves were subsequently extrapolated linearly to 8.000 g cm−3 to encompass high density materials such as titanium. The standard deviation of each insert was recorded as an indication of the signal-to-noise (SNR) ratio.
In this study, the CT-PD curve was established with the phantom centred in the FOV. In clinical applications, various setups could lead to different scatter conditions that could change the CT-PD curve. Therefore, additional tests were performed to quantify the influence of different scatter conditions on the CT-PD curve, the details of which are listed in table 1.
Table 1. Setups of additional scans quantifying the effect of scatter conditions on the CT-PD curve.
| Scan ID | Inner/outer disk | Offset distance (cm) | Offset direction | Comment |
|---|---|---|---|---|
| 0 | Both | N/A | N/A | Reference scan for 125 kV and 140 kV |
| 1 | Inner Disk Only | N/A | N/A | Reference scan for 100 kV |
| 2 | Outer Disk Only | N/A | N/A | |
| 3 | Both | 5 | Right | Not shown in figure 1 |
| 4 | Both | 10 | Right | |
| 5 | Both | 5 | Anterior | Not shown in figure 1 |
| 6 | Both | 10 | Anterior | |
| 7 | Both | N/A | N/A | A piece of 3 cm bolus is added to the anterior of the phantom |
| 8 | Both | N/A | N/A | Two bottles of water are placed adjacent to the phantom |
Raw data from each scan scenario were uploaded onto the VRP and reconstructed using the pre-clinical AcurosXB iCBCT algorithm. The reconstructed scans were subsequently imported into the Eclipse TPS to read the average HU as well as the standard deviation. The resultant HU reading of each insert was then compared to the value used by the CT-PD curve (reference scan).
2.4. CIRS Thorax phantom calculations and measurements
The CIRS thorax phantom was adopted to verify the accuracy of the established CT-PD curves of both linacs. The phantom was first scanned at 2 mm slices on a typical diagnostic quality planning CT scanner (Toshiba Aquilion, Toshiba Medical Systems, Minato City, Tokyo, Japan) that was routinely used for radiotherapy treatment planning. During the scan, the phantom was placed in the centre of the FOV.
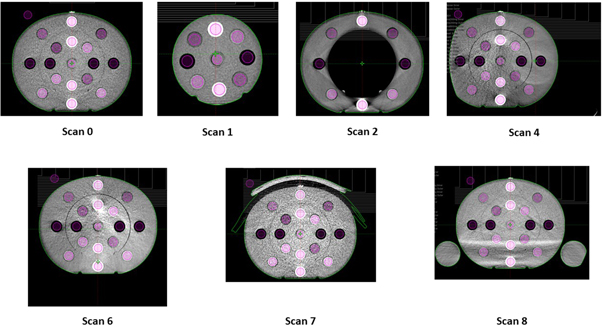
Figure 1. CT-ED phantom setups to simulate different scatter conditions.
Download figure:
Standard image High-resolution imageThe phantom has a water-equivalent farmer type chamber insert that can be placed at different locations. To comprehensively test the accuracy of the AcurosXB iCBCT algorithm in different tissues, in this study, the insert was placed in (A) Tissue; (B) Lung; and (C) Bone, as shown in figure 2. A VMAT plan was then created, delivering 2 Gy per fraction to the cylindrical target. The VMAT plan consisted of two full arcs (181° to 179° and 179° to 181° in the IEC61217 coordinate system), and the monitor unit (MU) of each arc was between 375.9 MU and 529.1 MU. The plan was calculated in Eclipse using the AcurosXB algorithm and a dose grid of 0.25 cm.

Figure 2. CIRS Thorax phantom setup with the farmer type chamber insert in different tissues: (A) Tissue; (B) Lung; (C) Bone.
Download figure:
Standard image High-resolution imageThe phantom was then centred in the FOV and scanned on both Halcyon linacs using the 100 kV Head, the 125 kV Pelvis, and the 140 kV Pelvis Large protocols. After the raw CBCT were reconstructed on VRP using the pre-clinical AcurosXB iCBCT algorithm, the plan was copied across to the reconstructed CBCT images and recalculated using the corresponding CT-PD curves established in section 2.3. The dose volume histograms (DVHs) and the dose files of the CBCT plans were subsequently compared to those of the planning CT based treatment plans. In addition, the point doses calculated by both imaging modalities were compared to the measurements acquired by a PTW31010 0.6cc cylindrical ionization chamber. The farmer type chamber was chosen because of its superior reliability and a response that is independent of dose rate and energy [19]. In this study, the dose in the planning target volume (PTV) was uniform, thereby allowing measurements to be acquired with the farmer chamber despite its relatively large sensitive volume.
This measurement was only acquired on HAL1, given it had been previously established that both linacs were beam-matched with identical dosimetric characteristics.
2.5. Patient recalculation
A total of 24 clinical patients, covering anatomical sites ranging from brain, H&N, breast, thorax, and pelvis, were selected. In order the minimize the effect of truncated tissue due to the limited FOV of the CBCT, the patients were selected according to the following criteria: (1) The PTV as well as at least 3 cm of surrounding tissue are captured in the FOV; and (2) If the patient's body contour is truncated, the beams, whether IMRT or VMAT, are arranged such that they do not go through the missing tissue. By doing so, the effect of missing tissue on the CBCT due to limited FOV is minimized.
Once suitable patients were identified, the raw projection CBCT data of the first fraction were retrieved from the database and reconstructed on the VRP. Once reconstructed, the CBCTs were imported into the Eclipse TPS, and a manual rigid registration between the CBCT and the diagnostic planning CT prioritizing the target area was performed by a medical physicist and reviewed by another medical physicist. Following image registration, relevant structures (e.g., PTV and Body) were propagated from the diagnostic planning CT to the CBCT. The plan was then recalculated using the same registration frame. The dose files of both the original calculation and the re-calculation were subsequently exported and compared in the PTW Verisoft Patient Plan Verification software.
Although the earliest possible treatment image was selected during this stage of the study, it was inevitable that there were certain anatomical variations between the diagnostic planning CT and the CBCT, as shown in figure 3. One way to compensate for this was to copy the body structure from the diagnostic planning CT onto the CBCT and override any missing tissue to the density of water [7], but this method could not account for the change in tissue displacement. Another method was to introduce deformable image registration (DIR) and HU mapping [20]. However, DIR was not clinically implemented in the department and could introduce additional errors that would be difficult to identify during the dose comparison process [21]. Therefore, to minimize the effect of anatomical variations, the rigid registration that linked the CBCT to the diagnostic planning CT prioritized the target area, and the gamma analysis utilized a dose threshold of 50% instead of 10%, so that only dose deviations in the target area were reflected in the result. Despite this, the authors acknowledge that the anatomical variation between the diagnostic planning CT and the CBCT could still heavily impact the dose calculation, especially if the target area was very close to the body surface.

Figure 3. Diagnostic planning CT and CBCT images of a pelvis patient highlighting anatomical variation in the body contour. This effect was minimized by selecting CBCT images of the earliest possible treatment fraction and applying a dose threshold of 50% during gamma analysis.
Download figure:
Standard image High-resolution image3. Results and discussions
3.1. CT-PD curve analysis
3.1.1. CT-PD curve establishment
The 100 kV, 125 kV, and 140 kV CT-PD curves for HAL1 and HAL2 are shown in tables 2–4 and figure 4. Figure 4 only displays the CTPD curve within the rage of 0.205 g cm−3 to 1.530 g cm−3 to improve the resolution.
Table 2. 100 kV CT-PD values.
| Material | Physical density (g cm−3) | HAL1 CT number (HU) | HAL2 CT number (HU) |
|---|---|---|---|
| Air | 0.000 | −1000.0 | −1000.0 |
| Lung Inhale | 0.205 | −810.4 | −822.4 |
| Lung Exhale | 0.507 | −511.2 | −524.5 |
| Adipose | 0.960 | −76.5 | −83.0 |
| Breast | 0.990 | −40.3 | −46.3 |
| Water | 1.000 | 0.0 | 0.0 |
| Muscle | 1.060 | 39.4 | 28.9 |
| Liver | 1.070 | 52.5 | 43.3 |
| Trab Bone | 1.160 | 277.1 | 268.1 |
| Dense Bone | 1.530 | 1132.3 | 1108.4 |
| Extrapolation Point | 8.000 | 16086.7 | 15802.3 |
Table 3. 125 kV CT-PD values.
| Material | Physical density (g cm−3) | HAL1 CT number (HU) | HAL2 CT number (HU) |
|---|---|---|---|
| Air | 0.000 | −1000.0 | −1000.0 |
| Lung Inhale | 0.205 | −808.8 | −800.0 |
| Lung Exhale | 0.507 | −508.9 | −516.9 |
| Adipose | 0.960 | −49.3 | −75.8 |
| Breast | 0.990 | −15.1 | −44.4 |
| Water | 1.000 | 0.0 | 0.0 |
| Muscle | 1.060 | 58.7 | 25.5 |
| Liver | 1.070 | 68.0 | 29.4 |
| Trab Bone | 1.160 | 243.3 | 197.7 |
| Dense Bone | 1.530 | 973.1 | 864.1 |
| Extrapolation Point | 8.000 | 13734.1 | 12517.1 |
Table 4. 140 kV CT-PD values.
| Material | Physical density (g cm−3) | HAL1 CT number (HU) | HAL2 CT number (HU) |
|---|---|---|---|
| Air | 0.000 | −1000.0 | −1000.0 |
| Lung Inhale | 0.205 | −804.3 | −798.7 |
| Lung Exhale | 0.507 | −510.2 | −517.3 |
| Adipose | 0.960 | −55.8 | −76.6 |
| Breast | 0.990 | −24.2 | −47.9 |
| Water | 1.000 | 2.0 | 1.0 |
| Muscle | 1.060 | 51.0 | 21.6 |
| Liver | 1.070 | 57.5 | 26.0 |
| Trab Bone | 1.160 | 216.8 | 181.7 |
| Dense Bone | 1.530 | 895.4 | 811.4 |
| Extrapolation Point | 8.000 | 12761.9 | 11821.7 |

Figure 4. CT-PD curves of different tube voltages.
Download figure:
Standard image High-resolution imageIt can be seen from the results that although the 100 kV CT-PD curves of the two Halcyon linacs are near identical, the 125 kV and the 140 kV CTPD curves differ significantly in the Dense Bone HU. This was unexpected, as the two linacs shared the same imaging protocols and key parameters such as collimation, tube voltage, and tube current, and measurements were acquired using the same CT-PD phantom and setup. The discrepancy was not present when reconstructing the images with the current clinical iCBCT algorithm (data not shown), suggesting this was more likely to be an effect of the pre-clinical AcurosXB algorithm, which introduced the additional function of, spectrum dependent HU calibration, rather than the imaging hardware. Based on this result, it was decided that other than 100 kV, separate CT-PD curves must be created for each linac to minimize dose calculation inaccuracy.
3.1.2. Impact of scatter condition on the CT-PD curve
The authors previously investigated the impact of HU variation on dose calculation using a worst-case-scenario simulation. A VMAT plan with reasonable complexity was created on a 30 cm cylindrical phantom. The HU of the phantom was then varied by increments of 25 HU and the VMAT plan was recalculated. From the test, it was found that within the range of adipose to liver (−100HU to 100HU), the correlation was a 2% variation in point dose per 50 HU density change [22]. For materials with lower or higher densities, such as the lungs or bones, the higher the absolute density of the material, the smaller the effect of HU variation on dose calculation. HU deviation tolerances for dose calculation were determined as 100 HU for materials outside the adipose—liver range to maintain an accuracy of 2% in dose calculation. Based on this, HU variations of more than 50 HU in the adipose—liver range or more than 100 HU in other materials were considered to have insufficient density stability for the purpose of dose calculations. This assessment criterion was applied to the HU results of various clinical scenarios in comparison to the reference CT-PD curve. The results are shown in table 5.
Table 5. Maximum HU difference between the CT-PD curve and CBCT scans acquired under different conditions for the different inserts. HU differences larger than 50HU in the adipose—liver range or 100 HU on other materials are highlighted in red.
|
* Results labelled in red means that the HU difference is out of the specified tolerance.
The standard deviation of each insert under different scan conditions is listed in table 6. Similarly, if the standard deviation of materials in the adipose—liver range exceeded 50 HU, or that of the inserts outside this range exceeded 100 HU, the setup was considered not suitable for dose calculation.
Table 6. Maximum standard deviation of different inserts scanned under different conditions. Standard deviations larger than 50HU in the adipose—liver range or 100HU on other materials are highlighted in red.
|
* Results labelled in red means that the HU standard deviation is out of the specified tolerance.
For 100 kV, not only was the HU deviation between the reference scan and other scans substantial, but the standard deviation of most scatter conditions was out of tolerance, rendering them unsuitable for dose calculations. This is because the 100 kV Head protocol is designed specifically for the H&N configuration, the typical width and length of which is approximately 15 cm and 18 cm, respectively. Therefore, when only the inner disk of the CIRS CTED phantom was scanned, both the reproducibility and the SNR of the scan were acceptable. In contrast, for the other scans where the geometry of the scanned material was larger, both the HU difference and the standard deviation were out of tolerance (i.e., >50 HU in the adipose—liver range or >100 HU in other materials). An example of Scan 4 acquired with the 100 kV Head protocol on HAL1 is shown in figure 5, which illustrates both the HU deviation between the inner and the outer disks as well as the increased noise.
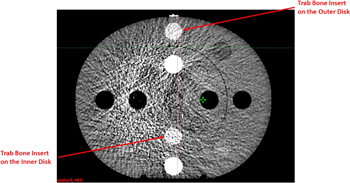
Figure 5. CBCT image of the CIRS CTED phantom acquired with the 100 kV Head protocol. Obvious noise and artefacts were observed. The two trabecular bone (Trab Bone) inserts, which had the same density, are highlighted.
Download figure:
Standard image High-resolution imageHU response results for the 125 kV and 140 kV protocols were similar across the scan variants. Table 5 shows that the standard deviations of both tube voltages were within the tolerance across the two linacs, indicating that the SNRs of both protocols were acceptable. This can also be seen from figure 6, which, compared to figure 5, shows significantly higher SNR under the same scatter condition.
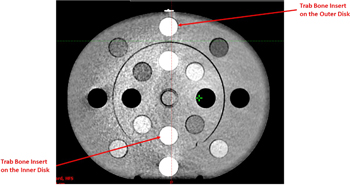
Figure 6. CBCT image of the CIRS CTED phantom acquired with the 125 kV Pelvis protocol.
Download figure:
Standard image High-resolution imageTable 5 shows that high- and low-density objects appeared to be the most affected by changes in scatter conditions. The effect was most predominant when the edge of the phantom was no longer fully captured within the FOV. The issue of image truncation artefacts and HU performance in iCBCT has been addressed in the literature [23, 24]. The results in this study are consistent with those reported by Jarema et al that characterized the previous version of CBCT algorithms on Halcyon linacs [7]. As none of the incorporated algorithm additions provided in the pre-clinical algorithm addressed this data sufficiency problem, these results were in line with expectation. The impact of axial truncation resulted in calculation inaccuracy risks where small portions of the patient contour might be truncated. It should be noted that in this study, the soft-tissue inserts were placed in diagonal positions of the CIRS CTED phantom such that lateral and vertical offsets would pose similar effects on their HU variation. For both linacs, the HU deviations of both material ranges were out of tolerance when the phantom was offset by 10 cm, which indicated that under the AcurosXB iCBCT reconstruction algorithm, if the object was offset by a significant distance, the HU stability of the reconstructed images would likely collapse due to truncation artefacts, making it unsuitable for dose calculations.
Although showing a similar trend, the two Halcyon linacs behaved slightly differently under different scatter conditions. At both 125 kV and 140 kV, the HU deviation of Scan 1 acquired on HAL2 was out of tolerance but that of HAL1 was within. To ensure maximum accuracy, if the result of a linac under a certain scatter condition was out of tolerance, the clinical use of scans under the same condition was prohibited on both linacs such that instructions would remain consistent across departments.
Jarema et al reported that the existing Halcyon CBCT protocol could not be used for dose calculations in geometries with large cavities (e.g., breast/thorax patients where the lungs are included in the scan) [7] because of their significant impact on the CT-ED/PD curve. However, when the pre-clinical AcurosXB iCBCT algorithm was used, minimal HU variation was seen in Scan 2, where the inner disk of the phantom was removed to simulate breast/thorax patients. This is a major improvement of the new algorithm, which can now accurately predict the density of air cavities within the body, thereby allowing dose calculations on the CBCT images of breast/thorax patients.
Based on the results from tables 5 and 6, table 7 tabulates whether the AcurosXB iCBCT algorithm is considered suitable for dose calculations under different scatter conditions.
Table 7. Summary of whether the AcurosXB iCBCT algorithm is suitable for dose calculations under different scatter conditions.  : Suitable;
  : Not suitable, where either the HU difference or the standard deviation exceeded the tolerance of ±50/100HU. Details of the setup of different scan IDs can be found in table 1.
|
From table 7, it can be seen that the 100 kV energy is only suitable for scanning small geometries such as the H&N, whereas scanning large objects will result in significant HU differences from the established CT-PD curve, as well as substantial noise that will contribute to calculation inaccuracy. In contrast, 125 kV and 140 kV are not suitable for scanning objects with a size smaller than or equivalent to that of the H&N. However, when used to scan large objects analogous to human body, their performance is acceptable in most scatter conditions. The only exceptions are Scans 4 and 6, where the phantom was offset either laterally and vertically by 10 cm, and Scan 8, where two bottles of water were added next to the phantom to simulate patient arms. Therefore, when intending to use 125 kV and 140 kV images reconstructed with the AcurosXB iCBCT algorithm for dose calculations, users should aim to reduce patient offset as well as ensuring that the patient's arms are placed out of the scan range to maximize dose calculation accuracy.
The results also indicate that for H&N patients whose treatment area extended down to the shoulder, none of the energies would be suitable due to the vastly varying geometry. For such patients, it is recommended that if possible, clinical staff should scan the patients with both 100 kV and 125/140 kV and carefully assess the results based on dose calculations performed on both datasets. For example, targets in the H&N area can be assessed using the dataset acquired under 100 kV, whereas targets in the shoulder area can be assessed using that acquired under 125 kV, so as to maximize the accuracy of dose calculation.
3.2. CIRS Thorax phantom calculations and measurements
Based on the results of section 3.1, the 100 kV H&N protocol was not used to scan the CIRS Thorax phantom. In addition, the general performances of the 125 kV and the 140 kV protocols were similar. Therefore, the phantom was only scanned with the 140 kV Pelvis Large protocol.
3.2.1. DVH comparison
The DVHs of the critical organs in the CIRS Thorax phantom were calculated on the diagnostic planning CT and the CBCT reconstructed with the AcurosXB iCBCT algorithm. They were subsequently compared, the results of which are shown in figure 7.

Figure 7. Comparison of DVHs calculated on the diagnostic planning CT and the CBCT reconstructed with the AcurosXB iCBCT algorithm. Square dots: DVHs calculated on the diagnostic planning CT; Triangle dots: DVHs calculated on the CBCT; Cyan: PTV; Pink: Spine; Yellow: L_Lung; Light Green: R_Lung.
Download figure:
Standard image High-resolution imageNo significant differences were observed between the DVHs calculated on the CBCT and those calculated on the diagnostic planning CT.
3.2.2. Chamber measurement and gamma comparison
In addition to DVHs, a gamma analysis was performed between the dose files calculated on the CBCT and the diagnostic planning CT. Unlike patient scans, there was no anatomical variations of the phantom between the CBCT and the diagnostic planning CT. Therefore, the gamma analysis was carried out both with the 10% threshold and the 50% threshold. The results are shown in table 8.
Table 8. 2% 2 mm Gamma analysis results of the dose files calculated on the CBCT and the diagnostic CT. Both the 10% and the 50% dose thresholds were used.
| Plan | 2%/2 mm 10% Th | 2%/2 mm 50% Th |
|---|---|---|
| Target in Tissue | 99.1% | 99.1% |
| Target in Lung | 98.0% | 99.3% |
| Target in Bone | 98.4% | 99.0% |
The point doses calculated on the CBCT and the diagnostic planning CT were also compared with each other as well as with measurements acquired with the PTW 31010 cylindrical chamber. The results are shown in table 9.
Table 9. Comparison of the point doses calculated on the CBCT and the diagnostic planning CT with measurements acquired with the calibrated ionisation chamber.
| pCT TPS dose (Gy) | AXBCBCT TPS Dose (Gy) | Diff (%) | Measured dose | Diff pCT (%) | Diff AXBCBCT (%) |
|---|---|---|---|---|---|
| Target in Tissue | |||||
| 2.17 | 2.17 | −0.24% | 2.19 | −0.74% | −0.97% |
| Target in Lung | |||||
| 2.15 | 2.15 | −0.27% | 2.19 | −1.55% | −1.81% |
| Target in Bone | |||||
| 2.13 | 2.12 | −0.21% | 2.17 | −2.02% | −2.23% |
It can be seen from table 8 that the two dose files calculated on different image sets agree well regardless of whether the target was in the tissue, bone, or lung, with the lowest gamma score being 98.0% using the 2%2 mm criteria. No common region of failure was found between the three plans. In addition, point doses calculated on the diagnostic planning CT and the CBCT were within ±0.5% of each other and ±1.0% to the measurement when the target was in tissue, ±2.0% to the measurement when the target was in lung, and ±2.5% to the measurement when the target was in bone. The reason why the difference between the calculated and the measured point doses was larger when the target was located in the lung and bone was most likely because of inaccuracy in the way the TPS modelled inhomogeneous materials, as the calculated doses agreed well between the CBCT and the diagnostic planning CT. This effect has been well discussed in various studies [15–18] and is not further discussed here as it is beyond the scope of this study.
The results of this section indicate that dose calculations performed on the CBCT acquired with the 140 kV Pelvis Large protocol and reconstructed with the AcurosXB iCBCT algorithm have comparable accuracy to those performed on the diagnostic planning CT regardless of whether the target was located in tissue, lung, or bone. Combined with results from section 3.1.2, it is therefore concluded that if the patient is set up properly and the appropriate energy is selected for the anatomical area as per table 7, the uncertainty of using the novel AcurosXB iCBCT algorithm for treatment planning dose calculation is within ±2.0%.
3.3. Clinical data comparison
The gamma scores of the agreement between the CBCT and the diagnostic planning CT are shown in table 10. The analysis criteria were 2% 2 mm, 50% dose threshold, and 3D global criteria.
Table 10. Gamma analysis results of patients treated on HAL1 and HAL2 from the Verisoft software using the 2% 2 mm 50% dose threshold 3D global criteria.
| Patient ID | Anatomical site | Tube voltage (kVP) | Plan type | Gamma score (2% 2 mm) |
|---|---|---|---|---|
| 1 | Breast | 125 | Hybrid IMRT | 97.2% |
| 2 | Breast | 125 | VMAT | 88.0% |
| 3 | Breast | 125 | Dual-iso VMAT | 92.5% |
| 4 | Breast | 125 | VMAT | 97.9% |
| Breast Average | 93.9% | |||
| 5 | Thorax | 125 | VMAT | 93.2% |
| 6 | Thorax | 125 | VMAT | 91.1% |
| 7 | Thorax | 125 | VMAT | 97.7% |
| Thorax Average | 94.0% | |||
| 9 | Pelvis | 125 | VMAT | 96.4% |
| 10 | Pelvis | 125 | VMAT | 98.6% |
| 11 | Pelvis | 125 | VMAT | 98.0% |
| 12 | Pelvis | 140 | VMAT | 98.8% |
| 13 | Pelvis | 125 | VMAT | 98.9% |
| 14 | Pelvis | 140 | VMAT | 98.8% |
| 15 | Pelvis | 125 | VMAT | 98.5% |
| 16 | Pelvis | 125 | VMAT | 99.6% |
| 17 | Pelvis | 125 | VMAT | 99.9% |
| 18 | Pelvis | 125 | VMAT | 96.8% |
| Pelvis Average | 98.4% | |||
| 19 | Brain | 100 | VMAT | 97.2% |
| 20 | Brain | 100 | VMAT | 98.1% |
| Brain Average | 97.7% | |||
| 21 | H&N | 100 | VMAT | 95.2% |
| 22 | H&N | 100 | VMAT | 97.8% |
| 23 | H&N | 100 | VMAT | 98.6% |
| 24 | H&N | 100 | VMAT | 89.6% |
| H&N Average | 95.3% |
Table 10 indicates that for both brain and pelvis patients, the gamma scores are consistently above 95.0%, suggesting good accuracy comparable to that of a diagnostic planning CT scanner. The study by Jarema et al [7] reported that the current iCBCT protocol was suitable for dose calculation for pelvis patients provided adequate scattering conditions were present. However, they did not investigate the accuracy of dose calculation in other areas, neither did they explore the performance of protocols with different kV settings. This study found similar results, that images reconstructed with the upgraded preclinical algorithm provided sufficient accuracy for pelvis patients regardless of whether the patient was scanned at 125 kV or 140 kV. In addition, when the 100 kV protocol was used for brain patients, the resultant images provided sufficient accuracy for dose calculation.
Although 125 kV was previously considered suitable to scan breast patient for dose calculations as per section 3.1.2, their average gamma score was significantly lower than that of pelvis patients. This is because the target area of breast patients was almost always right on the body surface, which was prone to body shape changes and setup inaccuracy. As an example, figure 8 shows the detailed results of Patient No. 2, which has a gamma score of 88.0%. For this patient, the majority of the failed gamma points are a result of body contour changes on the patient surface. When this patient is excluded, the average gamma score of breast patients rose to 95.9%, similar to that of pelvis patients. In addition, the target area of breast patients was more prone to breathing motion compared to pelvis patients. Therefore, it is expected that the average gamma score of breast patients was lower than that of pelvis patients.
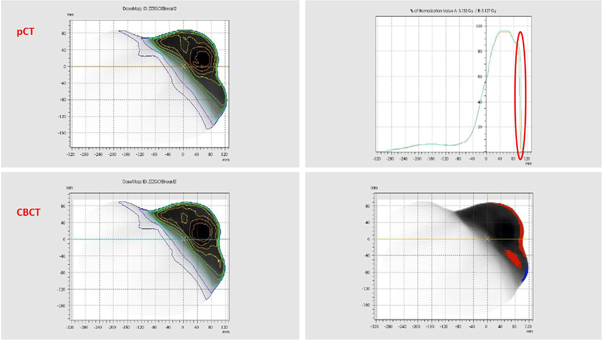
Figure 8. Detailed gamma results of Patient ID 2. The top right corner shows dose profile changes, which clearly indicates that there is a gap between the CBCT dose file and the diagnostic planning CT dose file due to body shape variation. The bottom right corner shows the gamma results in 2D, with red indicating points failing gamma analysis that are hotter and blue indicating points failing gamma analysis that are colder. Again, most failed points are near the surface region due to body contour change.
Download figure:
Standard image High-resolution imageSimilarly, the average gamma score for thorax patients was lower than that of pelvis patients despite using the same tube voltage of 125 kV. This is likely because when treating the three patients included in this study, other than the use of 4DCT for delineation and the incorporation of appropriate margins, no other motion management techniques, such as abdominal compression or gating, were adopted. Therefore, the targets in these patients had a similar degree of breathing motion with breast patients, which could compromise the gamma agreement between diagnostic planning CT and CBCT calculations.
In addition, it should be noted that the author's department did not utilize the density override technique proposed by Wiant et al for VMAT lung cases [25], and therefore the doses calculated on the free breathing or the average CT scans might not be able to accurately predict dose of parts of the target volume not occupied by tumour on the diagnostic planning CT scan. However, quantifying the amount of error introduced by different uncertainty components is beyond the scope of this study and therefore is not further discussed here. Although the average gamma score of thorax patients was slightly below 95.0%, based on the fact that the gamma score of individual patients was consistently above 90.0% and the results from section 3.2, the authors concluded that the performance of the pre-clinical AcurosXB iCBCT algorithm was considerably better than that of the previous version, although further verification might be required due to the small sample size.
For H&N Patient No. 24 with a gamma score of 89.6%, the treatment volume extended inferiorly to the shoulder level. As seen for the phantom data in section 3.1.2, HU discrepancies and image noise increased when scanning large volumes with the 100 kV protocol. Additionally, changes in body shape and setup inaccuracy also gave rise to failing gamma points at the shoulder surface as seen in figure 9, which, when combined with CBCT image noise as shown in figure 10, further contributing to the low gamma score. Again, when this patient was excluded, the average gamma score of H&N patients was 97.2%, which is above 95.0% and similar to that of other treatment areas.

Figure 9. Detailed gamma results of Patient ID 24 with failed points around the shoulder and inside the PTV due body contour changes and poor image quality.
Download figure:
Standard image High-resolution image
Figure 10. Corresponding axial pCT, CBCT and fused pCT/CBCT images for Patient ID 24 showing CBCT image noise and changes in the position of the right shoulder.
Download figure:
Standard image High-resolution image
This study had some limitations. First, when comparing patient's CBCT and diagnostic planning CT data, a number of patient specific factors, including the patient's anatomical variations between the diagnostic planning CT and the Day-1 CBCT, were not excluded. A solution would be to introduce DIR together with HU modifications, but this method was not utilized due to technical limitations [17]. However, if such effects exist, it is only expected to magnify the difference when carrying out gamma comparisons. Second, to limit imaging dose, the length of the CBCT was often substantially shorter than that of the diagnostic CT, and therefore the scatter condition of the two can be different, which may introduce bias to the gamma comparison. Third, the sample size of the clinical data was relatively small, making it difficult to determine the significance of the results. In the future, the authors plan to include more patients to further verify the results of this study.
4. Conclusion
In this study, the authors carried out comprehensive validation of the pre-clinical AcurosXB iCBCT algorithm and found that despite showing improvement compared to the existing iCBCT protocol, certain restrictions should be introduced when it is used for dose calculations. In particular, changes in the scatter condition had a larger effect on CBCTs than on diagnostic planning CTs due to the use of a cone beam rather than a fan beam.
Therefore, users should be careful in offsetting the patient and positioning the patient's arms if the resultant images will be used for dose calculations. In addition, protocols with different kV settings should be approached with caution, where 100 kV protocols should only be used to scan the H&N area without extending down to the shoulder, while 125 kV and 140 kV protocols should be adopted to scan the rest of the body.
If certain restrictions are able to be implemented, then images reconstructed with the pre-clinical AcurosXB iCBCT protocol would be considered suitable for dose calculations. In particular, when the patient is set up properly and the appropriate energy is selected for the anatomical area, the uncertainty of using the novel AcurosXB iCBCT algorithm for treatment planning dose calculation is within ±2.0%. In future studies, the authors plan to conduct a more comprehensive comparison between the existing iCBCT protocol and the pre-clinical AcurosXB iCBCT protocol and explore the performances of the advanced functions of the latter, such as MAR and eFOV.
Acknowledgments
This work was supported by Varian Medical Systems [Statement of Work: Evaluation of use of CBCT directly for dose calculations in Ethos, July 2020].
Appendix
Table A1. Parameters of different CBCT protocols available on Varian Halcyon v3.0 [26].
| CBCT Mode | Energy (kV) | Exposure (mAs) | CTDIvol (mGy) | DLP (mGy*cm) | Scan time (Sec) | Scan diameter (cm) |
|---|---|---|---|---|---|---|
| Image Gently | 80 | 84 | 1.08 | 16.3 | 16.6 | 28.2 |
| Image Gently Large | 100 | 90 | 2.38 | 35.6 | 16.6 | 38.4 |
| Head | 100 | 126 | 3.33 | 49.9 | 16.6 | 28.2 |
| Head Low Dose | 100 | 42 | 1.11 | 16.6 | 16.6 | 28.2 |
| Breast | 125 | 45 | 0.90 | 13.5 | 16.6 | 49.2 |
| Thorax Fast | 125 | 270 | 5.40 | 81.0 | 16.6 | 49.2 |
| Pelvis Fast | 125 | 560 | 11.20 | 168.0 | 21.2 | 49.2 |
| Thorax | 125 | 294 | 5.88 | 88.2 | 30.8 | 49.2 |
| Pelvis | 125 | 1080 | 21.60 | 324.0 | 36.7 | 49.2 |
| Pelvis Large Fast | 140 | 672 | 17.74 | 266.1 | 25.0 | 49.2 |
| Pelvis Large | 140 | 1440 | 38.02 | 570.2 | 40.6 | 49.2 |