

Abstract
The strong in vitro evidence that proton Relative Biological Effectiveness (RBE) varies with Linear Energy Transfer (LET) has led to an interest in applying LET within treatment planning. However, there is a lack of consensus on LET definition, Monte Carlo (MC) parameters or clinical methodology. This work aims to investigate how common variations of LET definition may affect potential clinical applications. MC simulations (GATE/GEANT4) were used to calculate absorbed dose and different types of LET for a simple Spread Out Bragg Peak (SOBP) and for four clinical PBT plans covering a range of tumour sites. Variations in the following LET calculation methods were considered: (i) averaging (dose-averaged LET (LETd) & track-averaged LET); (ii) scoring (LETd to water, to medium and to mass density); (iii) particle inclusion (LETd to all protons, to primary protons and to particles); (iv) MC settings (hit type and Maximum Step Size (MSS)). LET distributions were compared using: qualitative comparison, LET Volume Histograms (LVHs), single value criteria (maximum and mean values) and optimised LET-weighted dose models. Substantial differences were found between LET values in averaging, scoring and particle type. These differences depended on the methodology, but for one patient a difference of ∼100% was observed between the maximum LETd for all particles and maximum LETd for all protons within the brainstem in the high isodose region (4 keV μm−1 and 8 keV μm−1 respectively). An RBE model using LETd including heavier ions was found to predict substantially different LET-weighted dose compared to those using other LET definitions. In conclusion, the selection of LET definition may affect the results of clinical metrics considered in treatment planning and the results of an RBE model. The authors' advocate for the scoring of dose-averaged LET to water for primary and secondary protons using a random hit type and automated MSS.
Export citation and abstract BibTeX RIS

Original content from this work may be used under the terms of the Creative Commons Attribution 4.0 licence. Any further distribution of this work must maintain attribution to the author(s) and the title of the work, journal citation and DOI.
1. Introduction
The concept of Relative Biological Effectiveness (RBE) is applied in Proton Beam Therapy (PBT) to convert proton doses to equivalent photon doses. This conversion is required as different radiation modalities have different biological effects at matched doses and the vast majority of clinical dose-response relationships have been established for photon radiotherapy. For decades, it has been standard clinical practice within PBT to apply a constant RBE value of 1.1 to proton absorbed dose to bring biological equivalence to photons. This constant value was selected to limit complexity in response to incomplete data and to limit potential underdosing to the tumour (Paganetti et al 2019).
Parameters such as dose per fraction, Linear Energy Transfer (LET), total dose, tissue α/β, and biological endpoint have been shown to affect RBE (Paganetti, 2002; Marshall et al 2016). LET has become a particular focus as the in vitro evidence is especially strong (Paganetti, 2002) and, in principle, physical parameters can be calculated with high accuracy. Consequently, LET features in the majority of radiobiological models aiming to predict the variable RBE effect (Rorvik et al 2018). However, these models suffer from the large uncertainties in in vitro data (Paganetti, 2019) and there is currently no method to validate these models in vivo. Despite these uncertainties, there is a growing opinion in the clinical PBT community that LET should be considered during the treatment planning process. How this should be performed remains up for debate, but proposed solutions and methods used to study LET in the literature include simple qualitative checks (Fjæra et al 2017), LET Volume Histograms (LVHs) (Grassberger et al 2011; Fjæra et al 2017; Underwood et al 2018), single value LET/dose criteria (Grassberger et al 2011; Sethi et al 2014; Traneus and Ödén, 2018) and the full use of an RBE model (Carabe et al 2013; Gutierrez et al 2019; Smith et al 2019).
As well as variation in how LET distributions are analysed as part of the treatment planning process, there is also substantial methodological variation in the calculation of LET values. Previous work has investigated the impact of varying MC parameters such as secondary production threshold and voxel size (Cortés-Giraldo and Carabe, 2015; Granville and Sawakuchi, 2015). However, the existing literature does not cover all common differences between MC LET calculation methods, such as variations in the exact scoring methodology or the types of particles included. Here we comprehensively explore this topic and consider the impact of LET definition on clinical plan analyses.
Recently Kalholm et al (Kalholm et al 2021) elegantly demonstrated that a wide range of different LET definitions is in use within the proton community. A significant proportion of this variation results from the practical issues associated with applying the concept of LET to radiobiological experiments or radiotherapy treatment plans. In ICRU report 85a (Seltzer et al 2011), LET is well-defined: it is calculated at a point, for a specific material, for charged particles of a given type and energy. However, in a treatment plan, parameters are defined in a voxelated geometry and thus a single LET value must be derived from a group of particles of varying quality. The most common methods to acquire a single value are dose-averaging (LETd) - and track-averaging (LETt). Both LETd and LETt are used in PBT RBE models (McNamara et al 2015; Smith et al 2019) and in the search for in vivo evidence of RBE (Peeler et al 2016; Underwood et al 2018; Eulitz et al 2019b; Wang et al 2020).
There are also variable approaches to handling the multiple particle types which may exist within a voxel. Within the literature, some groups have scored LET for primary protons only (Wilkens and Oelfke, 2003; Guan et al 2015), whereas others have also included secondary protons in their LET scoring (Sanchez-Parcerisa et al 2016). Additionally, there is a wider discussion in the PBT community on whether LET scoring should consider non-proton secondary particles created by nuclear interactions (Paganetti, 2002; Grassberger and Paganetti, 2011; Petringa et al 2020). These secondary particles contribute a small amount of dose compared to primary protons but their contributions to LET distributions can be substantial (Grassberger and Paganetti, 2011).
Further discrepancies between groups arise over LET calculation medium. This variation is part of a long-standing debate within PBT (Paganetti, 2009) and, in fact, the wider radiotherapy community, on whether the clinical standard of dose to water should be replaced with dose to medium (Liu et al 2002; Ma and Li, 2011). The debate includes questions relating to: accuracy, convention and biological effect. Currently, there is no clinical consensus on whether LET to water or LET to medium should be considered. In line with mass stopping power, calculations of: LET to medium, divided by mass density, ( 'LET in unit density tissue') are also performed by some groups (Grassberger and Paganetti, 2011; Giantsoudi et al 2013). It has been shown that the difference between LET to water and LET to medium may significantly affect RBE data (Tan et al 2019). Despite differences in units for these scoring types (e.g. keV/μm versus [keV/μm]/[g/cm3]), these are often used interchangeably.
Finally, Monte Carlo simulations of LET require certain input parameters to be set, such as a physics list and production cuts on secondary particles (Winterhalter et al 2020). The defaults and typical choices for these parameters vary across MC codes and versions. One parameter which varies between LET scorers is 'hit type'. 'Hit type' refers to where information is stored along each particle's step in the simulation. For example, a hit type of 'random', a common default, means that energy is deposited at a random position along the particle's step. This contrasts to hit types of 'pre', 'mid' and 'post' where the energy is deposited at the start, middle and end of the particle's step, respectively. The Maximum Step Size (MSS) may also be explicitly defined in a simulation instead of using the MC code's automated selection. Little discussion exists in the literature on the effects of these different scoring options upon LET (Guan et al 2015).
If the use of LET in clinical proton therapy is to become widespread it is important to understand options available in LET calculations and the impact that various methodological choices can make. This work aims to investigate how the major variations in LET methodology may affect potential clinical application. The forms of LET considered in this work are as follows:
- –LETd and LETt.
- –LETd scored to primary protons, all protons and particles.
- –LETd scored to water, to medium, and to medium with a mass-density normalisation then applied.
- –LETd scored with a post hit type setting and a random step hit type setting, with and without a set MSS.
2. Method
2.1. Monte Carlo simulations
We consider two scenarios: (i) Simulation of a Spread-Out Bragg Peak (SOBP) field delivered to a homogeneous phantom, and (ii) simulation of a series of clinical plans calculated for patient CT scans.
For the SOBP, absorbed dose and different flavours of LET were obtained via MC simulations using GATE (Jan et al. 2004, 2011; Sarrut et al 2014) (vEAKS01) / GEANT4 (Agostinelli et al 2003; Allison et al 2016) (v10.3.3). GATE (vEAKS01) is an in-house version of GATE (v8.1, same version as used in GATE-RTion(Grevillot et al 2020)) modified to allow the step hit type to be changed for the LET actor. In GATE (v8.1), this step hit type is hardcoded to a 'post' hit type. The SOBP was comprised of 10 spots with minimum and maximum proton energies of 127.5 MeV and 150 MeV, respectively. The spots have dimensions of 3 mm (sigX and sigY of a gaussian lateral profile). The medium was a homogeneous material (water, bone or brain tissue). Absorbed dose and various LET options were scored in 2 mm slabs sliced perpendicular to the beam. 107 histories were run for each SOBP.
For the patient cases, absorbed dose and the different types of LET were obtained using AUTOMC (Aitkenhead et al 2020) (vES01), a piece of software that performs independent MC dose calculations for plan quality assurance. The software operates by generating the files required for GATE MC simulations from the plan DICOM data and driving the GATE (vEAKS01) / GEANT4 (v10.3.3) environment. For simulations within the patient anatomy, LET and dose were scored in a 2 mm grid with the number of histories selected to achieve an approximate uncertainty of 1.2% GYRBE = 1.1 within the high dose region (Chetty et al 2006). A clinical beam model for the Varian ProBeam delivery system was used for simulation on patient anatomy.
All simulations settings were chosen to closely match clinical AUTOMC settings as these had undergone substantial validation (Aitkenhead et al 2020). For electrons, a production cut of 5 mm was selected inside the MC world while a cut of 0.1 mm was applied inside the CT image or tank. 'QGSP_BIC' was the selected physics list for both the 1D SOBP and patient simulations. The human material compositions in the tank and patient simulations were taken from ICRP 110 (ICRP, 2009). Ionisation values for elements were selected as described in (Aitkenhead et al 2020). The AAPM TG 268 report for reporting MC radiation transport studies was followed in this paper. (Sechopoulos et al 2018). The output from AUTOMC and GATE was processed using Python (v3.6) and the following python packages: NumPy (Harris et al 2020) (v1.18.1), SciPy (v1.4.1), Suspect (edited v0.3.9), Nibabel (v3.0.0) and PyDicom (v1.3.0).
2.2. Scoring parameters
2.2.1. Absorbed dose
Absorbed dose to medium was calculated using the in-built scorer within GATE while absorbed dose to water was calculated using the method of (Paganetti, 2009) for converting dose to medium to dose to water in PBT.
2.2.2. LET
The LET scorer within GATE was used to obtain different LET distributions. This scorer uses the GEANT4 method 'GetElectronicStoppingPowerDEDX' where a lookup is performed using the particle's energy to find electronic stopping power (Cortés-Giraldo and Carabe, 2015; Granville and Sawakuchi, 2015). In this work, our default definition of LET is dose-averaged LET (LETd) scored to water for primary and secondary protons with a random step hit type and automated MSS. If a change is not explicitly stated, the default setting is applied.
The different LET definitions we consider (shown in table 1) stem from the definition of LET in ICRU report 85a (Seltzer et al 2011). Here, unrestricted LET is defined as, dE, the mean energy lost by the charged particles due to electronic interactions in traversing a distance, dl:
Table 1. Different LET definitions in categories of averaging, particle inclusion, scoring and hit type/max step size are shown.
| LET Type | Calculation Technique |
| Dose-Averaged LET, LETd | Using equation (1), the LET from each particle is weighted with respect to its contribution to local dose in each voxel, obtaining equation (2): |
 | |
Where  is the total number of particles within the voxel and is the total number of particles within the voxel and  is the ith particle. is the ith particle. | |
| Track-averaged LET, LETt | Using equation (1), the LET from each particle is weighted with respect to its step length in each voxel, obtaining equation (2): |
 | |
| LETt is also known as fluence-averaged LET. | |
| LETd for Primary Protons and Secondary Protons, LETd,pro | Only protons are included within equation (2). This was implemented in GATE using a particle filter for protons. |
| LETd for Primary Protons, LETd,prim | Only primary protons are included within using equation (2). This was implemented in GATE using a particle filter for protons with a track ID of 1. |
| LETd for Particles, LETd,part | All hadronic particles with a Z between 1 and 8 are included within the equation (2). This was implemented in GATE by applying a series of particle filters from Z = 1 to Z = 8. It should be noted that as GATE (v8.1) is unable to score LETd,part to water but only to medium. LETd,pro and LETd,prim were also scored to medium for comparison. |
| LETd to Water, LETd,wat | The proton energy at the pre-step point is used in a lookup table to acquire the stopping power in water, regardless of the material composition in the voxel. |
| LETd to Medium, LETd,med | The proton energy at the pre-step point is used in a lookup table to acquire the electronic stopping power of the material composition in the voxel. |
| LETd to Mass Density, LETd,mass | LETd,med is divided by the physical density in the voxel. The physical density is derived during the stoichiometric CT calibration when the scanner parametrisation is applied to the ICRP110 references tissues. This gives LETd,mass units of keV μm−1 g−1 cm3 instead of keV μm−1 as for the other forms of LET. |
| LETd with Random Hit Type, LETd,ran | LETd is scored using the 'random' hit type and using the automated MSS within GATE/GEANT4 . |
| LETd with Post Hit Type, LETd,post | LETd is scored using the 'post' hit type and using the automated MSS within GATE/GEANT4 . |
| LETd with Random Hit Type and MSS , LETd,ran,mss | LETd scored with a 'random' hit type and a selected MSS of 0.5 cm |
| LETd with Post Hit Type and MSS, LETd,post, mss | LETd scored with a 'post' hit type and a selected MSS of 0.5 cm |
2.3. Patient data and consent
Four patients are presented in this work, with a single case for ependymoma, nasopharynx, Ewing's sarcoma and a phase 2 treatment of a whole CNS case. This phase was chosen as the brainstem was at risk of elevated LET values.
The PBT plans presented in this work are from patients previously treated with the Proton Therapy Centre. All plans were generated according to clinical protocols and underwent appropriate patient-specific QA.
2.4. Clinical comparison methods
2.4.1. Qualitative comparison
Clinical plans were qualitatively examined within the ≥2% dose region (relative to maximum dose). Colour bar windowing was set individually for each map as this is likely how the distributions would be reviewed clinically.
2.4.2. LET volume histograms (LVHs)
LET Volume Histograms (LVHs) were generated for the different forms of LET for the Planned Target Volume (PTV) and a selected Organ At Risk (OAR) for each clinical case. Only LET values within the ≥2% dose contour (relative to the maximum dose) were defined in the LVH. For this reason, LVHs, where OARs are partially covered with the ≥2% dose contour, do not show 100% of the volume covered by any LET value.
2.4.3. Single value criteria
Maximum and mean values of LET within a range of isodose regions were compared between the different forms of LET. Isodose regions from ≥2% to ≥80% of the maximum absorbed dose in the plan were calculated in 2% increments.
2.4.4. LET-weighted dose
Several authors (Unkelbach et al 2016; McMahon et al 2018; Paganetti, 2019; Smith et al 2019) have applied a simple, linear LET-weighted dose model to calculate RBE-weighted dose:

where Dosew is the LET-weighted dose, D is the proton absorbed dose, LET is the LET input and κ is a fitting parameter.
Here, we use this model to compare the different LET definitions by deriving a specific κ for each definition. Each κ value was derived by assuming an RBE of 1.1 for the initial part of the SOBP in brain. The slabs within the SOBP region were selected so that they are within 1% dose and 1 keV μm−1 of each other. Thus, in fitting κ for each LET definition, we assigned an RBE of 1.1 to a region with relatively homogenous absorbed dose and LET values. Concerns over elevated RBE in clinical PBT are primarily related to end of range effects, it is usually assumed that an RBE of 1.1 is reasonable for the initial portion of a SOBP (Paganetti, 2019). A similar method was applied in (Unkelbach et al 2016)
The python package 'SciPy.minimize' (v1.4.1) was used to find the optimum κ value for each LET definition in averaging, scoring and particle groups to obtain the same dose as RBE =1.1 in the initial portion of the SOBP using equation 3.
3. Results
3.1. 1D SOBP
Figure 1 shows absorbed dose and the various forms of LET scored in 2 mm slabs for a SOBP, in a tank geometry. Figure 1(B) shows LETd and LETt versus depth in water. (Kempe et al 2006)The two averaging methods give similar results in the entrance region, but differences appear in the SOBP region, reaching a maximum at the end of range. These higher values for LETd are driven by high LET particles delivering more dose than low LET particles.
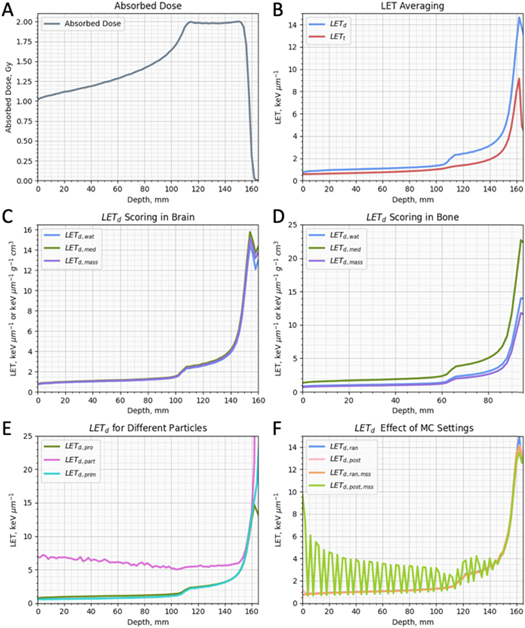
Figure 1. An example proton 1D SOBP in a tank geometry with a maximum energy of 150 MeV. Panels show absorbed dose in water(A), dose-averaged LET (LETd) and track-averaged LET in water (B), LETd scored for water, medium and mass density scored in brain tissue (C), LETd scored for water, medium and mass density scored in bone tissue (D), LETd for primary protons only, primary and secondary protons only and particles in water (E) and LETd scored for random and post hit type with and without a max step size of 0.5 cm in water (F).
Download figure:
Standard image High-resolution imageFigures 1(C) and 1(D) show LETd,wat, LETd,med and LETd,mass in brain and bone, respectively. For brain, the differences between the three scoring options are minimal since water and brain tissue are similar in characteristics of physical density and Z composition. However, differences between these scoring options become particularly relevant when bone is considered due to dissimilar physical density and Z composition. While LETd,wat and LETd,mass deliver similar values in bone except at the end of range, LETd, med is higher at all depths.
Figure 1(E) shows LETd,prim, LETd,pro and LETd,part scored versus depth in water. Both LETd,prim and LETd,pro are similar, with LETd,pro values very slightly higher in the entrance region. LETd,part meanwhile is substantially higher within the entrance region as this is where the majority of nuclear fragments are created. LETd,part also reaches higher values at the end of range, due to its background of heavier nuclei fragments (few primary protons remain).
Figure 1(F) shows LETd,ran, LETd, post, LETd, mss and LETd, post mss scored at depth in water. LETd, ran, LETd, post and LETd, mss obtain virtually identical results. However, the values for LETd, post mss are very different from the other hit types. Large fluctuations are seen in the result with the amplitude of this artefact at a maximum in the entrance before decreasing towards the end of the SOBP. Changing the value of MSS changes the amplitude and frequency of the artefact with smaller values leading to a smaller artefact.
3.2. Effect of different LET averaging
Figure 2 shows maps of contours, absorbed dose, LETd and LETt as well as associated LVHs and single values graphs calculated for Patient 1 (ependymoma). Similar results in the clinical metrics were seen for the 3 other patient sites (Results are shown in supplementary materials (available online at stacks.iop.org/BPEX/8/015024/mmedia)).

Figure 2. Contours (A), absorbed dose (B), dose-averaged LET (LETd) (C), track-averaged LET (LETt) (D), LET Volume Histograms (LVH) PTV (E), LVH brainstem (F) and single value (maximum and mean) (G) for the brainstem for patient 1. (A) Contours show PTV in dark red with the brainstem shown in a white contour. (B), (C), (D) Maps are windowed to 2% of the maximum dose. (E)–(G) LETd and LETt are shown by blue and red lines, respectively. (G) Dashed lines show max values for varying isodose regions, solid lines show mean values for varying isodose regions.
Download figure:
Standard image High-resolution image3.2.1. Qualitative comparison
In the LET maps shown in figures 2(C)–(D), the LETd and LETt distributions appear broadly similar. The regions of elevated LET values appear in the same anatomical positions with no visible differences occurring at tissue junctions. The elevated regions may appear brighter in the LETd maps than the LETt since LETd obtains greater maximum values with similar minimum values. This relationship is demonstrated in figure 1(B).
3.2.2. LVHs
The LVHs in figures 2(E)–(F) show that in either the PTV or selected critical OAR (brainstem), LETd values are greater than LETt values, with an approximate difference of 1 keV μm−1 to 100% of the volume. This difference increases as smaller fractions of the volume are considered, rising to a maximum difference of approximately 2–3 keV μm−1 in peak LET. For patient 1, these differences reached a maximum in the highest LET values within the brainstem, where ∼3 keV μm−1 and ∼6 keV μm−1 were calculated for LETt and LETd respectively.
3.2.3. Single values (Maximum & Mean)
The maximum and mean values for LETd and LETt in figure 2(G) are substantially different with the largest difference found between these LET definitions than the other definition groups. Generally, the difference was constant across the isodose regions with a difference of 2–3 keV μm−1 for maximum values and 1–1.5 keV μm−1 for mean values.
3.3. Effect of different LET scoring
Figure 3 shows maps of contours, absorbed dose, LETd,wat , LETd,mass and LETd,med as well as associated LVHs and single values graphs calculated for Patient 2 (naso-cavity). Similar results in the clinical metrics were seen for the other patient sites unless specified (additional patient results are shown in supplementary materials). It should be noted that LETd,mass, LETd,med and LETd,wat are quantities with different units. However, these definitions are often used interchangeably in radiobiological data (Tan et al 2019).

Figure 3. Contours (A), absorbed dose (B), dose-averaged LET scored to water (LETd,wat) (C), dose-averaged LET scored to mass density (LETd,mass) (D), dose-averaged LET scored to medium (LETd,med) (E), LET Volume Histograms (LVH) PTV (F), LVH temporal lobe (left) (G) and single value (maximum and mean) for the temporal lobe (left) (H) for patient 2. (A) Contours show PTV in dark red with the brainstem shown in a white contour. (B), (C), (D), (E) Maps are windowed to 2% of the maximum dose. (F), (G), (H) LETd,wat , LETd,mass and LETd,med are shown by blue, purple and green lines, respectively. (H) Dashed lines show max values for varying isodose regions, solid lines show mean values for varying isodose regions.
Download figure:
Standard image High-resolution image3.3.1. Qualitative comparison
There are clear differences between the distributions of the three scoring options (figures 3(C)–(E)). LETd, wat and LETd, mass have substantially larger values in air cavities compared to LETd, med . This is reversed in bone, where LETd, med reaches greater values.
3.3.2. LVHs
Figures 3(F)–(G) shows the differences discussed in the qualitative comparison clearly in both the LVHs for PTV and OAR (Temporal Lobe (left)). In both LVHs, LETd,med shows significant differences to the other two scorings. These differences emerge when voxel materials differ substantially from water. For the PTV LVH, the percentage of volume covered by a minimum of 2 keV μm−1 is substantially reduced when scored to medium. This is caused by a non-negligible volume of the low density (air-filled) naso-cavity being including within the PTV. The left temporal lobe LVH demonstrates the opposite situation: greater values are evident when LET to medium is scored. This is caused by the inferior part of the lobe including simulation voxels which contain both brain and bone tissue (due to the simulation grid having a lower resolution than the CT grid). This mixture of brain and bone tissues increases the density and thus leads to greater LETd values when scored to medium. These differences were smaller in the other 3 patients.
3.3.3. Single values (Maximum & Mean)
3.4. Effect of different particle inclusion on LETd
Figure 4 shows maps of contours, absorbed dose, LETd,pro, LETd,prim and LETd,part as well as associated LVHs and single values graphs calculated for Patient 3 (phase 2 treatment of whole CNS). Similar results in the clinical metrics were seen for the 3 other patient sites unless specified (additional patient results are shown in supplementary materials).

Figure 4. Contours (A), absorbed dose (B), dose-averaged LET for all protons(LETd,pro) (C), dose-averaged LET for primary protons (LETd,prim) (D), dose-averaged LET scored for particles (LETd,part) (E), LET Volume Histograms (LVH) PTV (F), LVH brainstem (G) and single value (maximum and mean) for the temporal lobe (left) (H) for patient 3. (A) Contours show PTV in dark red with the brainstem shown in a white contour. (B), (C), (D), (E) Maps are windowed to 2% of the maximum dose. (F), (G), (H) LETd,pro , LETd,prim and LETd,part are shown by green, turquoise and pink lines, respectively. (H) Dashed lines show max values for varying isodose regions, solid lines show mean values for varying isodose regions.
Download figure:
Standard image High-resolution image3.4.1. Qualitative comparison
In figures 4(C)–(E), there are clear differences between the distributions of the three particle options. While LETd,pro and LETd,prim are similar, LETd,part is greater throughout the anatomy and its distribution is more difficult to interpret. In the LETd,part colour wash, the viewer's eye is drawn to high maximum LET values stemming from single particles, in regions of low dose (this colour wash is sensitive to dose thresholding, here a threshold of 2% of the maximum dose is considered). This is expected as low energy nuclear fragments created by proton beams can have much greater LET values than protons. If windowed further, the distribution still appears flatter than the other particles scorings, with the elevated regions less clear.
3.4.2. LVHs
The LVHS for the PTV and the brainstem are shown in figures 4(F)–(G). For the proton scorings, LETd,pro is either equal to or slightly greater than LETd,prim. This is expected as the inclusion of lower energy secondary protons increases LETd. LETd,part is substantially greater for all voxels within the PTVs and OARs.
3.4.3. Single values (Maximum & Mean)
For particle type, LETd,pro and LETd,prim obtain very similar results for both maximum and mean values across the isodose regions. However, LETd,part shows large differences in comparison to LETd,pro and LETd,prim. For mean values, this difference is approximately 2–3 keV μm−1 across all isodose regions. For maximum values, this difference reaches 5 keV μm−1 in the lower isodose regions before reducing to approximately 2 keV μm−1 in the high isodose regions.
3.5. Effect of hit type and maximum step size setting on LETd
Figure 5 shows maps of contours, absorbed dose, LETd,ran and LETd,post as well as associated LVHs and single values graphs for LETd,ran, LETd,post , LETd,ran,mss and LETd,post,mss for Patient 4 (pelvic sarcoma). Similar results in the clinical metrics were seen for the 3 other patient sites unless specified (results are shown in supplementary materials).
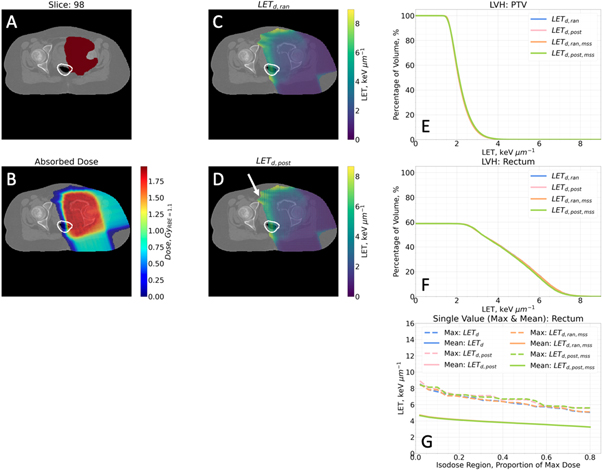
Figure 5. Contours (A), absorbed dose (B), dose-averaged LET with a random hit type setting (LETd, ran) (C), dose-averaged LET with a post hit type setting (LETd, post) (D), LET Volume Histograms (LVH) PTV (E), LVH brainstem (F) and single value (maximum and mean) (G) for the brainstem for patient 4. (A) Contours show PTV in dark red with the brainstem shown in a white contour. (B), (C), (D) Maps are windowed to 2% of the maximum dose. (D) White arrow shows especially large grid artefact. (E), (F), (G) LETd,ran, LETd,post, LETd,ran,mss and LETd,post,mss are shown by blue, light pink, orange and green lines, respectively. (G) Dashed lines show max values for varying isodose regions, solid lines show mean values for varying isodose regions.
Download figure:
Standard image High-resolution image3.5.1. Qualitative comparison
The LETd,ran and LETd,post maps in figures 5(C)–(D) are largely similar with the same areas highlighted in the distributions. However, LETd,post shows a grid artefact running throughout the whole distribution (the white arrow highlights the especially visible area). The grid artefact was found to reduce in magnitude and grid spacing if the MSS was decreased but at a cost of increased simulation time. This artefact is not visible in the three other patients analysed for this study, but it has been observed by the authors in other cases.
The maps for LETd,ran,mss and LETd,post,mss (not shown) matched their respective hit type with automated MSS.
3.5.2. LVHs
All LET types for hit types and MSS Settings in figures 5(E)–(F) exhibit similar values in the LVHs for all PTVs and selected OARs.
3.5.3. Single values (Maximum & Mean)
In figure 5(G), mean values for all hit type and MSS combinations appear identical. However, the effect of the hit type can be seen on the maximum values with LETd,post,mss and LETd,post,mss slightly raised in isodose regions.
3.6. LET-weighted dose and  optimisation

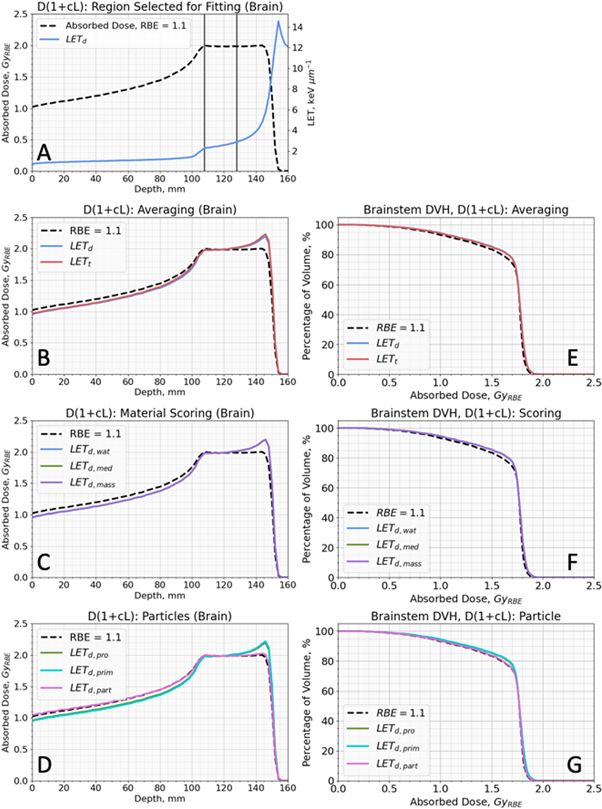
Figure 6. A shows the SOBP region selected to fit  in equation (4) for the different LET definitions (method explained in section 2.4.4). Figures 6(B)–(D) shows results from fitting
  in equation (4) for each LET definition and figures 6(E)–(G) show DVHs for the brainstem of patient 1 calculated using equation (4) for each LET definition and accompanying
  value (table 2).
Figure 6. (A) Spread Out Bragg Peak (SOBP) absorbed dose and LETd with the defined region for LET-weighted dose optimisation. (B)–(D) show optimised LET-weighted dose for different LET definitions on a SOBP in brain tissue. (E), (F) and (F) show DVHs for optimised LET-weighted dose for different LET definitions of the brainstem for patient 1. (A)–(G) show doseRBE=1.1 via a black dashed line. (A) shows regions of SOBP used to optimise  for different LET definitions via two horizontal lines in slate grey. (B), (E) show LETd and LETt with blue and red lines, respectively. (C), (F) show LETd,wat , LETd,mass and LETd,med with blue, purple and green lines, respectively. (D), (G) show LETd,pro , LETd,prim and LETd,part with green, turquoise and pink lines, respectively.
Download figure:
Standard image High-resolution image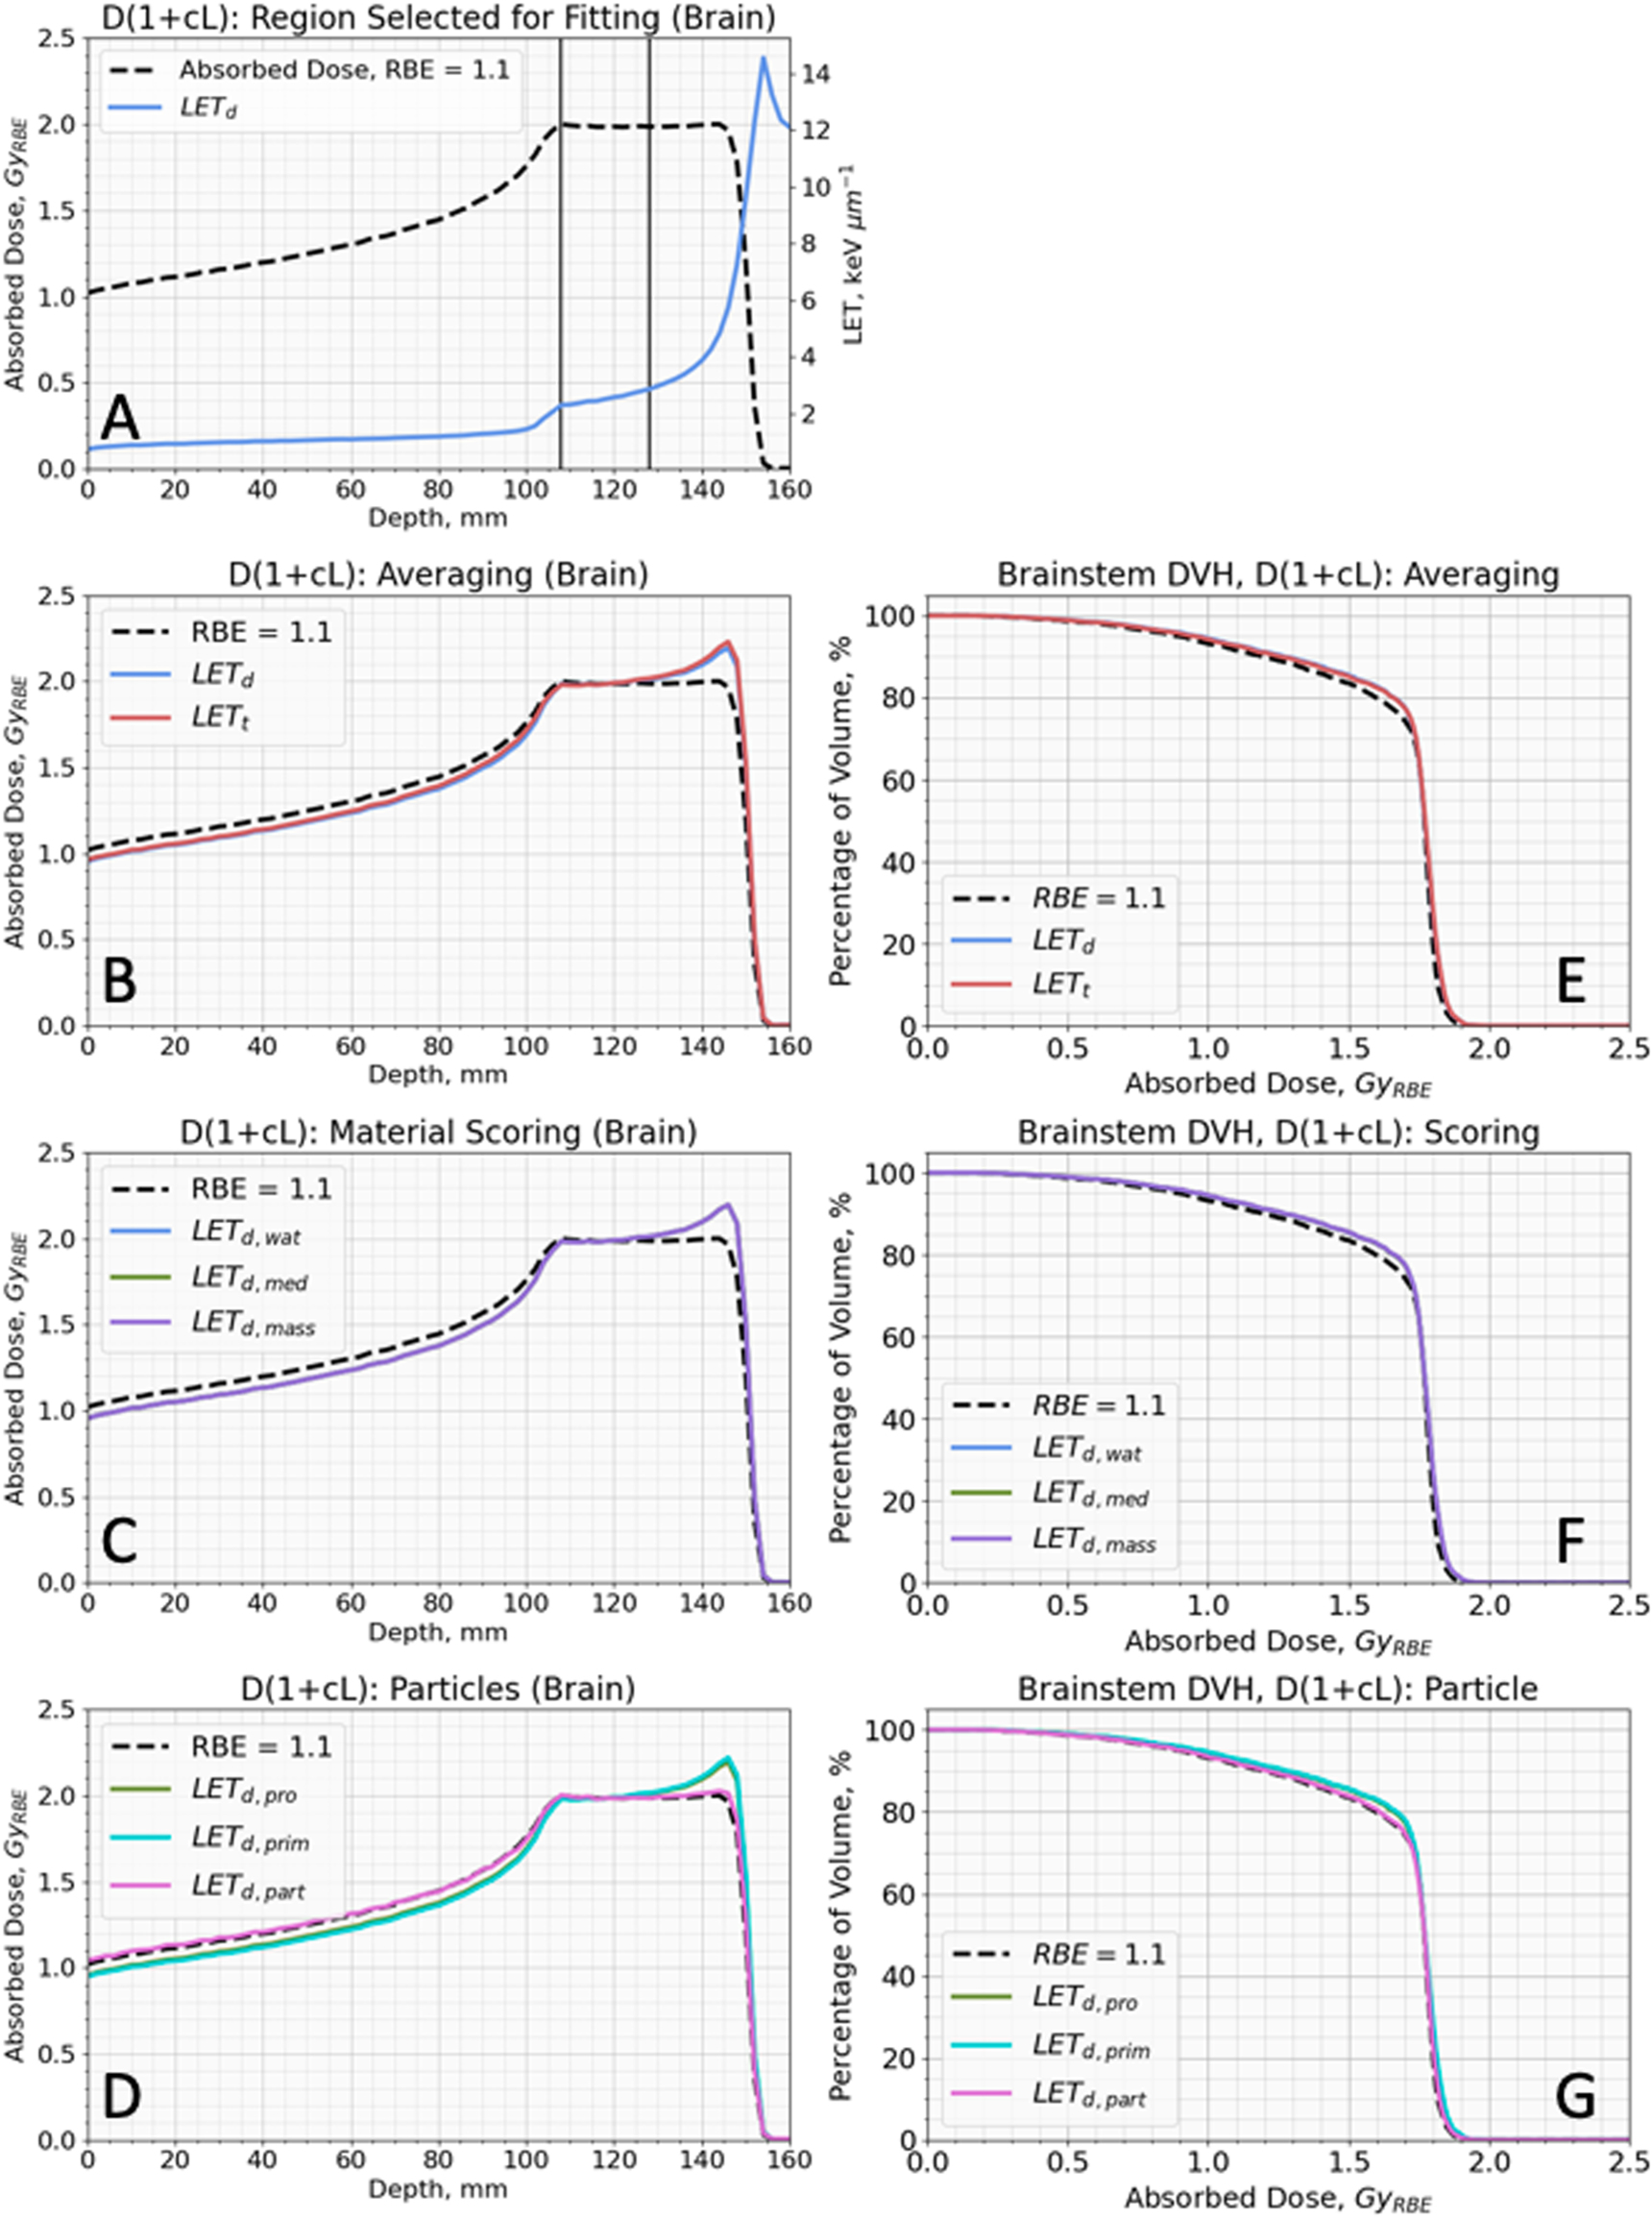
Table 2. Optimised  for equation (4) for various LET definitions are shown.
  values were optimised for their respective LET so equation (4) matched DoseRBE=1.1 in the initial proportion of an SOBP in brain tissue. The chosen proportion of SOBP was selected as to not deviate more than 1% in dose and less than 1 keV μm−1 in LET.
| LET definition | Optimised  value value |
 value relative to the default setting value relative to the default setting |
|---|---|---|
| LETd (default setting) | 0.040 μm keV−1 | 1.000 |
| LETt | 0.069 μm keV−1 | 1.725 |
| LETd,prim | 0.040 μm keV−1 | 1.000 |
| LETd,part | 0.018 μm keV−1 | 0.450 |
| LETd,mass | 0.039 μm keV−1 g1 cm−3 | 0.975 |
| LETd,med | 0.037 μm keV−1 | 0.925 |
The  values generated in the fitting process are shown in table 2. All
  values had associated R2 > 0.99 in matching to DoseRBE = 1.1 in the region defined in figure 6(A) when applied equation (4) with their corresponding LET definition. Our default setting LETd and LETd,prim obtained the same fitted
  value of 0.040 keV μm−1 which is similar to the values of 0.039 keV μm−1 g−1 cm3 and 0.037 keV μm−1 obtained by LETd,mass and LETd,med. Relative to our default, a
  value 55% lower was obtained for LETd,part and a
  value 72.5% higher was obtained for LETt.
When paired LET definitions and  values were applied, all LET definitions, except LETd,part, resulted in similar RBE-weighted dose in both the SOBP (figures 6(B)–(D)) and in the brainstem of Patient 1 (ependymoma case). Equation (4) using LETd,part and its associated
  from table 2 leads to practically no increase in dose at the end of the SOBP and in the brainstem of Patient 1 compared to doserbe = 1.1. This is due to the greater homogeneity in the LETd,part compared to the other LET definitions.
Similar results to those in figures 6(E)–(G) were seen in the selected OARs for the other 3 patients. This work was repeated with the SOBP in bone and the same pattern of relative results was observed for different LET definitions. Different  values were obtained but LET definitions again matched each other besides LETd,part.
4. Discussion
Variable RBE remains a concern within the PBT community and consequently, there is considerable interest in how LET should be incorporated into treatment planning. Currently, there is no consensus on how LET should be defined, calculated, or used to inform clinical decisions. There is much variation in the literature regarding LET formulation (Hahn et al 2021; Kalholm et al 2021)(Kalholm et al 2021) and the use of LET in treatment planning studies. It is important we understand how LET definitions differ in potential clinical application. Consensus will be important as we strive to collaborate and interpret results from different institutions.
In this work, LET was simulated for clinical PBT plans using a range of common methodologies and the impact of changing the LET definition was assessed using potential clinical metrics. This carries the work by others such as (Kempe et al 2006; Grzanka et al 2018) further by studying the differences of LET in the common metrics used to judge treatment planning quality. Our results highlight the need for careful understanding/selection of LET definition and chosen clinical metric. Substantial differences were found between LET values simulated using different methods for averaging or scoring and filters for particle type with variation across chosen metric. For instance, LETd and LETt differed substantially in LVH (figure 2) but produced similar results for optimised LET-weighted dose (figure 6). The results presented in this paper also highlight the contribution of non-proton particles to the LET distribution occurring in clinical PBT treatments. In many cases, it is typical for only protons to be included in LET values quoted in experimental radiobiological studies, ignoring the LET contributions from heavier nuclei such as alpha particles. However, some studies do quote LET values encompassing all particles and while these heavier particles contribute a small amount to the absorbed dose, they have much greater LET values and so can make substantial contributions to LET distributions (Kalholm et al 2021). The results in this paper demonstrate that there are substantial differences between LET calculated for different particles in potential clinical metrics, which are not removed after applying within an optimised RBE model.
If LET is to be combined with dose in clinical practice, having a reliable process for physical verification of both absorbed dose and LET would be desirable. However, this is complicated by the fact that LET is not a measurable parameter by definition, and instead requires the measurement of some other microdosimetric parameter (such as lineal energy (Newpower et al 2019)) as a surrogate. In the current paper we focus only on the implications of the issues relating to the calculation, rather than measurement, of LET.
It is difficult to state a recommended LET definition as this should depend on use and rely on significant clinical data on biological effect. While this data is growing (Peeler et al 2016; Underwood et al 2018; Eulitz et al 2019a; Bahn et al 2020; Wang et al 2020), more is required. However, careful consideration of each component of the definition may lead to a preference in the community.
In the averaging component, LETd is largely chosen instead of LETt for both radiobiological and patient applications. This is usually justified by evidence suggesting LETd fits radiobiological data better than LETt (Grün et al 2018). This has theoretical support when considering a high LET particle will deliver more dose locally than a low LET particle and thus contribute more to the biological effect (McMahon et al 2018). As has been demonstrated elsewhere (Kempe et al 2006), the former is consistently higher than the latter.
For particle type, it follows that secondary protons should be included along with primary protons in the LET value to remain consistent with dose calculation in PBT. Clinical PBT TPSs include secondary protons when calculating dose to avoid dose underestimation by up to 15% (Farr et al 2021). The question of including other ions in the LET value is less clear. As shown in figure 1(E), heavier particles also make a significant contribution to the LETd distribution but particles resulting from target fragmentation have a very low dose contribution (Grassberger and Paganetti, 2011; Grün et al 2018). It is also difficult to justify including particles of different types in a single LET value as different particles at the same LET are known to have a different biological effect (Belli et al 1998). Further to this, figure 3(E) demonstrates how the comparatively homogenous distribution in LETd,part masks the elevated regions of LET seen in proton LET which leads to practically no increase in RBE-weighted dose increase when using the LET-weighted dose model (shown in figure 6). However, further work in measuring the biological effect of heavier ions in a proton beam is required before a definite statement can be made.
For LET scoring, the choice should be consistent with which material dose is scored to. Combining dose and LET with a different scoring method would cause inconsistency in units. Currently, most centres use dose to water as this is the standard dose calculated in PBT TPSs.
For hit type and MSS, a hit type of random and automated MSS should be applied. Using a post hit type is incorrect when using a condensed history algorithm as this would suggest zero energy loss along a step. The selection of a post hit type causes the unphysical grid artefact in figure 4(D) and the spikes in LET in figure 1(F) when combined with an MSS.
On this basis, the authors advocate the calculation of dose-averaged LET scored to water for primary and secondary proton (broadly consistent with most proton RBE models such as that proposed by (McNamara et al 2015)) with a random hit type and automated MSS.
5. Conclusion
This study has shown how the selection of LET definition may affect the results of different clinical metrics considered in treatment planning as well as the output of RBE models. We believe that this work can contribute to the discussion regarding consensus and standardisation of LET for clinical PBT. A common framework for reporting LET will be desirable as we attempt to link variable RBE to outcome in clinical trials. For this purpose, we advocate the scoring of dose-averaged LET to water for primary and secondary protons using a random hit type and automated maximum step size.
Acknowledgments
The authors are grateful for the computation support by Ian Porter, computation time on the proton therapy development cluster and clinical support by Matthew Clarke at The Christie hospital. We also acknowledge the support of Andreas F. Resch and the wider GATE community for support in using GATE. The authors also thank Ben Rowland for providing python code that aided data processing.
This research was funded from the European Union's Horizon 2020 research and innovation programme under grant agreement number [INSPIRE 730983]; the Engineering and Physical Sciences Research Council (Grand Challenge Network + in Proton Therapy) [grant number EP/N027167/1]; the Engineering and Physical Sciences Research Council (BioProton) [grant number EP/S024344/1); the Science and Technology Facilities Council (Global Challenge Network + in Advanced Radiotherapy) [grant number ST/N002423/1]; the Christie Charitable Fund and co-funded by the NIHR Manchester Biomedical Research Centre.
Data availability statement
The data that support the findings of this study are available upon reasonable request from the authors.