


Abstract
Introduction. Event-related desynchronization (ERD) is used in brain-computer interfaces (BCI) to detect the user's motor intention (MI) and convert it into a command for an actuator to provide sensory feedback or mobility, for example by means of functional electrical stimulation (FES). Recent studies have proposed to evoke the nociceptive withdrawal reflex (NWR) using FES, in order to evoke synergistic movements of the lower limb and to facilitate the gait rehabilitation of stroke patients. The use of NWR to provide sensorimotor feedback in ERD-based BCI is novel; thererfore, the conditioning effect that nociceptive stimuli might have on MI is still unknown. Objetive. To assess the ERD produced during the MI after FES-evoked NWR, in order to evaluate if nociceptive stimuli condition subsequent ERDs. Methods. Data from 528 electroencephalography trials of 8 healthy volunteers were recorded and analyzed. Volunteers used an ERD-based BCI, which provided two types of feedback: intrisic by the FES-evoked NWR and extrinsic by virtual reality. The electromyogram of the tibialis anterior muscle was also recorded. The main outcome variables were the normalized root mean square of the evoked electromyogram (RMSnorm), the average electroencephalogram amplitude at the ERD frequency during MI ( ) and the percentage decrease of
  relative to rest (
 ) at the first MI subsequent to the activation of the BCI. Results. No evidence of changes of the RMSnorm on both the
  (p = 0.663) and the
  (p = 0.252) of the subsequent MI was detected. A main effect of the type of feedback was found in the subsequent
  (p < 0.001), with intrinsic feedback resulting in a larger
  Conclusions. No evidence of ERD conditioning was observed using BCI feedback based on FES-evoked NWR . Significance. FES-evoked NWR could constitute a potential feedback modality in an ERD-based BCI to facilitate motor recovery of stroke people.
Export citation and abstract BibTeX RIS
1. Introduction
Hemiplegia or hemiparesis are typical consequences of stroke and lead to lower limb motor impairments such as foot drop [1]. Although motility may be affected, stroke survivors can still perform motor intents (MI) in response to a movement cue, producing the desynchronization of their brain's sensorimotor rhythms (mu: 8 to 12 Hz and beta: 18 to 30 Hz) [2]. This phenomenon is called event-related desynchronization (ERD) and its temporal and spectral behaviours during MI in post-stroke patients have been described [3, 4].
ERD can be used in brain-computer interfaces (BCI) to detect the user's MI [5, 6]. An ERD-based BCI is a closed-loop system that records the electroencephalogram (EEG), detects the ERD and generates a command output for controlling the actuator to provide sensory feedback, communication or mobility to the user [7]. BCIs are an emerging technology for motor recovery [8–11]. In these applications, feedback plays a key role as it influences the subject's attention, concentration and motivation. Thus, it must be realistic and similar to the specific motor task, in order to promote neural plasticity [12].
Functional electrical stimulation (FES) is one of the available intrinsic feedback modalities in BCI systems [8, 10, 13–16]. FES produces or assists movements through the application of electrical stimuli to either mixed or sensory nerves [17] and provides visual, proprioceptive and cutaneous feedback to the patient [18]. FES can also be used to evoke the nociceptive withdrawal reflex (NWR). The NWR is a polysynaptic reflex that integrates afferent sensory signals, descending modulating signals and motor commands to evoke the limb withdrawal motor response. The NWR evoked by electrical stimuli has been previously used to produce functional movements, such as the flexion of the main joints of the lower limb [19]. Since patients with hemiparesis have difficulties performing these same movements, NWR-based FES therapy was proposed for gait rehabilitation, with successful results [20]. Then, it can be hypothesized that motor relearning and motor recovery could be facilitated in hemiparetic people if the NWR is evoked repetitively and synergistically with the activation of the central nervous system with the aid of an ERD-based BCI. A potential problem with this concept is that ERD happens during voluntary MI, whereas the NWR is related to the activation of the nociceptive system and it can be inhibited and/or modulated by the subject. Previous studies investigated changes in brain rhythms in relation to different nociceptive stimuli and pain conditions [21–25]. The relation between the central processing of nociceptive information and the MI is emerging in the BCI context [26]; but the use of NWR as a feedback is still unknown.
In this study, the ERD produced during MI immediately after FES-evoked NWR was assessed in order to evaluate if nociceptive stimulation conditions the ERD of the subsequent MI. To this end, an experiment was carried out in which participants attempted to use an ERD-based BCI which provided two types of feedback: intrinsic, given by the FES-evoked NWR; and extrinsic, provided by a computerized animation by virtual reality (VR).
2. Materials and methods
The experimental study consisted of two stages: the Parameters Selection of the BCI and the electrical stimulator; and the Feedback stage in which two BCI were used, each one with a different actuator device. One actuator provided extrinsic feedback and was based on VR imitating foot dorsiflexion (BCI_VR). The other provided intrinsic feedback and consisted of an electrical stimulator to evoke the NWR and produce visible foot dorsiflexion (BCI_NWR).
2.1. Volunteers
Twelve healthy naïve volunteers without neurological or cognitive conditions (mean age 32 ± 9 years, 6 female) were invited to participate, of whom 8 were enrolled in the study after assessing the following inclusion criteria: ability to modulate their sensorimotor rhythms achieving ERD and visible foot dorsiflexion following FES-evoked NWR. The study was conducted following the Declaration of Helsinki. The protocol was approved by the Central Ethics Committee for Research and Medical Practice of the Entre Ríos, Argentina, and registered in the National Registry of Health Research (RENIS IS001667). All subjects signed a written informed consent prior to participation in the experiment.
2.2. Parameters selection stage
The purpose of this stage was twofold: (1) to determine the desynchronization frequency ( ) to configure the BCI and (2) to identify the NWR stimulation intensity to configure the electrical stimulator. The
  was defined as the EEG frequency that showed the largest desynchronization, assessed with the coefficient of determination (r2) at Cz [27]. NWR stimulation intensity was defined as the minimum comfortable electrical stimulation intensity that achieved visible foot dorsiflexion. The limb with the highest r2 in Cz for
  was selected for further use in the Feedback stage.
2.2.1. Materials
Eight EEG channels were recorded using a g.MOBIlab+® amplifier (Guger Technologies, Austria, sampling frequency: 256 Hz, resolution: 16 bits, filters: 0.5–100 Hz, sensitivity: 500 μV) and the BCI2000 software platform [27]. EEG signals were filtered using a Butterworth bandpass filter between 0.5 Hz and 40 Hz. A notch filter was used to suppress the 50 Hz power line interference. A g.GAMMA® cap was used for positioning the passive electrodes (g.LADYbird®) on the scalp according to the extended version of the international 10–20 system. Electrode positions C3, C4, T7, T8, Pz, F3, F4, and Cz were selected, taking into account the cortical areas of interest for this study [27]. The ground and reference electrodes were placed on the right and left mastoids, respectively.
A computer-controlled pulse generator [28] and a linear current isolated stimulator (STMISOLA, BIOPAC® Systems Inc., USA) were used to deliver electrical stimulation. The active electrode size was 1.5 × 2 cm (Ambu® Neuroline 700, Denmark) and the indifferent electrode size was 5 × 9 cm (Pals®, Axelgaard Manufacturing Co. Ltd, Denmark).
2.2.2. EEG signal processing
EEG recording signals were processed using BCI2000 Offline Analysis tool available in BCI2000 Platform [25]. This signal processing consisted in the application of a common average reference filter to remove physiological and non-physiological interferences and the computation of  which was represented in topographic maps within the frequency range from 8 Hz to 30 Hz (sensorimotor rhythms) for the left and right feet [27]. The coefficient
  was estimated as the square of the Pearson correlation coefficient between the spectrum of the EEG signal in the resting state and the spectrum of the signal associated with the MI. This coefficient assumes real values between 0 and 1. Values of
  close to 1 indicate a very good discrimination between rest and MI conditions, while values of
  close to 0 are associated to conditions that can be scarcely distinguished [29]. The cortical localization of the ERD related to MI of foot dorsiflexion was identified by visual analysis of the EEG at the Cz position and the
  was identified for each foot [4]. Finally, the limb with highest r2 in Cz for
  was selected to evoke the NWR.
2.2.3. Protocols
Subjects were first asked to sit in a comfortable and relaxed position. Then, they were instructed to avoid eye blinking and/or muscle movement as much as possible. Finally, they were asked to rehearse foot dorsiflexion without muscle contraction to simulate paretic MI [30]. EEG was recorded based on the experimental protocol proposed by Schalk and Mellinger [27], which consisted of three series with one or two minutes rest intervals in between. Each serie included three randomly distributed different tasks of simulated paretic dorsiflexion of the right foot, the left foot, or both feet in response to a visual cue presented in the middle of the screen. Every task was repeated 10 times during each serie, separated by a 5 to 6 seconds random inter-task interval. During these intervals, subjects were asked to relax. At the end, 30 EEG trials for each task were obtained across the three series (90 trials in total for each volunteer).
To evoke the NWR from the selected limb, the cathode was placed on the medial area of the sole of the foot and the anode was placed on the dorsum of the same foot, which resulted in foot dorsiflexion with minimal discomfort due to the electrical stimulus. The NWR was elicited with a train of 5 pulses of 1-ms duration delivered at 200 pps [19].
The NWR stimulation intensity was determined using a staircase procedure, in which the intensity of the electrical stimulation was initially set at 1 mA, and then it was increased and decreased, in steps of 1 mA, until a visible foot dorsiflexion was obtained or the volunteer manifested intolerable discomfort. Once the desired ankle joint movement was obtained, the intensity was fixed for that volunteer throughout the session and selected as NWR stimulation intensity.
As a result of this first stage, the  for the BCI calibration, the limb to evoke the NWR and the NWR stimulation intensity were selected for each subject.
2.3. Feedback stage
This stage consisted of 2 sessions, in which the two ERD-based BCIs were tested: BCI_NWR and BCI_VR. During these sessions, volunteers performed MI tasks, which consisted of ankle dorsiflexion intention without muscle contraction, to imitate the paresis of the stroke users.
2.3.1. Materials
Figure 1 shows the block diagram of the ERD-based BCI used in this study. It consisted of 3 modules: Signal Sensor and Conditioner, Control Signal Generator and the Actuator Device. The first two modules comprised the following blocks: Acquisition, Filtering, Segmentation, Spatial Filtering, Feature Extraction, Feature Selection, and Classification.

Figure 1. Structure of the ERD-based BCI, with its modules: signal sensor and conditioner; control signal generator and actuator devices.
Download figure:
Standard image High-resolution imageThe electrodes positions placed in the Parameters Selection stage were preserved in this stage. Acquisition and Filtering were the same blocks that were used in the previous stage. Then, data from each channel were segmented and sent to the next module in sets of 8 samples (total length: 31.25 ms) [27]. In the Control Signal Generator module, a Laplacian spatial filter was implemented to improve the signal to noise ratio and to enhance the signal from Cz (Cz' signal) [31]. Then, in the Feature Extraction block, the power spectral density from Cz' was computed in 500-ms epochs via a 16th-order autoregressive model estimated by the Burg Method [32], in the range of 8–30 Hz and using 3-Hz bins. In the Feature Selection block, the spectral amplitude from Cz' corresponding to the  (
( ) was selected, resulting in 64
  per task [16]. The first 500 ms after the cue were not used because they can present cue-evoked potentials [33]. The Classification block identified the ERD when the mean
  (
( ) between 0.5 and 2 s after the cue falls below an adaptive threshold. This threshold was set as the lowest of the last two
  The initial classification threshold was established as the first
  In this way, the strategy to update the detection threshold compelled the volunteers to try decreasing the amplitude of their sensorimotor rhythms to achieve the activation of the BCI, in a trial-by-trial basis. The output of the classification block provided a single activation command for each detected MI task, to trigger the stimulation pulse train [30]. Figure 2 shows the BCI operation protocol.

Figure 2. Recording and BCI operation protocol at Feedback stage.
Download figure:
Standard image High-resolution imageThe control signal was sent through virtual ports to the two actuators, so the following two BCIs were available:
- BCI_VR: the actuator was a VR software developed on the V-REP PRO EDU 3.0 platform (Coppelia Robotics GmbH, Zürich, Switzerland) that imitates the foot dorsiflexion in a mirror-like fashion, giving extrinsic feedback [6].
- BCI_NWR: the actuator consisted of the electric stimulation system used in the Parameters Selection stage that generates the electrical stimuli to evoke the NWR, producing reflex responses resulting in foot dorsiflexion and therefore, intrinsic feedback [30].
The Filtering, Segmentation, Spatial Filtering, Feature Extraction, and Feature Selection blocks were implemented using the BCI2000 platform [27]. The Classification block and the communication with the actuator devices were implemented in Matlab 9.01, R2016a (The Mathworks, Natick, MA, USA).
2.3.2. Recording protocol
Data were recorded during 2 sessions in the same day, each session with a different feedback in random order. Each session consisted of 3 sets of 11 MI tasks of the selected foot, in response to an auditory cue. The MI task duration was 3 s, followed by a rest period (inter-task interval, ITI) of 15 s, to avoid habituation of the NWR. The classifier output was generated 2 s after the cue, as can be seen in figure 2. Volunteers were asked to relax 3 s after the cue. During the ITI, the actuator was disabled.
2.3.3. ERD quantification
Data from 528 trials of EEG signals were processed. Following the approach put forward by [32, 34], the percentage of ERD at  was estimated as:

where  is the
  of the ITI and
  is the
  during the MI task.
2.3.4. NWR quantification
The NWR response was assessed by surface electromyography (EMG) of the tibialis anterior muscle (TA). Two Ag/ClAg electrodes of 1 cm in diameter, were placed 2 cm apart on the belly of the TA and the ground electrode was placed on the malleolus [35]. A BioAmp amplifier [36] and the BrainBay software platform [37] were used to record EMG. The EMG signals were filtered between 0.5 and 500 Hz and sampled at 2 kHz.
The EMG signal was analysed using Matlab 9.01, R2016a (The Mathworks, Natick, MA, USA). The analysis window, defined as the period of time in which a NWR is expected, was established between 60 and 180 ms after the start of the electric stimulation train [19]. The mean amplitude of the rectified TA EMG signal was calculated by means of the Root Mean Square value ( ). The baseline
  (
( ) was defined as the
  amplitude of the TA EMG starting 120 ms before the stimulation onset and ending at the stimulation onset. The
  was subtracted from the
  in order to quantify the reflex response and, finally, the difference was normalized with respect to the baseline (
 ):
):

To detect the presence of the NWR, a z score was calculated as:
where  is the maximum amplitude of the EMG in the analysis window, and
  and
and  are the means and standard deviations of the baseline, respectively. A z score greater than 12 indicates the presence of a NWR [38].
2.3.5. BCI performance
To estimate the BCI performance, accuracy was defined as the number of correct classifications of user´s states divided by the total amount of trials (in percentage):

where  is the number of True Positive;
  is the number of True Negative trials and
  is the number of the total trials. Then, because the BCI was disabled during the resting trials (ITI),
  was equal to the number of resting trials.
2.3.6. Pain assessment
At the end of the session, volunteers were asked to assess the pain intensity related to the electrical stimulus. A Numerical Rating Scale (NRS) was used to quantify the level of pain, where 1 was a minimal sensation of discomfort and 10 was intolerable pain. A score of 5 was established as the pain threshold [39].
2.4. Statistics
Statistics were performed using SPSS® v.23. Summary measures for the data are presented as mean ± standard deviation. Linear mixed models were used to analyze the relationship between the reflex response (i.e. the NWR size estimated by the RMSnorm
) and both the  and the
  subsequent the FES-evoked NWR triggered by a MI; and to determine if the type of feedback (extrinsic feedback by RV or intrinsic feedback by NWR) affects the
  or the
  subsequent to the activation of the ERD-based BCI. A compound symmetry structure was used to model the covariance matrix and p values smaller than 0.05 were considered statistically significant.
3. Results
Table 1 shows the  determined during the Parameters Selection stage for all volunteers incorporated to the Feedback stage. Only one volunteer (S5) presented
  in mu rhythm while the rest of them evidenced
  in beta rhythm.
Table 1. Desynchronization frequency ( ) for BCI calibration.
| Subject | S1 | S2 | S3 | S4 | S5 | S6 | S7 | S8 |
|---|---|---|---|---|---|---|---|---|
 (Hz) (Hz) | 24 | 27 | 27 | 30 | 8 | 24 | 15 | 14 |
Figure 3 shows an example of the EEG signals recorded during 4 MI tasks. It were observed the start (vertical line marked '1') and the end of the MI tasks (vertical line marked '0'). If there was MI detection (for example after the first 0:15 min, then at 00:33 min and finally at 1:10 min), the electrical stimulator was activated and consequently the NWR was evoked, eliciting EEG artefacts related to electrical stimulation and a somatosensory evoked potentials also caused by the electrical stimulus, whose intensity for this volunteer was 27 mA.
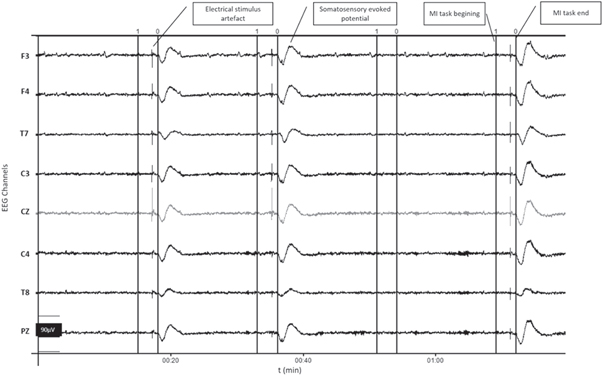
Figure 3. Example of EEG signals recorded during 4 MI tasks.The start of the task (1) and the end of the task (0) are marked with solid vertical lines. Electrical stimulation intensity = 27 mA.
Download figure:
Standard image High-resolution imageIn figure 4 (a) it can be observed the media and standard deviation (SD) of EMG signals from the TA during the FES-evoked NWR. It highlighted the great variability in the morphology and amplitude of the EMG signal and, therefore, of the NWR. To describe this NWR variability, in figure 4(b), can be observed the box plot of all the RMSnorm values of the evoked NWR during the Feedback stage. The dispersion and the presence of three atypical values are highlighted, which show reflex activity with RMS amplitudes up to almost 50 times the baseline.

Figure 4. EMG signals from the TA during the FES-evoked NWR, n = 153. (a) Median (solid line) and standard deviation (SD, shaded boundary). (b) Box plot of RMS amplitudes normalized to baselines (RMSnorm ).
Download figure:
Standard image High-resolution imageIn figure 5 it can see an example of evolution, during 3 series of a session, of the  and the RMSnorm
normalized to the maximum of the series. In vertical lines, the last MI task of each series was indicated. It can be observed the great variability of the
and the RMSnorm
normalized to the maximum of the series. In vertical lines, the last MI task of each series was indicated. It can be observed the great variability of the  before each MI and the RMSnorm
, highlighting in this example that the RMSnorm
of the third series seem to be of lower value than in the previous two. The full lines indicate the last MI of each series; 11 MI per series.
before each MI and the RMSnorm
, highlighting in this example that the RMSnorm
of the third series seem to be of lower value than in the previous two. The full lines indicate the last MI of each series; 11 MI per series.
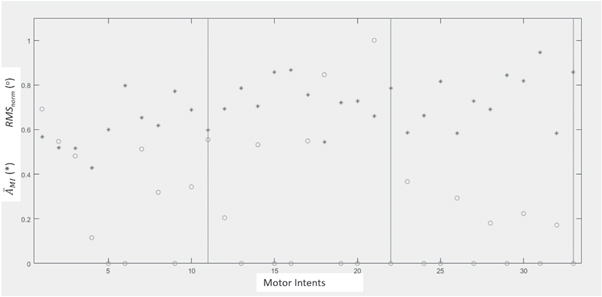
Figure 5. Example of evolution of the  (*) and the RMSnorm
(°), normalized to the maximum of the series; during 3 series, 11 MI per series.
(*) and the RMSnorm
(°), normalized to the maximum of the series; during 3 series, 11 MI per series.
Download figure:
Standard image High-resolution imageThe mean BCI accuracy was 74.4% for the BCI_VR and 75.0% for BCI_NWR. The mean electrical stimulation intensity used to evoke the NWR was 13.6 ± 6.4 mA. The average level of discomfort due to electrical stimulation was 3.33 ± 1.37. 75% of the volunteers scored below 5 in the NRS, while the remaining volunteers scored 5. All of them manifested that the feedback was unpleasant but not painful.
No evidence of changes of the amplitude of the NWR response (RMSnorm
) on the subsequent  (p = 0.663) or the subsequent
  (p = 0.252) was found.
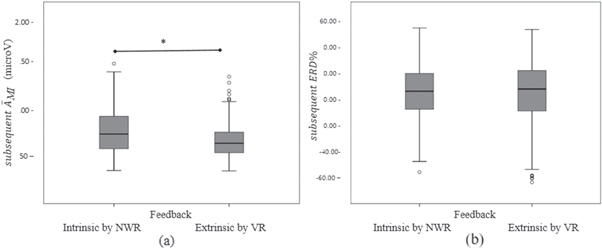
Figure 6 shows the box plots corresponding to the values of the  and
and  according to the type of feedback, subsequent to the activation of the BCI. A main effect of the feedback type was found in the subsequent
  (p < 0.001), but no difference between feedback type was found for the subsequent
  (p = 0.961).
Figure 6. Box plots of (a)  and (b)
  subsequent to the BCI activation, according to the type of feedback. The asterisk indicates main effect (*) (p < 0.001).
Download figure:
Standard image High-resolution image
4. Discussion
This study was carried out to determine whether the ERD changes after receiving electrical stimulation of sufficient intensity to produce a NWR with visible foot dorsiflexion. Since the NWR involves the activation of the nociceptive system by means of electrical stimulation using intensities that can cause pain or discomfort, it was hypothesized that this could affect subsequent attempts of sensorimotor rhythms desynchronization, since this would result in activation of the electrical stimulator via the BCI. To test this hypothesis, the  and
and  subsequent to the activation of either a VR animation that provided visual feedback or the NWR that provided cutaneous, proprioceptive and visual feedback were compared across actuator modalities. Regarding the relationship between the reflex response and the subsequent ERD%, results did not show a significant relationship between the RMSnorm
and the measures of desynchronization. Due to the small sample size, it is an exploratory study.
subsequent to the activation of either a VR animation that provided visual feedback or the NWR that provided cutaneous, proprioceptive and visual feedback were compared across actuator modalities. Regarding the relationship between the reflex response and the subsequent ERD%, results did not show a significant relationship between the RMSnorm
and the measures of desynchronization. Due to the small sample size, it is an exploratory study.
4.1. NWR and subsequent ERD
The stimulation intensity required to evoke a withdrawal reflex is often sufficient to activate the nociceptive system [19]. Regarding the use of a nociceptive stimuli that may evoke painful sensations, the volunteers in this study were aware that there was a chance that they would receive a nociceptive stimulus to evoke the NWR after a MI. The stimulation intensity selected in our study was high enough to achieve visible ankle dorsiflexion but was not scored as painful by the volunteers, i.e. none of them rated above 5, which was the pain threshold. Also, the mean stimulation intensity was similar to the one used in NWR experiments with healthy subjects (14.6 ± 5.8 mA) [19]. Stroke patients usually present sensory problems with a concurrent decrease in sensitivity [40], so our intensity levels would not be a problem for future application of the method in these patients. In this sense, studies involving stroke patients reported stimulation intensities of 31.7 ± 2.9 mA to evoke NWR and 22.1 ±2.2 mA for gait re-education based on NWR [20].
In this study, it was observed that volunteers achieved ERD even after receiving an unpleasant stimulus 15 s earlier. In other words, they did not suppress the oscillations of their sensorimotor rhythms (at alpha and beta frequencies), perhaps because the electrical stimuli were annoying but not painful. Phasic pain stimuli transiently suppress oscillations at alpha and beta frequencies [24]. Nociceptive stimulation produces transient and strong alpha-ERD at latencies between 150 and 1000 ms after stimulation with ITI ranging from 8 to 12 s [23]. It was also reported that this short latency nociceptive-induced alpha-ERD reflects the summation of sensory-related and task-related cortical processes [21]; but the effects on ERD induced by unpleasant stimuli have not yet been reported.
4.2. Type of feedback
In the BCI context, feedback can be given intrinsically or extrinsically, as a response to the MI. The feedback informs the person about their performance while the motor task was being performed. Extrinsic feedback is defined as the information provided by an external source, for example a therapist or a display [41–43]. Intrinsic feedback is related to sensory information from changes in the body, given for example by orthotic or FES [8, 10, 11]. Intrinsic feedback activates visual, auditory, proprioceptive and tactile pathways and enables an appropriate sensory context to facilitate cortical reorganization. For BCIs in rehabilitation, this feedback is generally richer than extrinsic feedback [44, 45], particularly with FES-evoked NWR since afferent sensory signals, descending modulating signals and motor commands are integrated by the central nervous system into a motor output. Moreover, the electrical stimulation needs to be combined with simultaneous voluntary effort to potentially provide an artificial way that ensures synchronized activation of the residual corticospinal tract [18]. This voluntary effort involves the sensorimotor rhythms modulation as a response to the motor task, i.e. ERD which was detected by the BCI. No reports about ERD-BCI with FES-evoked NWR have been found.
In this study a main effect of the feedback type was found in the subsequent  with intrinsic feedback resulting in a larger
  (figure 6(a)), but it was not found for the subsequent
  (figure 6(b)). Attention to unpleasant stimuli could have influenced the
  [46], but it is not clear. On the other hand,
  takes into account the resting condition (
 ). The 15 s duration ITI avoided the habituation of NWR and allowed the volunteers to prepare for a new ERD but, perhaps, it was not long enough to reach the resting state during the use of BCI_NWR. The role of mental states in determining individual post-stimulus brain activity, perception and behaviour is a key in this type of studies [24]. Future studies are necessary to explore the influence of the attention to unpleasant stimuli and to determine whether the volunteers went back easier into rest with RV feedback than with NWR feedback.
The mean BCI accuracies (74.4% for the BCI_VR and 75.0% for BCI_NWR) showed that both of the BCI were higher than the chance level of 63.3% [47] and they were in the range reported by other authors for lower limb ERD_based BCI [6].
4.3. ERD-based BCI
Although the development of the BCI_NWR was not the aim of this study, the concept of eliciting the NWR by a BCI was also explored using an ERD-based BCI with FES-evoked NWR in the Feedback stage.
Regarding the applied ERD-based BCI, the Acquisition, Filtering, Segmentation, Spatial Filtering, Feature Extraction and Feature Selection blocks were based on those proposed by Schalk and Mellinger [27] and used by several authors [48–50]. A 16th-order autoregressive model was used to estimate power spectral density because it performs better than Fast Fourier Transform in short data segments [51].The order of the model was selected as it is suggested in the literature for scalp EEG sampled at 256 Hz [27, 52]. In future studies, it could be interesting to compare the advantages and disadvantages of different feature extraction methods.
The BCI recorded the EEG in monopolar configuration, filtered it, and then used a Laplacian spatial filter to generate a single signal that highlights the signal coming from the electrode Cz (Cz' signal). Other authors recorded the EEG in bipolar configuration and chose the most convenient pair of electrodes for the best BCI control, placed in different areas of the cerebral cortex [15]. However, in the context of neuro-rehabilitation, the aim is to achieve motor recovery. Then, it is essential to record the EEG signal originated in the injured motor cortical area which is expected to recover through training (in our study, the lower limb and therefore Cz). Although in stroke people the EEG signal to noise ratio is likely reduced, there are studies that report that it is possible to identify ERD and control a BCI with signals from the affected hemisphere [6, 11, 53, 54].
Regarding spatial filters, in a review reported by Bashashati et al [55], the authors reported that 32% of the studies used Laplacian filters, 22% used principal component analysis (PCA) or independent component analysis (ICA), 14% common spatial patterns (CSP) and 11% used common average reference (CAR) filters. In filters based on PCA, ICA or CPS the weights are adapted from data of all the EEG channels [56], which may not be those corresponding to the cerebral cortex to recover. On the other hand, the use of CAR filters tends to reduce the impact of artefacts common to all channels, but they do not fulfil the objective of enhancing the signal coming from a specific EEG channel. For these reasons, and given that the filter seeks to highlight spatially localized brain activity [31], it is considered that the choice of the Laplacian filter is appropriate for the application in neuro-rehabilitation.
The used BCI detected the MI estimating the average energy of the EEG signal at  in Cz' in each MI and then compared it with an adaptive threshold established as the lowest of the last two
  This strategy was similar to those used by other authors who established an adaptive threshold as the mean of the means of the populations of the
  during the MI and during rest [57]. The used BCI generated a binary output to command the actuator, for each detected ERD during a MI. Similarly, others studies proposed a BCI that provided a binary command signal for the control of a FES device. These BCIs were based on ERD with a double threshold configured for each subject with an empirical procedure [15].
All of the modules of the BCI used in this study could be modified or optimized by using other machine learning strategies [58] but always taking into account the feasibility of use in a clinical rehabilitation setting, that is, being of rapid configuration and calibration and easy-to-use by the therapist/operator.
4.4. Other observations
Seven of the eight healthy naïve volunteers showed  (table 1) in beta rhythm, while only one participant evidenced ERD in mu rhythm. These results coincide with the bibliography where it was reported that there is a desynchronization of the both sensorimotor rhythms [2, 4, 5, 32, 33].
After each activation of the electric stimulator by the BCI, somatosensory evoked potentials were registered, as shown in figure 3. When using electrical stimulation at high-intensity levels just like in this study (13.6 ± 6.4 mA; needed to overcome the threshold for NWR evocation and to perform joint movement), somatosensory evoked potentials reflect the simultaneous activations of large-diameter, lower threshold non-nociceptive fibers (type Aβ) and small-diameter, higher threshold nociceptive fibers (Aδ) [59].
In the example of the evolution of the RMSnorm during 3 series of a session shown in figure 5, the intra-subject variability is observed during a session and at a constant stimulation intensity. Likewise, there is a tendency to decrease the RMSnorm (relative to the maximum of the series) during the third series. This could be due to the habituation of the NWR that, although the ITI of 15 seconds was established to avoid it, might not be enough for this subject. These considerations should be taken into account at the time of the implementation of a rehabilitation therapy. Also it would be interesting to estimate the ERD latency both as a biomarker and as a detector of the onset of ERD in order to give feedback to the user at the earliest possible time [60].
5. Conclusions
Results showed that the cutaneous, proprioceptive, tactile and visual, although unpleasant, feedback given by the foot dorsiflexion obtained by FES-evoked NWR did not condition the subsequent ERD and that it was possible to elicit the lower limb NWR by an ERD-based BCI to produce a visible foot dorsiflexion. FES-evoked NWR could therefore be used as feedback in an ERD-based BCI for motor recovery of stroke people. The NWR causes the flexion of the affected lower limbs joints and, if it is performed repetitively and synergistically with the central commands activation (thanks to the use of an ERD-based BCI), it is expected to facilitate motor relearning.
Acknowledgments
Authors wish to thank Prof. Diana Waigandt (Interdisciplinary Counselling Area - Faculty of Engineering - National University of Entre Rios) for the English language editing service provided.
Data availability statement
The data generated and/or analysed during the current study are not publicly available for legal/ethical reasons but are available from the corresponding author on reasonable request.