


Abstract
Nanoparticles have numerous uses in biomedical sciences, and this study addresses the mechanisms responsible for the formation of gold nanoparticles (GNPs) for measuring doses of ionizing radiation used in clinical radiotherapy. GNPs synthesized at various radiation doses were experimentally characterized and two mathematical models were developed to simulate the kinetics of the synthesis process. The first is similar to the Fink-Watzke model and predicts the rate of soluble gold salt conversion to GNPs, and the second model is based on a population balance model and predicts both nanoparticle concentration and size distribution. The model parameters that provided an optimal fit to experimentally gathered data were determined, and both models were able to capture the experimental absorbance time trends, which indicated the formation of gold nanoparticles. The population balance model, however, had the greater predictive power as it captured mean particle size trends that were consistent with experimental measurements.
Export citation and abstract BibTeX RIS
Introduction
The detection and dosage measurement of ionizing radiation have several applications in nuclear power, agriculture, astrophysics, and medical imaging/therapy (e.g., radiation is employed for tumor ablation and imaging of diseased tissue [1–6]). Ionizing radiation exposure has deleterious effects on human health, and it can damage DNA via strand breaks and nucleotide oxidation, which can lead to cancer [7–10]. Effective measurement methods for ionizing radiation dosing are necessary in order to reduce accidents and to improve safety while working with ionizing radiation. Many current methods of radiation detection have limitations, including difficulty and/or cost of fabrication, slow response times, low sensitivity, low clarity of readout, and/or portability. A simple colorimetric sensor for detecting ionizing radiation using different compounds that template gold nanoparticle formation is currently being developed [11, 12]. A solution or gel containing the precursor gold salt is placed near the tumor and site of radiation exposure, and then the color change, due to the formation of gold nanoparticles, acts as a straightforward visual indicator of radiation dose.
The first step of gold nanoparticle formation is the generation of radicals and free electrons from the radiolysis of water by x-rays. This process includes several reactions that occur over an extremely short time scale, and the reaction rates have been estimated previously [13–15]. The electrons produced via the radiolysis reactions reduce the gold ions in the solution to zero-valent gold. Once zero-valent gold atoms are generated, the formation of gold nanoparticles begins. Gold nanoparticle synthesis is typically viewed as a two-step process. The first phase is nucleation or the formation of gold nanoparticle that have achieved the minimum stable particle size. The second phase, growth, is the increase in nanoparticle size beyond the initial critical particle radius.
There have been several studies that modeled this two-step mechanism, and most start with the simplest model, the Finke-Watzky model. The Georgiev study used a Finke-Watzky model, and they calculated the corresponding kinetic constants for chemically synthesized gold nanoparticles [16]. A study by Perala et al examined the two-step mechanism for iridium nanoparticles. It expanded on the Finke-Watzky mechanism to produce several population balance models that predict particle size based on different assumptions about the formation process, and they found that the population based models predicted particle synthesis more accurately than the Finke-Watzky model [17]. There are also more complicated models that take into account factors such as, surface diffusion, multiple growth stages, polydispersity, and particle shape [11, 17–20].
For the gold nanoparticle system of interest here, color change can be observed (i.e. nanoparticle formation) at doses between ranging from 0.5–10 Gy (1 Gy or Gray is 1 Joule energy absorbed per kg mass). Ongoing investigations are determining how the nanoparticle formation under ionizing radiation is affected by different surfactants. The objective for this work is to develop a mathematical modeling framework for predicting nanoparticle formation kinetics over a wide range of radiation doses in order to better understand mechanisms and investigate parameters that enhance sensitivity when measuring ionizing radiation dose. Nanoparticle formation is affected by a large number of factors such as the templating molecules, radiation dose, and initial soluble gold concentration. A mathematical framework would enhance the fundamental understanding of the mechanisms controlling nanoparticle formation following radiolysis and, therefore, efficacy of the ionizing radiation sensor. A mathematical model would also permit the investigation and optimization of parameters that enhance the sensitivity to ionizing radiation, thus potentially reducing the overall experimental burden.
Methods
Gold nanoparticles were generated using various ionzing radiation (x-ray) doses as described below, and the absorbance and mean particle size were measured. Two different mathematical models were developed, which are also described below, and the predictions of each model were compared with the experimental measurements.
Materials
Gold(III) chloride trihydrate and L-ascorbic acid were purchased from Sigma-Aldrich. Cetyltrimethylammonium bromide was purchased from MP chemicals. All chemicals were used as received without any additional purification.
Sample preparation for irradiation
HAuCl4.3H2O (30 μl of 10 mM) was mixed with 600 μl of 50 mM C16TAB. Upon addition of 900 μl (5.88 or ∼5.9 mM) of 10 mM l-ascorbic acid, the solution turned colorless. The pH of the final solution was ∼5. All samples were prepared in Nanopure water (18.2 MΩcm) at Banner-MD Anderson Cancer Center, Gilbert, AZ, immediately prior to radiation treatments.
Radiation conditions
A Varian TrueBeam linear accelerator was used to irradiate samples with x-rays at a dose rate of 15.6 Gy min−1 at room temperature. Energy of the beam was 6 MeV and the field size was 30 cm by 30 cm [21]. The samples were irradiated at doses of 0 (control), 5, 10, 15, 25 and 35 Gy, respectively. All post-irradiation analyses were performed at Arizona State University in Tempe, AZ (one-way travel time of approximately 20–30 min).
Absorbance spectroscopy
UV–visible absorbance spectra of the irradiated and the control samples were measured using a BioTek Synergy 2 plate reader. Absorbance spectra, from 300 nm–900 nm with a step size of 10 nm, were determined using 150 μl sample in a 96-well plate. Nanopure water (18.2 MΩcm) was used as a blank in all cases. The absorbance value corresponding to the peak wavelength (between 500 and 700 nm) was used as an indicator for gold nanoparticle formation. The final absorbance values used in the mathematical model were offset by subtracting absorbance at 900 nm (A900).
Dynamic light scattering [16] measurements
The hydrodynamic size of the nanoparticles was measured using a Zetasizer Nano instrument and 50 μl volume of the sample. Thereafter, the average diameter values were recorded based on the software readout.
Inductively coupled plasma-mass spectrometry (ICP-MS)
Samples of the irradiated and the control (no irradiation) with a volume of 1.5 ml were centrifuged for 10 min at 10 000 rpm. After centrifuging the samples, the clear supernatant was removed carefully without disturbing the nanoparticle pellet at the bottom of the Eppendorf tube. This nanoparticle pellet was dissolved in 0.32 M HNO3 in order to oxidize the metallic (i.e. gold) nanoparticles to metal ions to facilitate detection using a High Resolution Multicollector ICP-MS. Gold ions were detected using an internal calibration curve performed independently. This was performed to quantify the conversion of precursor (gold ion) to gold nanoparticles in the absence and presence of radiation.
Numerical methods: mathematical models of nanoparticle formation
Because of the extremely short time scale of the water radiolysis and gold ion reduction reactions [22, 23], the reduction reactions are not included explicitly in either of the mathematical models described below, and, instead, the initial concentration of zero-valent gold atoms is specified from experimental measurements at different radiation doses. Two different mathematical models are examined here that predict the formation of GNPs at low radiation doses such as those needed for practical radiation dose measurement.
Finke-watzky model
The first kinetic model describing the kinetics of gold nanoparticle synthesis begins with a reaction describing the formation of stable gold nanoparticle nuclei:

where A is the concentration of gold atoms, B represents the total concentration of gold atoms contained in relatively stable gold nanoparticles and  is the rate of nanoparticle nuclei formation. The stable nuclei formation step is often the slow step in nanoparticle synthesis. The second reaction in the Finke-Watzky model describes the growth of stable nuclei through the incorporation of additional gold atoms:

The Finke-Watzky model ultimately predicts the rate at which insoluble gold atoms, A, are assimilated into gold nanoparticles, B. However, a significant limitation of the Finke-Watzky model is that it does not predict either nanoparticle size or the concentration of particles.
The model prediction is the total moles of gold atoms cumulatively contained in all the particles as a function of time, and this quantity can be converted to an estimate of absorbance using experimental measurements of average particle size when available. A prediction of absorbance is desired so that it can be compared with the experimental measurements taken using UV–vis spectrometry. Beer's Law was used to convert the model prediction of particle concentration to absorbance [24]:

where, b is path length (i.e., the distance of the path that the light travels through the sample), ε is the extinction coefficient, and C is the particle concentration. The particle concentration was calculated by dividing the total concentration of gold atoms in particle form by the mean particle volume:
where r is the mean particle radius, NA is the Avogadro's number and MAu is the molar density of gold, 98  The diameters of the nanoparticles synthesized under different radiation doses were measured experimentally, and for the Finke-Watzky model, all synthesized particles were assumed to be the mean particle size. The extinction coefficient is also dependent on the particle size and is calculated using:

where, D is the mean particle diameter and, k and a are constants that were previously determined to be 3.321 11 and 10.805 05 for gold nanoparticles [24].
Population balance model
Population balance models explicitly recognize particles of different sizes and allow prediction of growth based on size. The governing population balance equation is:
where C(r) is the concentration of particles of size r, μ(r) is the growth rate for particles of size r, and N is the nucleation rate of particles of critical radius size, rc. The numerical approximation of particle balance models is frequently achieved by discretizing particles of different radii into size groups with each group representing a specific radius range. As a result, nanoparticle growth is split into numerous reactions that each describe the growth of particles in radius range i and, after sufficient time, some of these particles grow into radius range i + 1. In other words, when the particles reach a certain size, they move into a grouping of larger sized particles. After discretizing in size groups, the following reactions for nucleation and growth apply:
where, C0 is the concentration of stable gold nanoparticle nuclei and Ci is the concentration of nanoparticles in size range i. The smallest stable nuclei (C0) are assumed to consist of approximately 20 atoms, which is used to calculate the minimum particle radius [17]. The maximum particle radius is estimated from long-time span simulations and verified using experimental measurements, and the range of possible particle radii is divided into N discrete groups (N = 50 was used for results here after confirming the model predictions did not change significant when using additional groups that each represent a smaller range of particle sizes). The growth reaction leads to particles of larger size, and particles continue to grow at different rates (given below).
Material balances on the nucleation and growth reactions results in a model consisting of the following system of differential equations:


The exponent, n, is an unknown parameter that will be determined using the experimental data. Mathematical models of similar systems have used n = 1 to 4 [25]. Therefore, only values over that range are considered here. These equations were non-dimensionalized before obtaining a numerical approximation of the solution.
For some systems, the growth rate, k2,i, is controlled by the association rate of new gold atoms (i.e., reaction rate limited systems) while in other systems, the growth rate is controlled by the diffusion of gold atoms to the nanoparticle surface (i.e., diffusion limited systems) [18, 19]. If I is defined as the molar flux of gold to the surface of the nanoparticle and VM is the molar volume, then the change in particle volume and radius is:
The total flux of molecules to the surface is proportional to particle radius (i.e., the characteristic diffusion length scale) for the diffusion limited case (i.e.,  and the total flux is proportional to particle surface area for the reaction limited case (i.e.,
  ). For the diffusion limited case, the rate at which particles are predicted to move from one size group, Ci, to the next group, Ci+1, is inversely related to the particle radius because
  For the reaction rate limited case,
  Experimental data from the system of interest here suggested that the growth rate of the nanoparticles was dependent on particle size (i.e., the system was diffusion limited) so the particle grow rate, k2,i, was set inversely proportional the particle radius increases:
where  is an unknown growth rate constant. The population growth model predicts both the rate of nanoparticle formation and the size distribution of the final population of nanoparticles.
The primary prediction of the mathematical model, the concentration of particles in each size group, C(r), is converted to estimate of absorbance for comparison with the experimental measurements of absorbance obtained using UV-vis spectrometry. Equations (1) and (3) were used to convert concentration to absorbance. For equation (7), particles in the same size group were assumed to have the same diameter.
Numerical implementation
Algorithms to numerical solve the system of ordinary differential equations associated with each model were developed using Python and the Scipy library. The initial value equations (equations (5)–(8) were solved using ODEPACK from Lawrence Livermore National Laboratory [26]. The initial conditions were set by assuming that no nanoparticles were present at the start of the simulation, and the initial concentration of insoluble gold atoms was set based on experimental measurements at various radiation doses. Finally, for both models, the unknown reaction rates (k1 and k2 for Finke-Wazky and k1 and  for the population balance model) were determined by minimizing the L2-norm of the difference between experimental measurements and model prediction using a Nelder-Mead simplex algorithm.
Results
Metal nanoparticles in general and especially gold nanoparticles have been gathering attention due to their various optical and electronic properties which can be tuned based on their size and shape [27]. Several methods, including laser reduction of bulk gold and reduction of gold ions have been employed for the generation of gold nanoparticles with different shapes and sizes [28]. We have demonstrated that gold and gold-silver bimetallic nanoparticles can be formed using ionizing radiation including at doses that are used for fractionated radiotherapy in the clinic [11, 12, 29, 30]. The formation of gold nanoparticles results in a visible color change in the liquid dispersion medium or gel, and this color change can be used to predict the radiation dose delivered.
In this study, nanoparticles were generated following exposure to ionizing radiation using Au1+ as the precursor gold ion. This metastable Au1+ is generated by partial reduction of Au3+ ions in Gold(III) chloride trihydrate [31] with ascorbic acid in the presence of the C16TAB surfactant. In the current system, the electron required for Au1+ reduction to Au0 is generated through radiolysis of water. High energy photons from the x-ray beam split water molecules and generate transient free radicals including  H· and OH·. The hydrated electrons react with monovalent gold ions and convert them to zero valent gold atoms. These gold atoms coalesce and grow to nano-sized particles which are capped by the cationic surfactant [32]. Nanoparticle formation was observed as early as 1 h spectroscopically in all cases. No significant differences in absorbance intensity was observed for a period of 7 h. An increase in absorbance is observed with increasing radiation dose although this saturates after a threshold dose. This is likely due to an increased generation of reducing free radicals
  The nanoparticles synthesized using ionizing radiation were further characterized using dynamic light scattering to determine their hydrodynamic size and polydispersity index (table 1). Finke-Watzky Model and Population Balance Models were used independently to identify kinetic parameters and nanoparticle size prediction.
Table 1. Physical characteristics of the gold nanoparticles from dynamic light scattering.
| Dose | Average Diameter (nm) | STD DEV Diameter(nm) | Average Polydispersity Index(PDI) | STD DEV PDI |
|---|---|---|---|---|
| 5 Gy | 121.1 | 20.7 | 0.252 | 0.102 |
| 10 Gy | 102.3 | 13.2 | 0.178 | 0.023 |
| 15 Gy | 88.5 | 12.1 | 0.203 | 0.030 |
| 25 Gy | 72.6 | 4.70 | 0.233 | 0.008 |
| 35 Gy | 57.3 | 3.97 | 0.269 | 0.0290 |
Finke-Watzky model
The Finke-Watzky model prediction for the conversion of gold atoms into gold nanoparticles using optimal values for the reaction rates ( and
and  ) so that the model predictions match the experimental data [11] are shown in figure 1. The experimental data are from measurements of absorbance after exposure to a radiation dose of 15 Gy. The initial gold salt concentration is 0.0109 mM and DLS measurements provided the particle diameter of 88.46 nm. Under these conditions, the optimal values for the kinetic parameters,
  and
and  are 1 min−1 and 3 × 10⁵ min−1M−1, respectively.

Figure 1. The concentration of precursor (predicted values, right axis) and absorbance (left axis) over time for 15 Gy radiation dosage using the Finke-Watzky model.
Download figure:
Standard image High-resolution imageFigure 2 shows how the same kinetic parameters that provided the best fit for the median dosage, 15 Gy, fit the model to experimental data at other radiation dosages. Unfortunately, this model does not predict the size distribution of the nanoparticles so comparisons with nanoparticle diameter measurements are not possible. Instead, experimental measurements of particle diameter were used to predict absorbance. The model predictions are least accurate for the small radiation dose cases where GNP formation is predicted by the model to occur more rapidly than is observed experimentally.
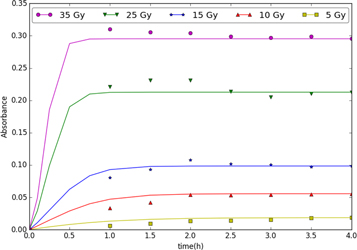
Figure 2. Absorbance predictions for various radiation doses using the Finke-Watzky Model.
Download figure:
Standard image High-resolution imagePopulation balance model
The next set of results are based on the population balance model. Figure 3 shows the model prediction of absorbance versus time for a range of different radiation doses from 5 to 35 Gy. The kinetic parameters, k1, and  are 8 × 10⁻¹⁰ min−1 and 3 × 10¹³ m4min−1μM−1, respectively, and n is set to 4. The experimental measurements of absorbance as a function of time are also shown for comparison to the model predictions.
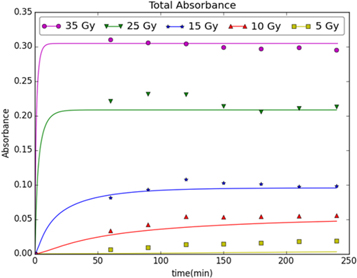
Figure 3. Absorbance versus time [33] for different radiation doses (Gy)using the population balance model.
Download figure:
Standard image High-resolution imageUnfortunately, the earliest experimental measurements of absorbance are 60 min after the radiation dose was delivered so the initial rate of change in absorbance cannot be compared between the model and the experimental data. The agreement between the model predictions and the experimental measurements is the strongest at radiation doses of 15 Gy or more, and the agreement is weaker at the 10 Gy and 5 Gy radiation doses. This discrepancy could be due to error in the measurement of the initial, reduced gold atom concentration, i.e., the initial concentration of Au0. The initial concentration is determined by measuring the gold salt concentration (i.e., the Au3+ concentration) before and after radiation exposure (i.e., measuring the Au3+ that was not converted to Au0 by radiation exposure). At the higher radiation doses (25 and 35 Gy), most of the gold salt was converted to Au0 and only a small quantity remained as soluble gold salt. Hence, the experimental error in measuring the initial Au0 concentration is most likely lower for the higher radiation doses because a large concentration change can be measured more accurately.
Figure 4 shows the model prediction for the final particle diameter distribution at different radiation doses. The vertical, dashed lines represent the experimental measurements of median particle diameter at the various radiation doses. The model predictions agree with the experimental observation that the mean particle size decreases as the radiation dose is increased. For higher radiation doses, there is a higher initial concentration of Au0 atoms and the formation of the smallest stable nanoparticle (i.e., nucleation) is more rapid. The numerous, small nanoparticles quickly grow, but all the Au0 in the solution is consumed before the particles are very large (i.e., when they are still only 35–40 nm). Conversely, at lower radiation doses, the smaller Au0 concentration results in less nucleation and fewer nanoparticles, overall. Even though the Au0 concentration is lower, the small number of nanoparticles allows the particles to grow much larger before the Au0 concentration decreases to zero.

Figure 4. The particle concentration (μM) versus simulated particle radius at varying radiation doses (Gy). Higher radiation doses result in more abundant but smaller particles. The dashed lines indicate experimentally determined diameters for the gold nanoparticles generated using ionizing radiation. The inset is only the 5 Gy distribution.
Download figure:
Standard image High-resolution imageThe agreement between the model and the experimental measurements is best at the higher radiation doses (15 and 25 Gy), but in these cases the model prediction is for larger particles than what was measured experimentally. One possible explanation for this is that the model assumes a maximum particle size that cannot be exceeded. If a few experimental particles exceed this maximum particle size (an event that almost certainly occurred), then less Au0 was available for particle growth in the experiment than in the corresponding model prediction, and, as a result, the mean experimental particle size would be slightly smaller than would otherwise be expected.
Another possible explanation for the larger particles predicted by the model is that the model assumed diffusion was limiting the particle growth rate so that the rate constant,  was inversely related to the particle radius (equation (10)). This assumption was based on a 1-dimensional approximation of the diffusion limitation effects, and the true reduction in the particle growth rate as the particle radius increases could be greater that this assumption implies, thus leading to greater slowing of the growth of the largest particles and reducing the mean particle size predicted by the model.
One more explanation for the smaller particles observed experimentally is that the nucleation rate is faster than modeled, especially for the lowest radiation doses. The nucleation rate is proportional to A4, or the reduced gold atom concentration ![${[A{u}^{0}]}^{4}.$](https://content.cld.iop.org/journals/2057-1976/4/6/065011/revision2/bpexaac280ieqn17.gif) This implies that a halving of the initial Au0 concentration results in a nucleation rate that is 16-times lower. Using a non-integer exponent [34] could result in slightly better agreement between the model and the experimental data.
This implies that a halving of the initial Au0 concentration results in a nucleation rate that is 16-times lower. Using a non-integer exponent [34] could result in slightly better agreement between the model and the experimental data.
Figure 5 summarizes the effect of changing the nucleation rate, k1. Halving the nucleation rate to 4 × 10⁻¹⁰ min−1 decreases the initial slope of the absorbance predictions while increasing the particle sizes. As expected, slower nucleation leads to fewer initial nuclei being formed, leaving more precursor for growth. This results in a slower increase in absorbance and decreased particle concentrations for all radiation doses. The lower nucleation rate allows time for the particles to grow, creating fewer, larger particles. Doubling the nucleation rate to 1.6 × 10⁻⁹ min−1 has the opposite effect. Faster nucleation leads to more nuclei, which results in a more rapid increase in absorbance and increased particle concentrations for all radiation doses. The production of extra nuclei consumes precursor and limits the growth of the particles, creating more but smaller particles.
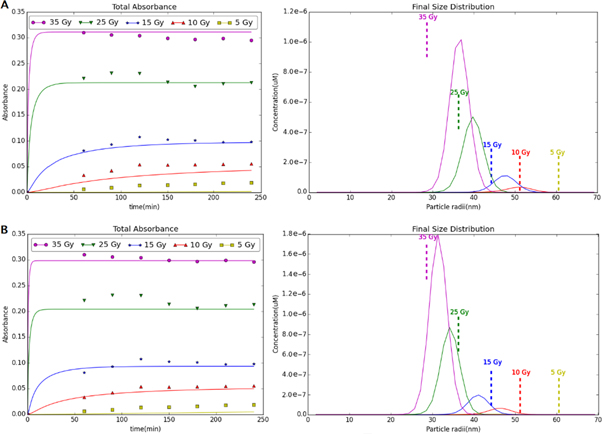
Figure 5. The absorbance and particle distribution predictions of the PBM model with (A) half the previous nucleation rate and (B) double the previous nucleation rate.
Download figure:
Standard image High-resolution imageFigure 6 shows the effects of changing the growth rate,  Halving the growth rate to 1.5 × 10¹³ m4min−1μM−1 decreases the initial slope of the absorbance predictions while also decreasing the particle sizes. As expected, slower growth allows more initial nuclei to form, leaving less precursor for growth. This results in a slightly slower increase in absorbance and an increased particle concentrations for all radiation doses. The production of extra nuclei consumes precursor and limits the growth of the particles, creating more, smaller particles. Doubling the growth rate to 6 × 10¹³ m4min−1μM−1, has the opposite effects. Faster growth leads to fewer nuclei having a chance to form before the precursor is consumed. The result is a more rapid increase in absorbance, decreased particle concentrations, and larger particles for all radiation doses.

Figure 6. The absorbance and particle distribution predictions of the PBM model with (A) half the growth rate and (B) double the growth rate.
Download figure:
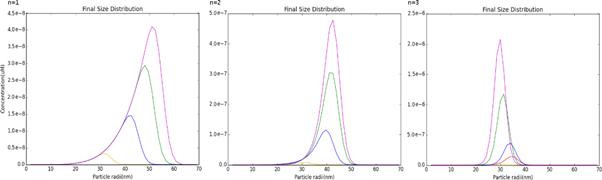
Standard image High-resolution imageThe particle size distributions are a result of the nucleation and growth reactions competing for the precursor. The exponent on the precursor concentration in the nucleation reaction, n, increases the rate at which nucleation occurs, and more rapid nucleation generates more competition with the growth reaction for the limited supply of precursor. Figure 7, shows the effect of changing the precursor consumption power on the GNP size distribution.
Figure 7. The particle distribution as the precursor consumption power, n, is increased. As in previous figures, the different curves represent the different radiation doses: violet is 35 Gy, green is 25 Gy, blue is 15 Gy, red is 10 Gy, and yellow is 5 Gy.
Download figure:
Standard image High-resolution image
The model prediction with n = 1 always result in larger particles when the radiation dose is higher because the higher dose creates more precursor and the additional precursor eventually results in larger GNPs. This result directly contradicts what is observed experimentally. For the n = 2 and n = 3 cases, nucleation is more rapid, especially at the higher radiation doses, so we start to see the highest doses generating smaller particles because of precursor depletion, but the particle sizes at different radiation doses are still less variable than what was observed experimentally. The optimal agreement with the experimental measurements is n = 4, as shown in figure 4.
The original motivation for the development of the model presented here was to help identify key mechanisms controlling the formation of GNPs. It was hoped that this understanding could guide the development of better radiation dosage measurements systems. Comparing a lower dose case, e.g., 10 Gy, to a higher dose case, e.g., 25 Gy, we can observe that the GNPs resulting from a 25 Gy dose absorbed 4 times the amount of light relative to 10 Gy, but the number of particles at 25 Gy was 6 times the number at 10 Gy. Clearly, fewer, larger particles at 10 Gy provide a greater color change relative to the number of particles than at 25 Gy. Any change that slows down nucleation slightly so that particles can grow larger has the potential to improve system performance. Exploring alternative templating molecules and adjusting gold salt concentrations both have the potential to improve system performance at low radiation doses. Seeding the solution with stable nuclei so that more of the gold is captured in particle growth also has the potential to improve low dose performance.
Of the two different models that were developed, the Finke-Watzky model and the population balance model, only the later model had the ability to predict the final particle size distribution so it is the more useful model for understanding some of the key relationships between the various physical phenomena that control GNP synthesis. The accuracy of both models is limited, and neither model can predict absorbance over a large range of radiation doses. If the model parameters are fit based on a dosage of 15 Gy, for example, that model is only reasonable accurate from 10 Gy to 45 Gy. The model parameters can be obtained based on data at lower radiation doses, but then the model would be limited to a range of doses around that lower level. The same limitation applies to the experimental system. Depending on the precursor gold concentration, the system can measure radiation doses only over a limited range before absorbance changes are not measurable. Another limitation of the mathematical model is that the parameters are only appropriate for the radiation dosage rate (i.e., 15.6 Gy min−1) and temperature of the experimental system. A small change in the radiation dosage rate is unlikely to have a large impact on the kinetics of color change because the nanoparticle growth rate is much slower (i.e., 10's of minutes) that the radiation time (i.e., a few seconds to deliver 1 or 2 Gy). Increasing the temperature will increase both the reaction kinetics and diffusion rate, but large temperature changes are unlikely as the experimental system is relatively small and will be maintained mostly at core body temperature.
Conclusions
Mathematical models of gold nanoparticle formation kinetics following radiation exposure were developed and compared to experimental measurements of absorbance and particle size. The first mathematical model was based on the Fink-Watzke model. The model is relatively simple to implement and parameter optimization using experimental data is straightforward. The major limitation of the Fink-Watzke model is that it predicts the precursor consumption rate and it does not predict the final particle size distribution. The second mathematical model was based on a population balance model. This model is more difficult to implement and has significantly greater computational requirements. The model prediction of absorbance at different radiation doses was better for the higher radiation doses, but there was less agreement at the lowest doses. The particle size distribution prediction was consistent and often very close to the experimental measurements. For higher radiation doses, the model predicted a larger mean particle size that was observed experimental, and some possible explanations for this discrepancy were given the results and discussion section. Overall, the population balance model is more useful because it predicts both absorbance and particle size.
Acknowledgments
We gratefully acknowledge the National Science Foundation (NSF-CBET 1403860 and NSF-CBET 1403053) for funding this study.