

Abstract
Few children with cancer in low- and middle-income countries (LMICs) have access to proton therapy. Evidence exists to support replacing photon therapy with proton therapy to reduce the incidence of secondary malignant neoplasms (SMNs) in childhood cancer survivors. The purpose of this study was to estimate the potential reduction in SMN incidence and in SMN mortality for pediatric medulloblastoma (MB) patients in LMICs if proton therapy were made available to them. For nine children of ages 2–14 years, we calculated the equivalent dose in organs or tissues at risk for radiogenic SMNs from therapeutic and stray radiation for photon craniospinal irradiation (CSI) in a LMIC and proton CSI in a high-income country. We projected the lifetime risks of SMN incidence and SMN mortality for every SMN site with a widely-used model from the literature. We found that the average total lifetime attributable risks of incidence and mortality were very high for both photon CSI (168% and 41%, respectively) and proton CSI (88% and 26%, respectively). SMNs having the highest risk of mortality were lung cancer (16%), non-site-specific solid tumors (16%), colon cancer (5.9%), leukemia (5.4%), and for girls breast cancer (5.0%) after photon CSI and non-site-specific solid tumors (12%), lung cancer (11%), and leukemia (4.8%) after proton CSI. The risks were higher for younger children than for older children and higher for girls than for boys. The ratios of proton CSI to photon CSI of total risks of SMN incidence and mortality were 0.56 (95% CI, 0.37–0.75) and 0.64 (95% CI, 0.45–0.82), respectively, averaged over this sample group. In conclusion, proton therapy has the potential to lessen markedly subsequent SMNs and SMN fatalities in survivors of childhood MB in LMICs, for example, through regional centralized care. Additional methods should be explored urgently to reduce therapeutic-field doses in organs and tissues at risk for SMN, especially in the lungs, colon, and breast tissues.
Export citation and abstract BibTeX RIS
For more information on this article, see medicalphysicsweb.org
1. Introduction
Survivors of childhood cancer are at high risk of late effects as a result of their treatment [1–7] and at elevated risk compared to survivors of adulthood cancers [8]. The most severe late effects are more common in those who received radiotherapy than those who did not [7, 9–12], and increased radiotherapy dose is associated with increased risk [13, 14]. Still, radiotherapy remains as an essential component of treatment for childhood medulloblastoma (MB) [15]. After a recurrence, the second most frequent cause-specific mortality of long-term childhood cancer survivors is a subsequent malignant neoplasm (SMN) [16]. The central nervous system (CNS) is the second most frequent childhood cancer site, and MB is the most common of these. MB is most commonly diagnosed in children younger than age 10 years, with approximately 9300 diagnoses in children each year worldwide, 80% of whom live in low- and middle-income countries7 (LMICs) [17–19]. For these reasons, investigations into late effects following radiotherapy for pediatric MB and into reducing those effects are of high importance and relevance globally.
After surgery, pediatric MB and primitive-neuroectodermal-tumor (PNET) patients are treated with craniospinal irradiation (CSI) to eliminate sub-clinical disease that may be present in the tumor bed and in the cerebrospinal fluid that circulates around the brain and spinal cord, within the cranium and spinal canal. Nearby normal tissues can receive radiation at high levels sufficient to produce radiogenic late effects. Risks of late effects are intensified for younger children because, in general, their organs are closer to the therapeutic fields and their organs are inherently more sensitive to radiation. In addition, the safety margins of spinal fields of young children are expanded laterally and, in proton therapy, anteriorly to avoid sharp gradients across the growing vertebrae, which increases the dose in the bones, lungs, abdomen, and heart. Normal tissues of childhood MB or PNET survivors are at high risk of SMNs [20–24], cardiovascular toxicity [25, 26], hearing loss [27–29], neurocognitive impairment [27, 30–34], premature ovarian insufficiency [35–38], chest wall deformities [39], bone growth abnormalities [30, 36], and endocrine dysfunction [40–43]. In the 14 054-participant Childhood Cancer Survivor Study (CCSS) cohort, for example, investigators found a cumulative incidence (CI) of a subsequent neoplasm of 14.6% among MB and PNET survivors at 30 years after their radiotherapy [44]. Thus, children diagnosed with MB, in general, have a high probability of long-term survival [17, 45], but they face escalated risks of radiotherapy-induced SMN compared to the general population.
Because of the challenge of decades-long latency times of most radiogenic cancers [20], no randomized controlled trial or observational study has been reported in the literature with sufficient follow-up time and sample size that compares SMN incidences between photon CSI and proton CSI [46]. However, a few computational studies have projected the lifetime risks of radiogenic late effects in childhood MB survivors based on detailed whole-body dosimetry and dose-effect models, including contributions from secondary particles. These studies have found that delivering proton CSI rather than photon CSI reduces the projected risks of late effects, including ovarian failure [47], cardiac toxicity [48], and various SMNs [49–54]. Only three of these SMN studies, however, accounted for all SMNs from primary and secondary radiation—one ([50]) was for a single patient in a high-income country (HIC) institution; one ([51]) was for a cohort of pediatric patients in a HIC institution but did not single out the specific risks of non-melanoma skin cancer (NMSC), leukemia, uterine cancer, and ovarian cancer; and one was for a single patient receiving proton CSI available in a HIC rather than photon CSI in a LMIC. Although most LMICs have the capability to apply three-dimensional conformal radiotherapy (3DCRT) [55], with the recent exception of China, none currently have the ability to deliver proton therapy [56]. Thus, to fill these gaps, it was necessary to conduct a study with heightened site specificity that compared the absolute risks of each known radiogenic SMNs between photon CSI in a LMIC and proton CSI in a HIC for a sample of pediatric MB patients spanning all ages and including both sexes.
The purpose of this study was to estimate exhaustively the reductions in projected lifetime SMN incidence and mortality for children in LMICs if they were treated with proton CSI rather than photon CSI. Specifically, for these children, we compared the SMN risks due to modern standard-of-care 3DCRT treatment plans in a LMIC institution (photon CSI) versus those in a HIC institution (proton CSI). Nine patients of ages 2–14 years were randomly selected for this in-silico virtual clinical trial, including five girls and four boys. For each patient and for each treatment modality, we retrospectively calculated the equivalent dose in each organ or tissue at risk for an SMN, T, and projected the risks of SMN incidence and mortality for the cancer site associated with T, taking into account all known radiogenic SMNs.
2. Methods and materials
2.1. Patient cohort
A subset of de-identified patient data [57, 58] of nine children—five girls and four boys—who were diagnosed with MB at The University of Texas MD Anderson Cancer Center (MD Anderson) were collected for this study. Separate CSI plans were created according to the standards of care of two leading cancer care facilities in their regions—the American University of Beirut Medical Center (AUBMC) using photon CSI and MD Anderson using proton CSI [59]. AUBMC is an academic hospital in a LMIC that delivers CSI with 3DCRT, and MD Anderson is an academic cancer hospital in a HIC that is capable of delivering proton therapy [60]. Patient data for this study were selected retrospectively using the systematic random sampling method [61], with the following inclusion criteria: between 2 and 14 years of age diagnosed with MB, treated on protocols or according to the current standards of care, availability of CT image data, and having treatment plans that were created between the dates of 1 August 2006 and 31 May 2010. The study was conducted under protocols approved by the Institutional Review Boards of AUBMC and MD Anderson. The cohort's age distribution was approximately uniformly distributed, ensuring a representative range of body sizes and probabilities of second cancers. The patients' characteristics are listed in table 1.
Table 1. Patient characteristics and absolute risk coefficients for LAR of SMN incidence, IT, and LAR of SMN mortality, MT. The coefficients are listed in percent risk per 0.1 Sv of equivalent dose.
| Age at exposure (y): | 2 | 3 | 6 | 6 | 8 | 9 | 9 | 13 | 13 |
| Sex: | Female | Male | Male | Female | Female | Female | Male | Female | Male |
| Mass in TPS (kg): | 9.2 | 8.9 | 16.2 | 20.5 | 20.7 | 16.1 | 21.5 | 30.9 | 31.7 |
| Actual mass (kg): | 11.9 | 12.8 | 24.9 | 26.9 | 29.0 | 24.2 | 29.6 | 42.6 | 57.5 |
| Fraction of mass in TPS: | 0.78 | 0.70 | 0.65 | 0.76 | 0.71 | 0.67 | 0.73 | 0.73 | 0.55 |
| Patient index: | 1 | 2 | 3 | 4 | 5 | 6 | 7 | 8 | 9 |
| SMN site | IT (%) | ||||||||
| Bladder | 0.199 | 0.190 | 0.172 | 0.174 | 0.163 | 0.158 | 0.155 | 0.138 | 0.136 |
| Leukemia | 0.156 | 0.184 | 0.143 | 0.107 | 0.096 | 0.091 | 0.126 | 0.080 | 0.111 |
| Breast | 1.068 | — | — | 0.874 | 0.793 | 0.752 | — | 0.617 | — |
| Liver | 0.026 | 0.054 | 0.049 | 0.022 | 0.021 | 0.021 | 0.044 | 0.018 | 0.039 |
| Lung | 0.683 | 0.282 | 0.252 | 0.587 | 0.546 | 0.525 | 0.225 | 0.452 | 0.194 |
| Ovarian | 0.097 | — | — | 0.084 | 0.079 | 0.076 | — | 0.065 | — |
| Prostate | — | 0.085 | 0.077 | — | — | — | 0.070 | — | 0.061 |
| Other solid tumors | 1.091 | 0.852 | 0.638 | 0.680 | 0.601 | 0.562 | 0.537 | 0.455 | 0.438 |
| NMSC | 1.639 | 0.779 | 0.645 | 1.258 | 1.138 | 1.078 | 0.562 | 0.889 | 0.474 |
| Stomach | 0.095 | 0.069 | 0.063 | 0.082 | 0.077 | 0.075 | 0.057 | 0.065 | 0.050 |
| Thyroid | 0.548 | 0.092 | 0.071 | 0.390 | 0.333 | 0.304 | 0.055 | 0.217 | 0.040 |
| Uterine | 0.047 | — | — | 0.041 | 0.038 | 0.037 | — | 0.032 | — |
| Colon | 0.207 | 0.305 | 0.276 | 0.181 | 0.170 | 0.164 | 0.250 | 0.144 | 0.219 |
| SMN site | MT (%) | ||||||||
| Bladder | 0.056 | 0.041 | 0.037 | 0.049 | 0.046 | 0.045 | 0.033 | 0.039 | 0.029 |
| Leukemia | 0.053 | 0.071 | 0.071 | 0.052 | 0.053 | 0.053 | 0.071 | 0.052 | 0.070 |
| Breast | 0.250 | — | — | 0.205 | 0.186 | 0.176 | — | 0.145 | — |
| Liver | 0.022 | 0.040 | 0.036 | 0.019 | 0.018 | 0.018 | 0.032 | 0.015 | 0.029 |
| Lung | 0.599 | 0.286 | 0.255 | 0.516 | 0.479 | 0.460 | 0.228 | 0.397 | 0.197 |
| Ovarian | 0.052 | — | — | 0.045 | 0.042 | 0.041 | — | 0.036 | — |
| Prostate | — | 0.016 | 0.014 | — | — | — | 0.013 | — | 0.011 |
| Other solid tumors | 0.409 | 0.313 | 0.244 | 0.274 | 0.247 | 0.233 | 0.211 | 0.195 | 0.177 |
| NMSC | 0.003 | 0.002 | 0.001 | 0.002 | 0.002 | 0.002 | 0.001 | 0.002 | 0.001 |
| Stomach | 0.053 | 0.037 | 0.033 | 0.047 | 0.044 | 0.042 | 0.031 | 0.037 | 0.027 |
| Thyroid | 0.055 | 0.009 | 0.007 | 0.039 | 0.033 | 0.030 | 0.006 | 0.022 | 0.004 |
| Uterine | 0.011 | — | — | 0.010 | 0.009 | 0.008 | — | 0.007 | — |
| Colon | 0.096 | 0.149 | 0.135 | 0.083 | 0.078 | 0.076 | 0.121 | 0.066 | 0.106 |
2.2. Patient images, organ delineation, and file transfer
Simulation computed tomography (CT) images had been acquired as part of the routine proton therapy care for each patient and were collected from archived data. The CT image sets extended from the tops of the patients' heads to their mid-thighs, encompassing the majority of the patients' anatomy. Because the patients were from MD Anderson, unlike MB patients at AUBMC, they were simulated in the supine position and a digital couch was added to the images. For each patient, archived target and avoidance volumes were supplemented to include the contours for the 'whole body' (i.e., that captured in the CT image set) and each T, including, bladder, breast tissue, colon (including rectum), liver, lungs, ovaries, skin, stomach, thyroid, uterus, red bone marrow (RBM), and a 'remainder' volume that was created as a Boolean subtraction between the whole body and the union of all specific SMN sites. Because magnetic resonance imaging data were insufficient or missing, delineating the ovaries and RBM accurately was difficult. The size and position of the ovaries in the girls were approximated as 0.5 cm-diameter spheres located laterally to the body of the uterus. Bones were segmented within the body by identifying a range of Hounsfield Units between 150 and 3000, and the RBM volume was created automatically as a three-dimensional symmetric inner margin of 0.2 cm in the bones, excluding the teeth, with minor manual post-processing performed (e.g., small cavities filled and small volumes removed). The contours of the ovaries and RBM were confirmed by comparing the former's positions to those of the nominal locations identified by Pérez-Andújar et al [47] and the latter's regional anatomical percentages to those of the mathematical-model-based proportions of children derived by Cristy [62]. These images and contours were exported to RT Image and RT Structure Set objects in the Digital Imaging and Communications in Medicine-Radiation Therapy (DICOM-RT) format, which were de-identified to preserve anonymity of the patients and sent to AUBMC via password-protected and encrypted file transfer.
2.3. Treatment planning
Treatment planning methods followed those of previous studies [52, 57, 63] and are briefly reviewed here. CSI fields were consistent with those of routine clinical practice of each institution—photon CSI at AUBMC and proton CSI at MD Anderson. Each CSI plan comprised left and right lateral or slightly posterior oblique cranial fields and one to three adjacent posterior-anterior spinal fields, depending on the length of spine. The photon and proton treatment plans had a common intent, specifically, to sterilize potential residual cancer cells in the clinical target, i.e., the tumor bed, cranial cavity, and spinal canal.
Photon CSIs were planned and therapeutic doses were calculated using a commercial treatment planning system (Panther, version 4.72, Prowess Inc., Concord, CA, USA). Fields of 6-Megavolt energy were designed to deliver a prescribed dose, DRx, of 23.4 Gy in 1.8 Gy fractions in the clinical target. Although normally junctions of abutting fields would be shifted longitudinally twice during the course of treatment and sub-fields would be added to improve the distribution of dose, for this study, these shifts and sub-fields were disregarded.
Proton CSIs were planned and therapeutic doses were calculated using a commercial treatment planning system (Eclipse, version 8.9, Varian Medical Systems, Inc., Palo Alto, CA, USA). Passive-scattering spread-out proton beams of nominal energies (i.e., energies prior to range shifting and modulation) between 140 and 225 MeV were designed to deliver a DRx of 23.4 Gy-RBE in 1.8 Gy-RBE fractions in the clinical target of each field. Following the recommendation of the International Commission on Radiation Units and Measurements [64], we applied an RBE value of 1.1 for protons, such that the DRx corresponded to an absorbed dose of 21.3 Gy.
Boost doses directed to the tumor resection bed were omitted in this research study because they bear much less importance for SMN risk than CSI fields [65]. All treatment plans were reviewed and approved by a board-certified radiation oncologist of the corresponding clinic (AM or FG).
2.4. Mean equivalent dose in each organ and tissue
For each patient, the mean equivalent dose, HT, in each organ or tissue, T, was calculated as the mass-weighted mean of the equivalent dose in Sv, Hv, in each voxel, v, averaged over all v in T, or
where mv was the mass of the tissue in v, where

and where  was the mean radiation weighting factor and Dv was the absorbed dose in Gy in v. HT, Hv, and Dv were estimated separately for therapeutic and stray radiations. For organs and tissues that were not captured completely in the CT image sets, i.e., RBM, skin, remainder, and whole body volumes, HT values were reduced by the ratio of the mass of the captured portion of the patient to the mass of the patient recorded at treatment in his or her medical record. These values are listed in table 1.
Values of Dv from therapeutic radiation were calculated for each v throughout the modeled geometry of each patient using the TPS of each institution, with an isotropic dose calculation grid of 0.25 cm. The  value for all photons beams was taken as 1, and the
  value of therapeutic protons was estimated as the approximate mean quality factor of 1.1 at any point within the fields based on linear-energy-transfer, microdosimetric, and radiobiological studies [66–72]. We applied
  values from similar fields of previous studies, which found small variations between patients for neutrons produced inside the patients' bodies ('internal neutrons') and neutrons produced in the treatment unit ('external neutrons'). Specifically, the
  values were 7.8 for external neutrons from cranial fields, 8.1 for external neutrons from spinal fields and, and 9.0 for internal neutrons [50, 65].
Stray radiation dose was estimated in the following manner. In photon CSI, because out-of-field dose has been shown to be inaccurately calculated by TPSs [73–75], the in-field Hv values were kept and the out-of-field Hv values were replaced. In particular, a measurement-based model for out-of-field dose as a function of distance to the field edge derived in a previous study [75] was used to replace the Hv values that were at least 1 cm away from the 50% isodose surface. Specifically, the following equation was applied to determine Hv in Sv:
where α1 = 224.8 cm cGy Gy−1, μ1 = −2.16 cm, σ1 = 1.57 cm, α2 = 224.3 cm cGy Gy−1, μ2 = − 7.43 cm, and σ2 = 10.28 cm. In-house codes were used to replace the out-of-field Hv values in the DICOM-RT files. In proton CSI, stray neutron contributions to Hv were considered separately from the TPS because of the increased RBE for carcinogenesis of neutrons compared to protons. Because neutron doses are not calculated separately by the TPS, the Monte Carlo Proton Radiotherapy Treatment Planning system [76] was used to calculate contributions to Hv from neutrons, and these values were added to contributions to Hv from protons. Data were extracted from each patient's DICOM-RT files to produce input files to its dose engine (Monte Carlo N-Particle eXtended code, version 2.7c, Los Alamos National Laboratory, Los Alamos, NM, USA) for simulating particle tracking and dosimetry through a field-specific proton source definition and geometry of the passive-scattering treatment unit (Probeat, Hitachi America, Ltd, Brisbane, CA, USA) and CT-based voxelized anatomy of the patient. A lattice tally [77] determined Dv per source particle throughout the patient anatomy from therapeutic protons, internal neutrons, and external neutrons. For every patient and particle type, Dv per source particle value was, first, scaled by the planned percentage weight of each field and, second, divided by the mean therapeutic proton Dv per source particle averaged in a central normalization sub-volume of the clinical target. This resulted in Dv in terms of Gy per therapeutic proton Gy for every patient and particle type.
Uncertainties were propagated for voxel and organ doses. For proton CSI, the Monte Carlo simulations conferred less than 0.3% and less than 4% statistical uncertainty in HT from therapeutic protons and secondary neutrons, respectively. For photon CSI, uncertainties of less than 5% were applied for in-field Hv and the analytical model's root mean square deviation of 0.0167 Sv Gy−1 was applied for out-of-field Hv.
2.5. Radiogenic SMN risk for each cancer site
The lifetime attributable risk LAR, of SMN incidence, LARI,T, for each radiogenic solid-tumor site that corresponded to T was determined using a linear-no-threshold model,

in which IT values were risk coefficients interpolated linearly between ages that were listed for Href = 0.1 Sv for each sex and SMN site in tables 12D-1 of the BEIR VII Report of the National Research Council of the National Academies (NRCNA) [78]. Hremainder was used to estimate the risk of solid cancers that may be located outside of the listed specific cancer sites, or 'other solid' tumors. Because incidence risk coefficients for NMSC were not provided in the BEIR VII Report, we instead applied values of INMSC that were derived from ICRP Publication 60 [68], adjusting for age and sex, as described previously [65].
Unlike solid tumors, because the NRCNA recommended a no-threshold linear-quadratic model of risk as a function of dose for LARI,leukemia, it was necessary to give the projected risks of leukemia special consideration. For low to moderate doses, this could be done by applying the recommended quadratic rather than linear multiplicative term, D + θD2, where θ was related to the degree of curvature of the function. However, this model was based on the data of Preston et al [79], who fit a linear-quadratic model to updated dosimetric data in the range of 0–2 Gy. Their data was for atomic bomb survivors, and the recommended model did not account for cell sterilization, post-therapy repopulation, and circulation effects that may occur from fractionated exposures in a childhood radiotherapy cohort [80, 81]. Notwithstanding this omission, excess relative and absolute risk estimates of leukemia derived from medical radiation studies, with average doses ranging up to 2 Gy, were similar to those of the model [78 pp 13, 183, 188]. However, in the case of CSI of young children, the mean equivalent dose in the RBM can exceed 2 Sv and are neither acute nor chronic. For these reasons, we were motivated to not overestimate the LARI,leukemia for children in the same way as Berrington de Gonzelez et al, who cited the 'limited information about the shape of the dose response curve above about 2 Gy,' and lack of statistical power at high doses [82]. They reserved the linear-quadratic model for acute doses only, applied a linear model for chronic exposures, and restricted the application of their algorithm to 'lower than about 1 Gy' for childhood exposures. Similarly, we applied the full linear-quadratic model to 2 Sv and removed the quadratic term above 2 Sv. In other words,
where θ was 0.88 Sv−1. By combining like terms and inserting the values for θ and Href, equation (2) was simplified to the following:

As an example, this LARI,leukemia model is shown in figure 1 for a 5-year-old boy and a 5-year-old girl. Compared to applying the linear-quadratic model directly, this approach was intended to result in lower LARI,leukemia values at high HRBM, than if we applied the recommended linear-quadratic model directly.
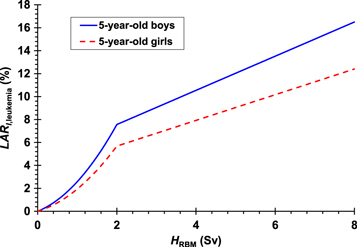
Figure 1. LAR of leukemia incidence for 5-year old boys (solid line) and a 5-year-old girls (dashed line) calculated by our model as a function of the mean equivalent dose in the red bone marrow.
Download figure:
Standard image High-resolution imageThe BEIR VII Report and ICRP Publication 60 contained recommendations for dose- and dose-rate effectiveness factors (DDREFs) to be applied to reduce the risk estimates of solid tumors for low-dose and low-dose-rate exposures. For solid tumors in which the exposures are of high dose but the dose rates are moderate or fractionated, DDREFs should be applied as 1.5 for all solid tumors except NMSC and 2.0 for NMSC. For leukemia, the rationale for DDREF had already been accounted in the curvature of the linear-quadratic portion of the BEIR VII model, so we did not correct additionally our risk values for leukemia.
The above methods were used in the same way to project the LAR of mortality for each cancer site, LARM,T, except substituting MT for IT, in which the values of MT were risk coefficients interpolated between ages listed for each sex and SMN site in Table 12D-2 of the BEIR VII Report. Because mortality risk coefficients were not provided in the BEIR VII Report for thyroid cancer and NMSC, for Mthyroid and MNMSC we multiplied the values of Ithyroid and INMSC, respectively, by the proposed lethality fractions for thyroid cancer (0.1) and NMSC (0.002), respectively, taken from ICRP Publication 60. Values of IT and MT derived for each patient are listed in table 1.
We did not consider a possible leveling (i.e., plateau) of the slope in the dose-effect model at high doses. This decision was based on the very limited evidence of this effect in cancer survivors, especially when considering individual SMN sites [46]. The exceptions of this are breast cancer, which may (or may not) plateau at high doses, and thyroid cancer, which appears to downturn at doses beyond those of this study [83, 84].
2.6. Total lifetime risk of any SMN
We calculated total lifetime risks of SMN incidence and mortality in the following manner. The total LAR of developing any cancer, LARI,total, was the sum of the LAR values for each cancer site, or

We assumed that the risk for development of a radiogenic cancer was independent of developing any other radiogenic cancers and that it is possible to develop multiple SMNs [2]. In other words, because of the mathematical possibility of attributing an incidence to multiple cancers, the sum was used and correlated terms were not subtracted. However, because of the mathematical impossibility of attributing a fatality due to multiple cancers, we calculated the total LAR of any fatal cancer, LARM,total, differently than LARI,total. Specifically, unlike the NRCNA, who calculated LARM,total as the sum of each LARM,T, we considered fatal cancers to be mutually exclusive events in the model, i.e., a person cannot die of one radiogenic cancer and then subsequently die of other radiogenic cancers. In this case, the correlated terms—LARM,bladder × LARM,breast, LARM,bladder × LARM,breast × LARM,colon, and so on—would need to be omitted. However, rather than taking the sum of all LARM,T and then subtracting all correlated terms, to account for this, we used the following methods to achieve the equivalent result. The probability of surviving of any single radiogenic cancer, ST, was defined as the complement of LARM,T, so that ST was one minus LARM,T. Similarly, the probability of surviving all SMNs, Stotal, was one minus LARM,total. Assuming that each ST was independent of surviving all other cancers, Stotal was the product of the probabilities of surviving each SMN. As a result, the following was true:
In summary, like the NRCNA, we used equation (7) to determine LARI,total, and, unlike the NRCNA, we used equation (8) to determine LARM,total.
2.7. Ratio of SMN risk
When comparing two treatment modalities in terms of SMN risk, it has been shown that the ratios of LAR carry less uncertainty than absolute LAR values [85–88]. Therefore, as a relative figure of merit, we defined the ratio of the LAR from proton CSI to the LAR from photon CSI, RLAR, or

In both incidence and mortality, the risk coefficients of each cancer site cancel each other in the numerator and the denominator of RLAR, resulting in identical values for RLARI,T and RLARM,T. Therefore, we reported RLART values, which were applicable to incidence and mortality. However, the same was not true for RLARI,total and RLARM,total, so these ratios were calculated separately for incidence and mortality. We reported mean RLAR values averaged across all patients for each T,  any T for incidence,
  and any T for mortality,
  Unlike dose values, variances in these mean RLAR values were reported at approximately the 95% confidence level (i.e., as two sample standard deviations). One-sided t-tests (α = 0.05) were performed separately to determine whether
  and
and  were significantly less than 1 (H0:
  = 1, HA:
  < 1), which would indicate that proton CSI confers less LAR than photon CSI with significance.
3. Results
3.1. Mean equivalent dose in each organ and tissue
Values of HT are listed in table 2 for photon CSI at AUBMC and proton CSI at MD Anderson for the five girls and four boys in this study. Most HT values followed a general trend of being larger for younger children than for older children, indicating HT is the strongly affected by the size of the patient. The most notable exception to this was Hliver in proton CSI, which had the opposite trend of larger values for older patients. For HRBM and Hprostate in photon CSI and HRBM, Hbreasts, Hliver, Hovaries, and Huterus in proton CSI, we did not observe a dependency on age. For each patient, in photon CSI, the HT values were greater than 1 Sv in all T, except for the prostate. However, in proton CSI, only HRBM, Hremainder, Hskin, and Hlungs were greater than 1 Sv. In some cases, high HT values indicated that the photon CSI therapeutic fields crossed organs at risk that are not usually considered to be within the CSI target, for example, the bladder of the 3-year-old boy. The overall statistical uncertainties in HT ranged from less than 1% for most T to less than 10% for small organs and tissues (i.e., prostate, uterus, and ovaries).
Table 2. Mean equivalent doses in organs and tissues, HT, and in the whole body in photon CSI or proton CSI, expressed in Sv for a 23.4 Gy CSI treatment. The standard deviations of the means in this table were for the variability between patients, not for statistical uncertainty by error propagation.
| Age at exposure (y): | 2 | 3 | 6 | 6 | 8 | 9 | 9 | 13 | 13 | ||
| Sex: | F | M | M | F | F | F | M | F | M | ||
| Patient index: | 1 | 2 | 3 | 4 | 5 | 6 | 7 | 8 | 9 | ||
| Photon CSI | |||||||||||
| Organ or tissue | Average | Standard deviation | |||||||||
| Whole body | 7.476 | 7.269 | 4.774 | 4.585 | 4.540 | 5.187 | 4.955 | 3.989 | 3.565 | 5.149 | 1.352 |
| Bladder | 2.536 | 7.103 | 1.892 | 1.449 | 1.388 | 1.276 | 1.118 | 1.065 | 1.215 | 2.116 | 1.927 |
| Red bone marrow | 5.874 | 4.922 | 6.161 | 6.378 | 6.712 | 4.555 | 6.156 | 7.233 | 4.598 | 5.843 | 0.951 |
| Breast tissue | 5.450 | — | — | 1.798 | 1.658 | 1.790 | — | 1.068 | — | 2.353 | 1.757 |
| Liver | 7.640 | 5.285 | 4.211 | 5.318 | 3.912 | 4.547 | 4.688 | 4.193 | 4.054 | 4.872 | 1.154 |
| Lungs | 9.455 | 3.917 | 2.816 | 3.549 | 2.754 | 2.980 | 3.304 | 2.953 | 2.120 | 3.761 | 2.195 |
| Ovaries | 2.291 | — | — | 1.192 | 2.565 | 1.360 | — | 1.203 | — | 1.722 | 0.655 |
| Prostate | — | 0.992 | 0.825 | — | — | — | 0.856 | — | 1.041 | 0.928 | 0.105 |
| Remainder | 7.964 | 8.598 | 5.381 | 4.974 | 5.001 | 6.084 | 5.511 | 4.259 | 4.042 | 5.757 | 1.566 |
| Skin | 4.014 | 3.797 | 2.334 | 2.255 | 2.187 | 2.701 | 2.527 | 2.566 | 1.605 | 2.665 | 0.771 |
| Stomach | 14.338 | 3.078 | 2.202 | 2.066 | 3.144 | 4.785 | 1.949 | 5.726 | 2.469 | 4.417 | 3.937 |
| Thyroid | 18.885 | 18.418 | 17.999 | 16.251 | 16.181 | 16.058 | 17.791 | 16.447 | 15.789 | 17.091 | 1.173 |
| Uterus | 1.951 | — | — | 1.207 | 1.921 | 1.331 | — | 1.077 | — | 1.497 | 0.410 |
| Colon | 11.166 | 6.282 | 5.086 | 5.207 | 5.880 | 4.616 | 4.945 | 5.783 | 3.398 | 5.818 | 2.173 |
| Proton CSI | |||||||||||
| Organ or tissue | Average | Standard deviation | |||||||||
| Whole body | 5.205 | 6.074 | 4.246 | 3.692 | 3.800 | 4.281 | 3.059 | 2.731 | 2.447 | 3.948 | 1.168 |
| Bladder | 0.134 | 0.391 | 0.178 | 0.143 | 0.077 | 0.140 | 0.131 | 0.130 | 0.043 | 0.152 | 0.098 |
| Red bone marrow | 5.020 | 4.465 | 5.427 | 5.102 | 6.155 | 4.251 | 4.062 | 6.384 | 3.110 | 4.886 | 1.038 |
| Breast tissue | 0.237 | — | — | 0.219 | 0.203 | 0.270 | — | 0.267 | — | 0.239 | 0.029 |
| Liver | 0.451 | 0.544 | 0.509 | 0.407 | 0.611 | 0.527 | 0.299 | 0.713 | 0.218 | 0.475 | 0.153 |
| Lungs | 3.440 | 3.876 | 2.675 | 3.558 | 1.875 | 3.161 | 1.441 | 2.242 | 1.415 | 2.631 | 0.933 |
| Ovaries | 0.198 | — | — | 0.193 | 0.170 | 0.221 | — | 0.256 | — | 0.208 | 0.032 |
| Prostate | — | 0.131 | 0.138 | — | — | — | 0.123 | — | 0.010 | 0.101 | 0.061 |
| Remainder | 5.933 | 7.473 | 4.864 | 4.142 | 4.408 | 5.239 | 3.519 | 2.984 | 2.879 | 4.605 | 1.479 |
| Skin | 4.166 | 4.322 | 3.300 | 2.931 | 3.137 | 3.200 | 2.428 | 2.609 | 2.006 | 3.122 | 0.758 |
| Stomach | 0.237 | 0.552 | 0.856 | 0.529 | 0.461 | 0.325 | 0.283 | 0.342 | 0.196 | 0.420 | 0.206 |
| Thyroid | 0.792 | 0.727 | 0.769 | 0.488 | 0.499 | 0.547 | 0.763 | 0.841 | 0.529 | 0.662 | 0.142 |
| Uterus | 0.229 | — | — | 0.198 | 0.106 | 0.220 | — | 0.239 | — | 0.199 | 0.054 |
| Colon | 0.491 | 0.380 | 0.568 | 0.301 | 0.489 | 0.422 | 0.750 | 0.366 | 0.183 | 0.439 | 0.163 |
In general, even after accounting for stray radiation, mean HT values were higher for photon CSI than for proton CSI. These values and their 95% confidence intervals are listed in table 2. The average HT was higher for photon CSI than for proton CSI for all T, except the skin, which had approximately equal HT. Only a slight reduction in average HT for proton CSI was observed for the lungs, remainder, and RBM. The variances in HT were due to the trends in HT with age as well as the degree of partial irradiation of some organs and tissues, not because of statistical uncertainties. Apart from the whole body volume, the organs and tissues that received the highest average HT values in photon CSI were the thyroid, RBM, colon, and remainder, and those for proton CSI were the RBM, remainder, skin, and lung.
In proton CSI, neutrons accounted for large portions of HT for several organs and tissues. Contributions to HT from external and internal neutrons along with average values are listed for each patient in table 3. Neutrons accounted for more than 40% of the average HT in the prostate, breast tissue, ovaries, uterus, bladder, thyroid, stomach, liver, and colon. In these organs and tissues, more than two-thirds of the neutron equivalent doses were from external neutrons, except for the thyroid, in which there was an even contribution between external and internal neutrons.
Table 3. Mean equivalent doses in organs and tissues, HT, and in the whole body from external or internal neutrons in proton CSI, expressed in Sv. The standard deviations of the means in this table were for the variability between patients, not for statistical uncertainty by error propagation.
| Age at exposure (y): | 2 | 3 | 6 | 6 | 8 | 9 | 9 | 13 | 13 | ||
| Sex: | F | M | M | F | F | F | M | F | M | ||
| Patient index: | 1 | 2 | 3 | 4 | 5 | 6 | 7 | 8 | 9 | ||
| External neutrons from proton CSI | |||||||||||
| Organ or tissue | Average | Standard deviation | |||||||||
| Whole body | 0.115 | 0.114 | 0.118 | 0.122 | 0.116 | 0.137 | 0.133 | 0.181 | 0.094 | 0.126 | 0.024 |
| Bladder | 0.099 | 0.116 | 0.118 | 0.102 | 0.058 | 0.110 | 0.104 | 0.086 | 0.031 | 0.092 | 0.029 |
| Red bone marrow | 0.095 | 0.093 | 0.095 | 0.099 | 0.102 | 0.107 | 0.106 | 0.148 | 0.074 | 0.102 | 0.020 |
| Breast tissue | 0.150 | — | — | 0.151 | 0.148 | 0.186 | — | 0.214 | — | 0.170 | 0.029 |
| Liver | 0.139 | 0.149 | 0.176 | 0.153 | 0.183 | 0.192 | 0.169 | 0.255 | 0.139 | 0.173 | 0.036 |
| Lungs | 0.167 | 0.186 | 0.211 | 0.200 | 0.208 | 0.242 | 0.232 | 0.322 | 0.205 | 0.219 | 0.044 |
| Ovaries | 0.114 | — | — | 0.118 | 0.122 | 0.143 | — | 0.160 | — | 0.131 | 0.020 |
| Prostate | — | 0.107 | 0.107 | — | — | — | 0.103 | — | 0.008 | 0.081 | 0.049 |
| Remainder | 0.116 | 0.116 | 0.118 | 0.122 | 0.115 | 0.139 | 0.133 | 0.182 | 0.095 | 0.126 | 0.024 |
| Skin | 0.116 | 0.111 | 0.120 | 0.124 | 0.124 | 0.141 | 0.131 | 0.184 | 0.091 | 0.127 | 0.026 |
| Stomach | 0.150 | 0.145 | 0.187 | 0.165 | 0.155 | 0.179 | 0.175 | 0.226 | 0.143 | 0.169 | 0.026 |
| Thyroid | 0.179 | 0.183 | 0.192 | 0.184 | 0.187 | 0.211 | 0.224 | 0.293 | 0.216 | 0.208 | 0.036 |
| Uterus | 0.111 | — | — | 0.118 | 0.077 | 0.144 | — | 0.148 | — | 0.119 | 0.029 |
| Colon | 0.123 | 0.116 | 0.152 | 0.135 | 0.147 | 0.156 | 0.146 | 0.185 | 0.112 | 0.141 | 0.023 |
| Internal neutrons from proton CSI | |||||||||||
| Organ or tissue | Average | Standard deviation | |||||||||
| Whole body | 0.156 | 0.183 | 0.140 | 0.120 | 0.120 | 0.145 | 0.115 | 0.101 | 0.084 | 0.129 | 0.030 |
| Bladder | 0.032 | 0.031 | 0.049 | 0.036 | 0.017 | 0.029 | 0.027 | 0.042 | 0.010 | 0.030 | 0.012 |
| Red bone marrow | 0.105 | 0.103 | 0.117 | 0.100 | 0.132 | 0.111 | 0.103 | 0.161 | 0.072 | 0.112 | 0.024 |
| Breast tissue | 0.074 | — | — | 0.060 | 0.053 | 0.069 | — | 0.050 | — | 0.061 | 0.010 |
| Liver | 0.060 | 0.052 | 0.086 | 0.065 | 0.072 | 0.080 | 0.056 | 0.087 | 0.053 | 0.068 | 0.014 |
| Lungs | 0.109 | 0.099 | 0.121 | 0.107 | 0.097 | 0.128 | 0.089 | 0.118 | 0.086 | 0.106 | 0.015 |
| Ovaries | 0.043 | — | — | 0.038 | 0.048 | 0.045 | — | 0.063 | — | 0.048 | 0.010 |
| Prostate | — | 0.013 | 0.027 | — | — | — | 0.019 | — | 0.000 | 0.015 | 0.011 |
| Remainder | 0.176 | 0.225 | 0.157 | 0.134 | 0.134 | 0.171 | 0.130 | 0.108 | 0.096 | 0.148 | 0.039 |
| Skin | 0.110 | 0.116 | 0.097 | 0.086 | 0.101 | 0.108 | 0.081 | 0.081 | 0.059 | 0.093 | 0.018 |
| Stomach | 0.079 | 0.053 | 0.101 | 0.067 | 0.067 | 0.077 | 0.059 | 0.095 | 0.052 | 0.072 | 0.017 |
| Thyroid | 0.226 | 0.226 | 0.255 | 0.208 | 0.210 | 0.229 | 0.241 | 0.208 | 0.154 | 0.218 | 0.029 |
| Uterus | 0.041 | — | — | 0.039 | 0.028 | 0.046 | — | 0.055 | — | 0.042 | 0.010 |
| Colon | 0.053 | 0.033 | 0.089 | 0.064 | 0.078 | 0.063 | 0.054 | 0.081 | 0.050 | 0.063 | 0.018 |
3.2. Radiogenic SMN risks for each cancer site
The average projected LARI,T values (figure 2(a)) were higher in photon CSI than in proton CSI for every radiogenic cancer category, with the exception of NMSC, and these risks varied greatly between cancer sites. Average projected lifetime risks of incidence greater than 10% were found in other solid tumors, NMSC, lung cancer, and leukemia in both photon and proton CSI and in thyroid cancer, breast cancer, and colon cancer in photon CSI. Average projected absolute reductions in risk of incidence by more than 11% by applying proton CSI rather than photon CSI were observed in thyroid cancer, breast cancer, and colon cancer. Compared to boys, girls were at more than twice the lifetime risk for thyroid cancer, lung cancer, and NMSC in both modalities and stomach cancer in photon CSI. Compared to girls, boys were at elevated lifetime risk of developing a liver cancer and bladder cancer in both modalities and colon cancer in proton CSI. Children of ages at exposure less than 8 years had higher lifetime risk of incidence than children of ages at exposure greater than 8 years in every cancer site for both modalities, and this was true by more than a factor of 2 for bladder cancer and other solid tumors in both modalities, prostate cancer in proton CSI, and breast cancer and lung cancer in photon CSI.

Figure 2. Mean LAR values of SMN incidence (top panel) and mortality (bottom panel), averaged across all patients for photon CSI and proton CSI. One-sided error bars represent the 95% confidence interval in each mean value for a particular SMN and do not take into account the large uncertainties in the risk model.
Download figure:
Standard image High-resolution imageThe average projected LARM,T values (figure 2(b)) were higher in photon CSI than in proton CSI for every radiogenic cancer site having non-negligible LARM,T, and these risks varied greatly between cancer sites. The highest average lifetime risks of mortality (i.e., greater than 4%) were for lung cancer, other solid tumors, and leukemia in both modalities and for colon cancer and breast cancer in photon CSI. Average projected reductions in risk of mortality by more than 4% by applying proton CSI rather than photon CSI were observed in colon cancer, lung cancer, and breast cancer in girls. Compared to boys, girls were at more than twice the lifetime risk of a fatal thyroid or lung cancer for both modalities and a fatal stomach cancer for photon CSI. In these T, they also had much larger risk coefficients than boys. Compared to girls, boys were at almost twice the lifetime risk of developing a fatal colon cancer in photon CSI. With the exception of leukemia, children of ages at exposure less than 8 years had higher lifetime risk of mortality than children of ages at exposure greater than 8 years for every cancer site and both modalities, and this was true by more than a factor of 2 for bladder cancer and other solid tumors in both modalities, prostate cancer in proton CSI, and breast cancer and lung cancer in photon CSI. Unlike with incidence, we did not observe a relationship between the lifetime risk of a fatal leukemia and age at exposure in photon CSI or proton CSI.
3.3. Total lifetime risks of any SMN
For each treatment, total risks of any SMN incidence and SMN fatality were computed as LARI,total and LARM,total, respectively, while excluding the unrealistic risk of a fatality from multiple cancer sites (see section 2.4). The variations in the average values below were reported as two sample standard deviations of each mean value and, therefore, reflect variability across ages rather than the small uncertainties in physical dose calculations or large uncertainties in the risk model.
The mean LARI,total values averaged across patients of all ages and both sexes were 168% ± 111% and 88% ± 44% for photon CSI and proton CSI, respectively. The girls were at higher risk of any SMN incidence than the boys by factors of 1.98 ± 1.53 and 1.47 ± 1.07 for photon CSI and proton CSI, respectively. Children less than 8 years of age at exposure were at approximately twice the LARI,total than children greater than 8 years of age for either treatment modality. NMSC accounted for approximately one-sixth and one-third of LARI,total of each patient for photon CSI and proton CSI, respectively. In proton CSI, the contributions to LARI,total from external neutrons and internal neutrons were small compared to those of therapeutic protons, specifically, they were 5.0% ± 2.1% and 3.6% ± 1.7%, respectively, or, together, one-tenth of the overall risk.
The mean LARM,total values averaged across patients of all ages and both sexes were 41% ± 18% and 26% ± 10% for photon CSI and proton CSI, respectively. The girls were at higher risk of any fatal SMN than the boys by factors of 1.43 ± 0.78 and 1.34 ± 0.77 for photon CSI and proton CSI, respectively. Children less than 8 years of age at exposure about 1.6 times higher LARM,total than children greater than 8 years of age at exposure for either treatment modality. In proton CSI, the contributions to LARM,total from external neutrons and internal neutrons were small compared to those of primary protons, specifically, they were 1.8% ± 0.6% and 1.1% ± 0.4%, respectively, or, together, one-ninth of the overall risk.
3.4. Ratios of SMN risks
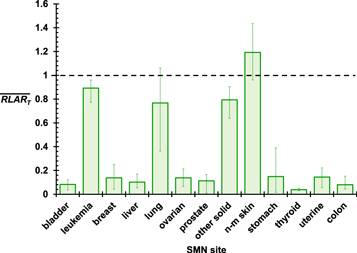
The values of  for the nine patients are shown in figure 3 for each T. The
  values were much less than 1 for subsequent bladder, breast, liver, ovarian, prostate, stomach, thyroid, uterine, and colon cancers and less than 1 for other solid tumors, leukemia, and lung cancer. Among these, the statistical significance of
  < 1 was weakest for subsequent lung cancer, having a p-value of 0.012 for its one-sided t-test. In two cases, the 6- and 9-year-old girls, RLARlung was not less than 1. RLARNMSC was greater than 1 for each patient except the 9-year-old boy, which suggests that proton CSI is of no benefit over photon CSI for reducing the risk of NMSC. The only cancer site in which a relationship was observed clearly between RLART and age was breast cancer, for which the RLART values increased with age, indicating that a larger reduction in breast cancer risk by proton CSI may be achieved for younger girls than for older girls.
Figure 3. Mean ratios of LAR values from proton CSI to those of photon CSI averaged across all patients for each known radiogenic SMN site. The error bars show the spread between maximum and minimum values for all nine patients.
Download figure:
Standard image High-resolution image
Values of  and
and  for the cohort were 0.56 (95% CI, 0.37–0.75) and 0.64 (95% CI, 0.45–0.82), respectively. This result indicated with statistical significance the potential of reducing the risk of SMN in future pediatric MB patients in LMICs by replacing photon CSI with proton CSI. Specifically, the projected lifetime risks of SMN incidence and mortality were reduced by 44% and 36%, respectively. The value of
  was slightly lower for girls than for boys, but
  values were similar between girls and boys. This could be interpreted as a slightly stronger potential reduction in SMN incidence for girls compared to boys by using proton CSI rather than photon CSI. Similar values of
  and
and  were observed in younger children and in older children.
4. Discussion
In this inter-institutional, international in-silico clinical trial, we tested for the potential reduction in lifetime SMN risk if children with MB in LMIC were to be treated with proton CSI instead of photon CSI. We found that the projected lifetime risks of SMN incidence and mortality were reduced by 44% and 36%, respectively, by proton CSI. The risks of SMN incidence were especially reduced for thyroid, breast, and colon cancer and were not reduced for NMSC. The largest differences in the lifetime risk of a fatal SMN were found for colon, lung, breast, thyroid, and other solid tumors. For most specific SMN sites, the average lifetime risks of SMN incidence or mortality were reduced by more than a factor of 6 by proton CSI. We found that, in general, girls were at higher risk than boys, younger patients were at higher risk than older patients, and proton CSI reduced the SMN risk for girls more than it did for boys.
Lung cancer was identified as the specific cancer site both of the greatest concern and having the greatest opportunity for preventing a fatal SMN by replacing photon CSI with proton CSI. This was especially true for girls. Among site-specific SMNs, lung cancer accounted for more than half the mortality risk. The potential difference in risk of a lung cancer fatality between photon CSI and proton CSI was 5.4%. For these reasons, this study has identified the lungs as an organ at risk needing urgent attention in the treatment of childhood MB to reduce the radiation dose and subsequent risk of SMN. Another concerning cancer site for girls, especially young girls, was breast cancer, with a difference of 4.6% in the risk of a fatality between photon CSI and proton CSI. Minimizing the lateral margins of the spinal fields but ensuring precise set up would reduce exit dose through the lungs, and breast tissue in girls, without compromising on the dose in the clinical target.
Our finding of the reduced LARI and LARM for proton CSI versus photon CSI was consistent with those of other predictive risk studies in the literature. However, the reductions were weaker in this study compared to previous studies [49, 51, 89]. For example, the values of  and
and  in this inter-institutional study (0.56 ± 0.19 and 0.64 ± 0.19, respectively) were at least twice those of a previous intra-institutional study (0.15 ± 0.04 and 0.32 ± 0.09, respectively) [51]. One reason for the difference in results between the two studies was that our study accounted for all known SMN sites while the previous study combined subsequent leukemia, uterine cancer, ovarian cancer, and NMSC into the other solid tumors category. If leukemia, uterine cancer, ovarian cancer, and NMSC were removed, our
  and
and  values (0.40 ± 0.20 and 0.59 ± 0.22, respectively) would shift closer to those of the previous study. Another difference between the studies that may affect the ratios of risks was the lower average age in the sample set in this study (8 years) compared to that of the previous study (9 years). The remaining differences in risks between the two studies reveal that SMN risks may differ between institutions, in particular, for photon CSI. An independent study by Stokkevåg et al [89] applied the same risk model as our study to compare second cancer risks between CSI modalities for 6 children of ages 5–11 years. They reported mean LARI,total values of 78% and 11% for photon CSI and passive-scattering proton CSI, respectively. However, they considered only subsequent bladder, liver, stomach, colon, lung, and thyroid cancer. If we neglected breast cancer, ovarian cancer, prostate cancer, other solid tumors, NMSC, uterine cancer, and leukemia, then our mean LARI,total values aligned well with theirs, at 78% ± 56% and 15% ± 8% for photon CSI and proton CSI, respectively.
Our results may be compared roughly to those of epidemiological studies of childhood MB survivors. However, with the exceptions of subsequent leukemias, gliomas, or meningiomas that may occur within a few years of radiotherapy [21, 90–93], lifelong follow-up is needed to fully appreciate the CIs of most SMNs because of their extended latency periods [20]. As long-term follow-up data for proton CSI is particularly absent in the literature, we restricted our comparison to photon CSI. At 30 years after exposure, the North American CCSS found CIs of 11% SMN and 4.1% NMSC in MB or PNET survivors who received radiotherapy [44]. The following non-CSI-specific studies are useful in approximating how these CIs will multiply with lifetime follow-up. Between 30 and 40 years after childhood exposure, a French and British study [94] found the CI of radiotherapy-induced kidney cancer to triple. Beyond 45 years after exposure, the CI continued to steadily increase. Between ages 40 and 55 years, the CCSS [95] found CIs of new SMN of 18% and new NMSC of 20%. From ages 60 and 80 years, a Nordic study of pre-chemotherapy childhood survivors [96] found that the CI of SMN increased from 18% to 48%, a factor of 2.7. Taking these multiplicative factors into account to extrapolate the CSI-specific data well beyond 30 years of follow-up, our projected average lifetime risks of SMN and NMSC of 142% and 26%, respectively, resembled the epidemiological data. In addition, the sample set in our study was younger than those of the above studies, and we found that younger children receiving CSI were at twice the risk of SMNs than older children. On this basis, our projected lifetime risks may be more reliable for childhood MB survivors than the limited CSI-specific historical data collected to date.
In proton CSI, the contributions to total risks of SMN incidence or mortality from secondary neutrons were small but not negligible. In general, their fractions of risks (approximately one-ninth) aligned well with those of most previous proton CSI studies [50, 52, 65, 97, 98]. Some minor differences may be attributable to the sizes of the bodies of the patients, the choice of  values for neutrons, and the application of a risk model, especially for leukemia. This result further strengthened our previous observations that only small, probably clinically-insignificant reductions in risk would be achieved by eliminating external neutrons, e.g., using magnetically-scanned machines [99]. That said, the potential advantages of intensity-modulated proton therapy for reducing the risk by better conformity of the therapeutic proton dose to the target volumes have not been evaluated. We conclude that, although it is clear that investigations into reducing secondary neutron exposures are warranted [100], their influence on total risks of SMN incidence and mortality were small compared to that of therapeutic protons. For this reason, developing methods of reducing exposures of healthy tissues to therapeutic proton fields, e.g., through intensity-modulated proton therapy [101], may be of much greater value than reducing secondary neutron exposures [102].
Based on the results of this study, it is possible to derive an approximate number of fatal SMNs that may be avoided if proton therapy were expanded to children in all developing countries. Approximately 1.64 billion children of ages 14 or less live in developing countries [18, 19] having 8300 annual diagnoses of MB [17, 103]. Applying a 5-year event-free survival probability of 81% [45, 104], among those who are treated, approximately 6700 new long-term survivors of pediatric MB emerge in developing countries per year. Then, using the difference in mean LARM,total between photon CSI and proton CSI in our study, we find that 1010 subsequent cancer deaths in childhood MB survivors could be prevented annually if proton therapy became available globally. Assuming a conservative 3% annual growth rate [103, 105], 48 000 cancer deaths could be prevented over 30 years. The same methodology can be applied to estimate the benefit of a single installation in a region of developing countries, such as in Lebanon. A centralized proton therapy center in Lebanon would attract patients from the region of the Middle East comprising Lebanon, Syria, Jordan, and Iraq (LSJI). Approximately 24 million children under 14 years of age live in LSJI [60], among whom will be 4000 new cases of cancer each year [17]. Among pediatric cancer patients treated at AUBMC, 11% have CNS cancer, a third of whom are diagnosed with MB [106]. Assuming the same proportion for the regional population, we estimate the number of childhood MBs in LSJI each year as 150, which corresponds to the potential of preventing 870 cancer deaths over 30 years with proton CSI.
Centralized proton therapy may also result in a health-care cost savings. The least expensive proton therapy option on the market today costs approximately $30 million for a two-gantry solution [107]. A conventional single linear accelerator installation costs conservatively $3 million [108]. Assuming a life cycle of 30 years for proton therapy and 10 years for a linear accelerator, the added cost of a proton therapy machine for two treatment rooms would be $12 million over 30 years [109]. To put this amount into perspective, this is approximately one-fortieth of the cost of a single medication (trastuzumab) to treat breast cancer in Lebanon [110] in the same time period. By dedicating half of one gantry to treat pediatric MB using proton CSI rather than photon CSI, the added cost per prevented SMN fatality would be roughly $3500. The average cost of treating a single cancer in Lebanon is $7800 per patient [110]. Neglecting travel and other tertiary costs, the above analysis provides a first approximation of the long-term beneficial cost-effectiveness of centralized proton therapy for the 24 million children within reach of Beirut by bus [19].
In general, we found that organ equivalent doses were strongly dependent on the size of the patient. This emphasized the importance of considering a variety of ages when performing dosimetric studies in the pediatric radiotherapy setting and suggested that the contouring of organs at risk for SMNs as a routine clinical practice in CSI should be considered so that these organs can be more deliberately avoided. Similarly to the previous intra-institutional study, we did not find differences in  between younger and older children.
The main limitation of this study was uncertainties in our SMN risk estimation [78, 111], due primarily to the large assumptions in the risk model and not due to the physical absorbed dose. Some of these uncertainties resulted from the following: sampling variability when developing the models, estimating DDREF in a radiotherapy setting, relative biological effectiveness of the radiation, nonlinearities in the relationships between risk and dose, bias in applying risk models and lethality factors based on the Life Span Study cohort to other populations [78], incomplete follow-up of exposed populations on which the models were based, and errors in dosimetry, disease detection, and diagnosis for these populations [111]. Specifically, we applied a model based largely on Japanese children exposed 70 years ago to in an atomic bomb setting and not on US and Arab pediatric radiotherapy follow-up data. Although there is no evidence to reject the extrapolation of linear-no-threshold models to higher doses for solid tumors, it is notable that the data on which the model was based was lacking at high doses such as those experienced in the radiotherapeutic setting. In the case of leukemia, we conservatively adjusted the recommendation from the NRCNA to avoid vastly overestimating the risks at high RBM doses. Second, the DDREF recommended by the NRCNA carried large uncertainties, and a DDREF for daily, fractionated exposures was not provided—its error by applying the model to fractionated rather than acute exposures could be as much as a factor of 2 [78]. That said, a review of the epidemiological literature by Berrington de Gonzalez et al [112] revealed that 'carcinogenesis from fractionated high-dose exposures (i.e., more than 5 Gy) are generally consistent with current theoretical models' that were based mainly on comparatively low-dose (i.e., less than 2 Gy) data. Third, RBEs may differ greatly between the mixed photon-neutron radiation exposures of the atomic bomb survivors and photon or proton-neutron CSI settings, and incorrectly accounting for these three factors may have lead to systematic biases. Ultimately, to reduce these uncertainties, models to predict LAR of non-fatal or fatal SMNs in pediatric cancer patients should be derived from large-cohort childhood cancer populations [113]. Because of the large uncertainties in absolute risks, it has been argued that only ratios of risk should be reported when comparing SMNs in clinical or research settings [87]. Others have asserted that only clinical data with decades of follow-up should affect clinical decisions [114, 115]. Although we agree that the ratios of risks are more reliable than absolute risk projections [85, 86, 88], when reporting ratios of risk, it is important to weigh the relevance or impact of those values by also making rough estimates of absolute risk. Otherwise, if judging by RLAR values alone, one could make incorrect conclusions about the importance of proton CSI in reducing certain SMN fatalities. The improper interpretation of ratios of risk could be solved by also providing either quantitative estimates (i.e., percent) [82] or categorical estimates (i.e., negligible, low, moderate, high, or very high) [26].
In conclusion, we found that the availability of proton therapy to children with MB in LMICs may significantly reduce the total lifetime risk of subsequent malignancies and identified lung cancer as the specific site of highest projected risk of any fatal SMN. Our findings support the expansion of access to proton therapy to pediatric cancer patients in regions in which proton beams are not available, including LMICs, to reduce normal tissue exposures and subsequent radiogenic risks. Such expanded access through regional centers may now be economically feasible. Because the absolute lifetime risks were very high, additional methods of reducing radiation exposures from primary (therapeutic) fields in normal tissues at risk for SMN should be explored as a high priority.
Acknowledgments
The authors are grateful for the assistance of Wendi Koontz-Raisig in contouring organs at risk and Dr Zeinab Charaf in formalizing the leukemia risk model. This work was supported in part by the Fogarty International Center award K01TW008409, the National Cancer Institute award 1R01CA131463-01A1, and Northern Illinois University through a subcontract of Department of Defense award W81XWH-08-1-0205. The content is solely the responsibility of the authors and does not necessarily represent the official views of the sponsors. In memory of Deborah Taddei, Margaret Newhauser, and Kathryn Carnes.
Footnotes
- 7
Low- and middle-income countries are those so classified by The World Bank, Country and Lending Groups.